
1. Questions
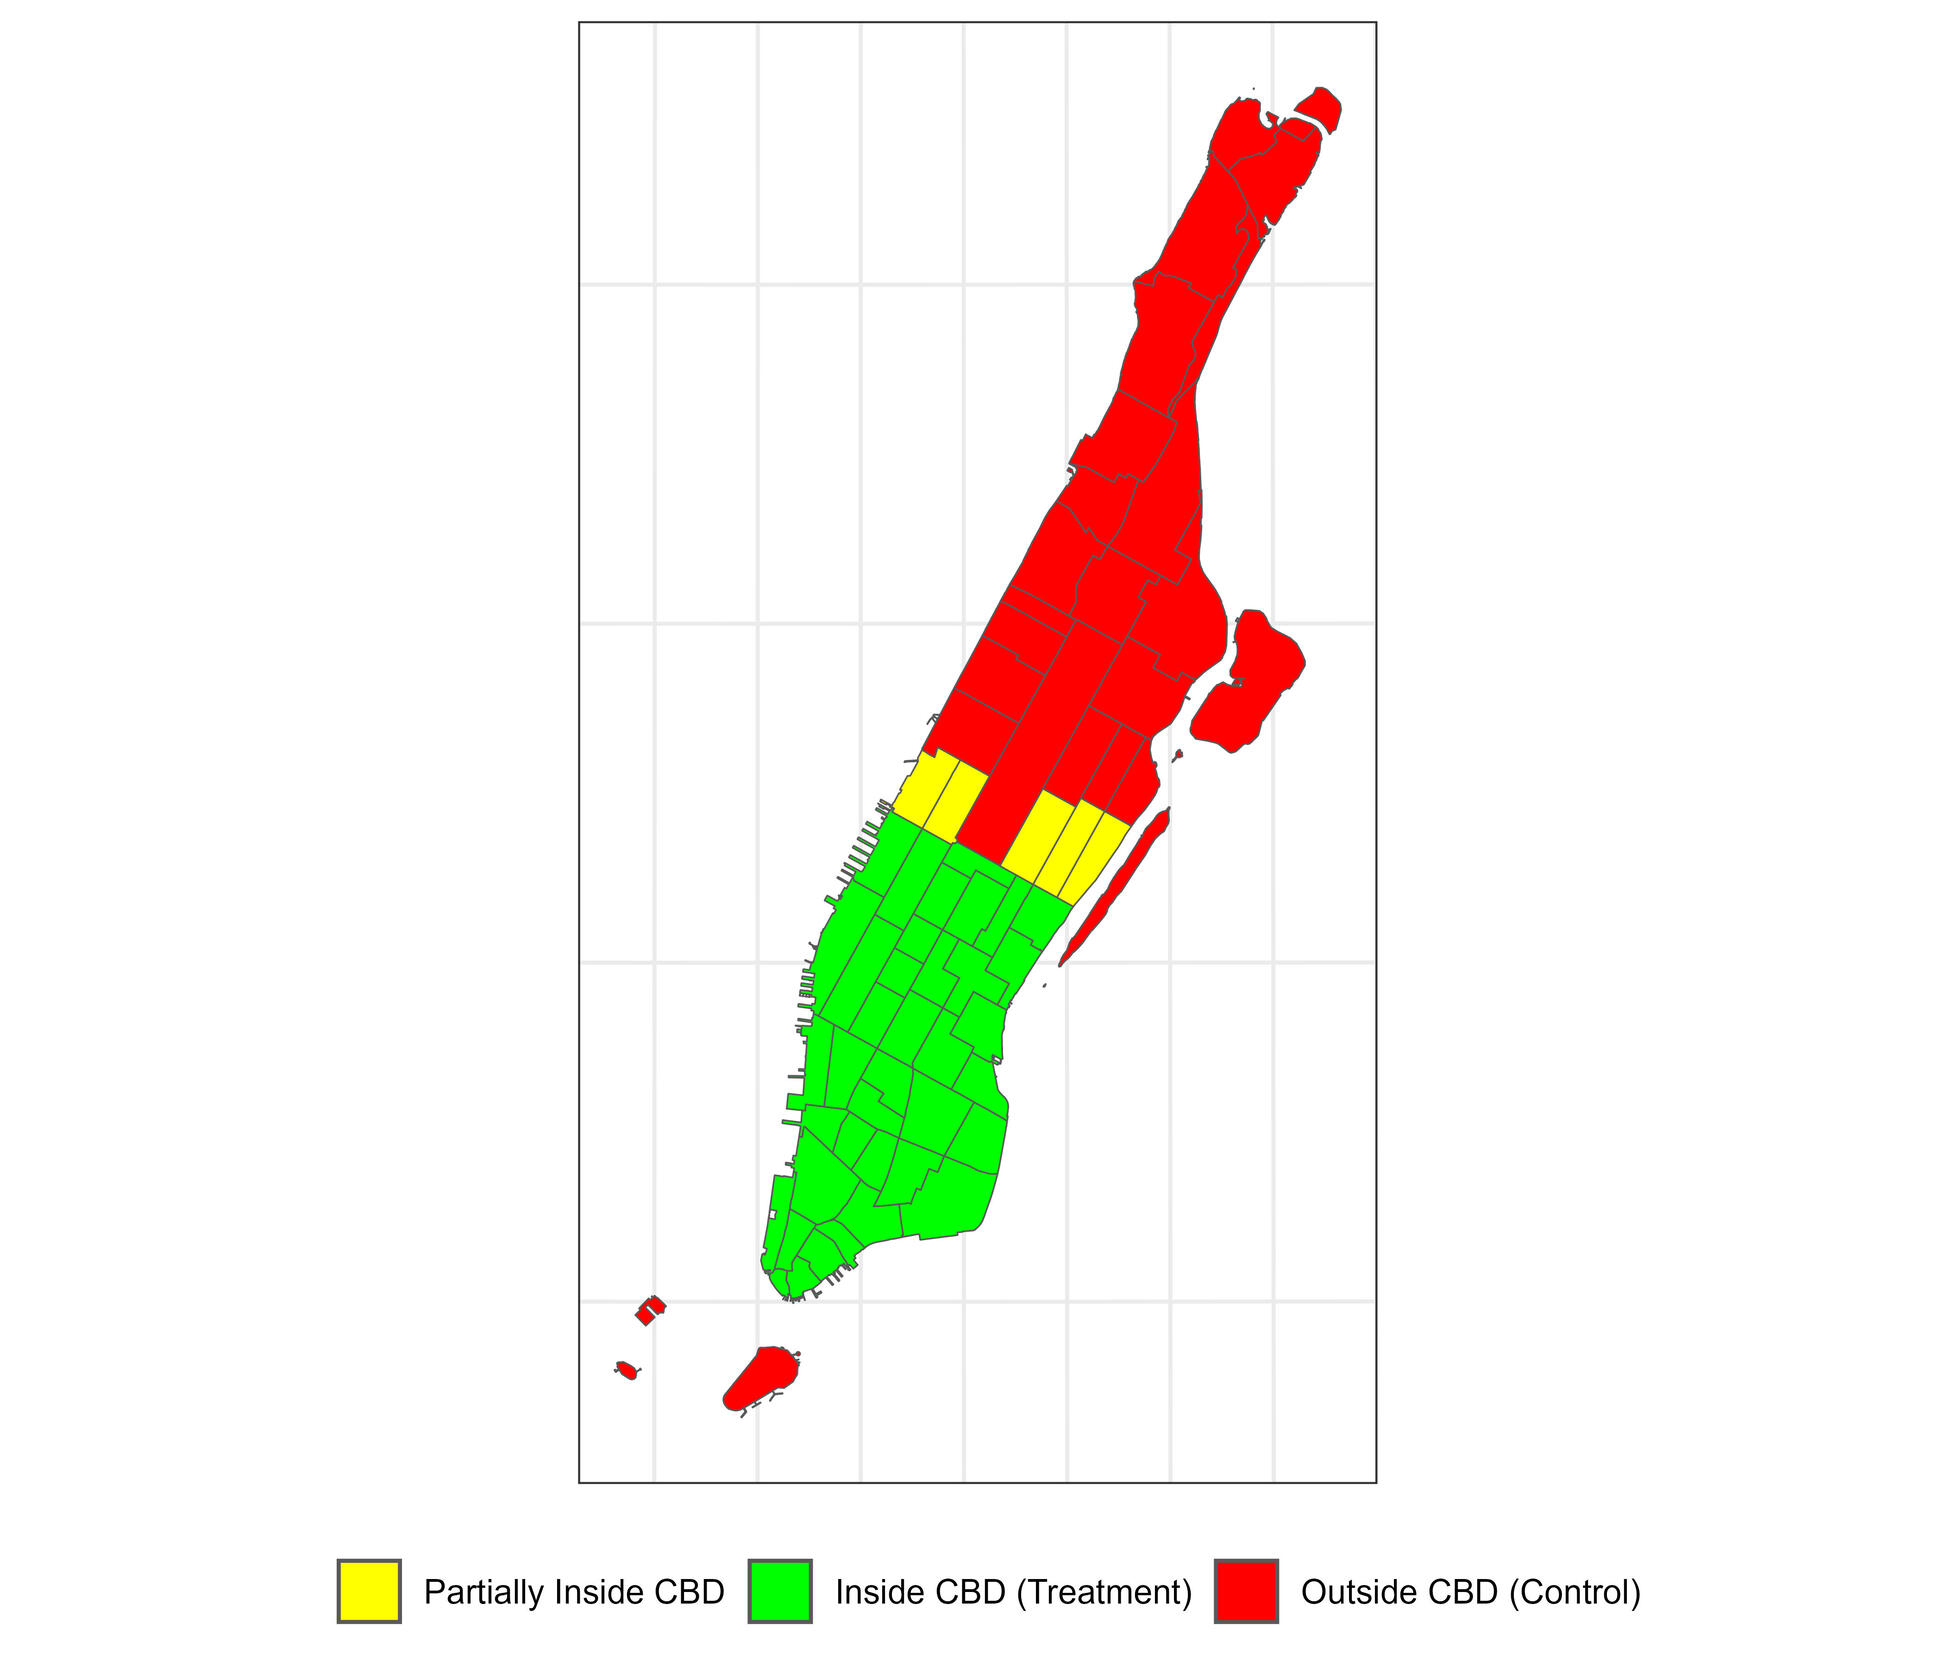
The New York City (NYC) congestion relief zone toll (CRZT) went into effect on the morning of January 5, 2025. This toll aims to reduce congestion by charging vehicles entering the central business district (CBD, south of 60th street) of Manhattan. Private passenger vehicles are charged a flat rate of $9 during peak-hours and $2.25 in off-peak-hours (MTA NYC, n.d.). High-volume for-hire vehicles (HVFHVs) ran by Transportation Network Companies (TNCs, such as Uber and Lyft) are charged a $1.50 per trip throughout the day for any trip that starts, ends or passes through the CBD (MTA NYC, n.d.).[1] There are no discounts for ride-sharing trips (such as UberX Share) in the CRZT. Other for-hire vehicles, such as taxis, green cabs, and black cars, are charged $0.75 per trip. Figure 1 shows a map of Taxi Zones in Manhattan and indicates which zones are located within the CBD.

In this study we estimate the effect of CRZT on the number of trips served by TNCs. The overall effect of this toll is not obvious. The toll makes each TNC trip more expensive, which might discourage some existing passengers from using TNCs and instead switch to other modes. However, the toll on TNC trips is (much) smaller than the toll on private cars ($1.5 per trip vs. $9 per day) which might encourage some passengers to switch to TNCs instead of driving. While it is not possible to separate the two effects, we can asses the total effect of the toll on TNC trips. We look at the effect of the CRZT on (i) total trips, (ii) shared trips requested, and (iii) shared trips successfully matched. Unlike some congestion surcharges aimed at TNCs[2], including the NYC congestion surcharge that went in effect in 2019 (New York City Taxi and Limousine Commission, n.d.-a), there are no discounts in the CRZT for shared trips. Hence, even if a passenger were matched with another passenger, both of them will have to pay a $1.5 toll. This makes ride-sharing less attractive and we expect to see a decrease in the number of shared trips being requested. Previous studies (Fielbaum et al. 2023; Pandey et al. 2025; Liu et al. 2023; Lehe, Gayah, et al. 2021) indicate that shared systems benefit from economies of scale; therefore, we anticipate a larger reduction in the number of matched trips relative to the total shared trip requests.
2. Methods
We use trip-level data published by the NYC’s Taxi and Limousine Commission (TLC) (New York City Taxi and Limousine Commission, n.d.-b). The data contains the records of (almost) all TNC trips in NYC and includes:
-
trip fare,
-
trip distance,
-
trip duration,
-
origin and destination taxi zones for the trip,
-
whether the trip was authorized to be shared,
-
whether the trip was actually matched with another trip, and
-
the TNC that the trip was requested on.
We aggregate weekday data for each taxi zone and each week. The aggregated data contains the number of total trips requested, the number of shared trips requested, and the number of shared trips matched in each zone each week.
We use difference-in-differences (DiD) to estimate the effect of the CRZT. We estimate the following regression:
ln(1+Yi,t)=β0+βTrTREATi+βPoPOSTt+βDiDPOSTt×TREATi+ϵi,t,
where is the number of (total, shared, or matched) trips picked by TNCs for zone during week [3] is a dummy variable that is 1 if zone is in the treatment group and 0 otherwise. is a dummy variable that is 1 if week is after the treatment (after 00:00:00 of January 5, 2025) and 0 otherwise. captures the systematic difference between control and treatment zones. captures the systematic difference throughout Manhattan between 2024 and 2025. is the coefficient of interest; it captures the effect of CRZT on the number of trips while controlling for any systematic differences between the treatment and control zones, and between 2024 and 2025.
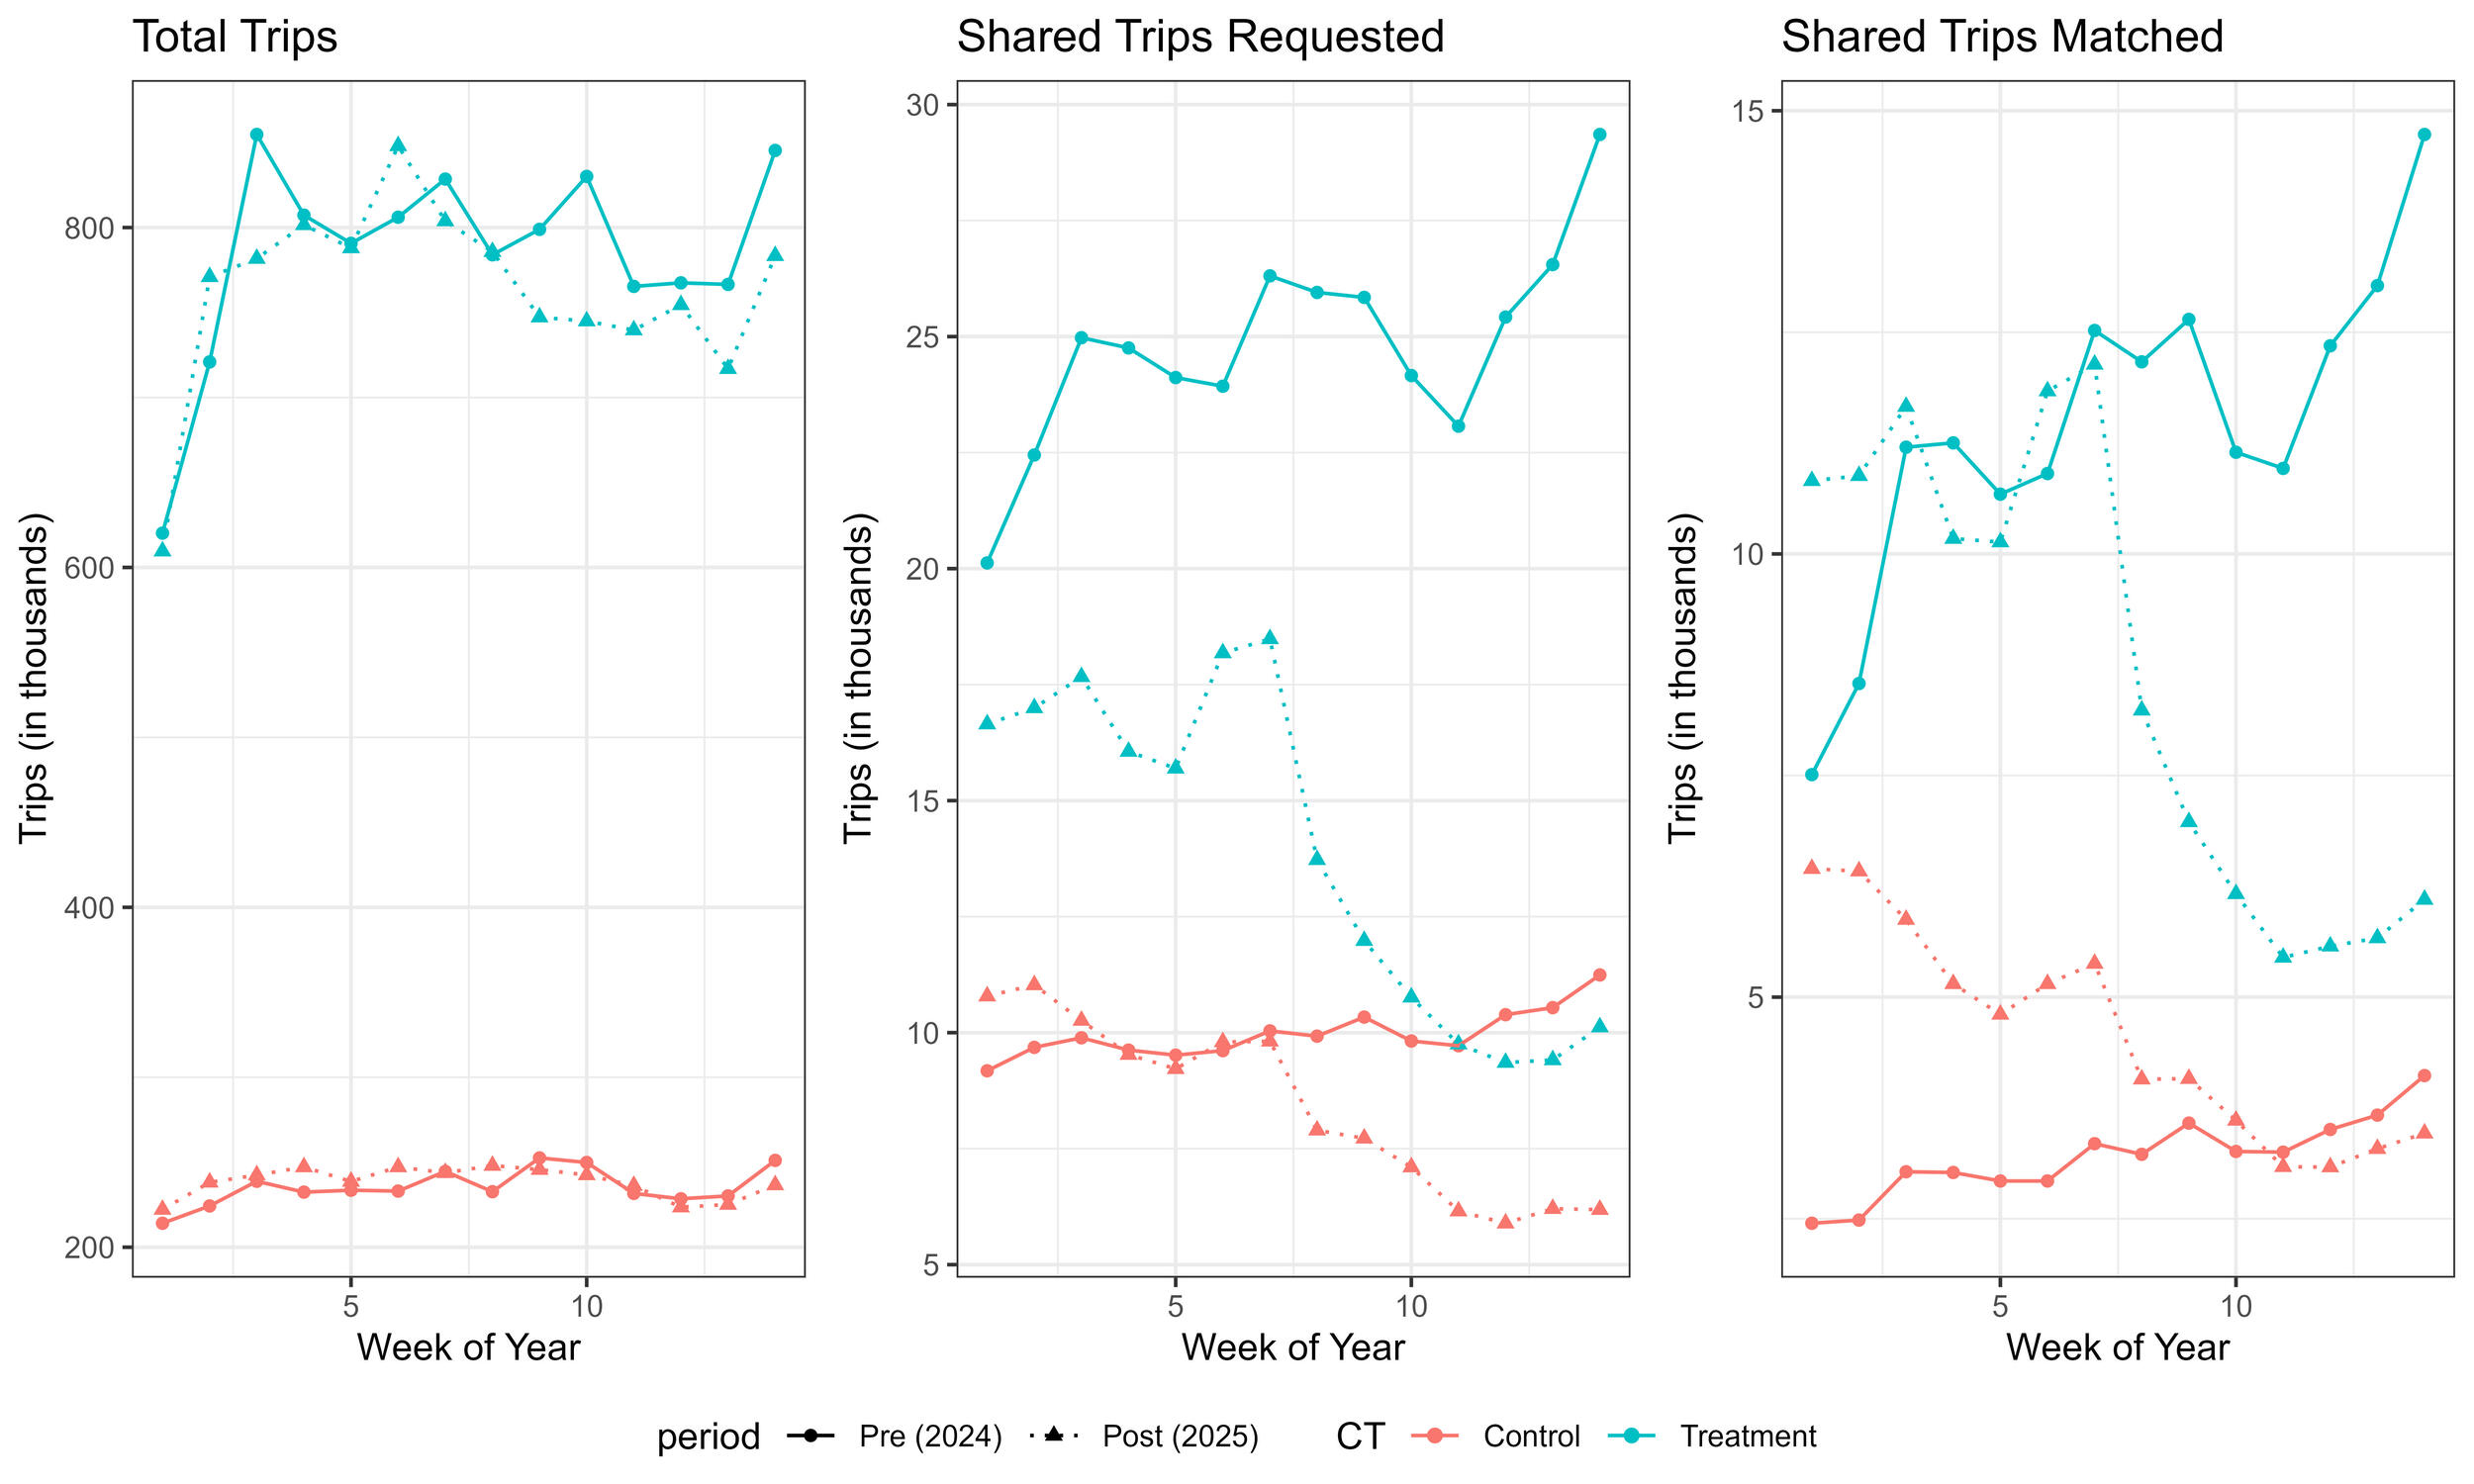
The treatment group is made of all the taxi zones inside the CBD and the control group comprises of taxi zones in Manhattan that are completely outside of the CBD (Fig. 1). We count the number of trips starting in each zone; only trips not going into the CBD are counted for zones in the control group. The post-treatment period goes from the first week of January 2025 to 14th week of the year. Unlike Li and Vignon (2024) and Liang et al. (2023), which used the weeks immediately before the treatment started as the pre-treatment period, we used the first week of January 2024 to the 14th week of 2024 as the pre-treatment period to remove additional seasonal patterns due to winter holidays. Figure 2 shows the number of trips served by TNCS for treatment and control groups before and after the treatment. In the control group, total trips follow the same trend before and after the treatment, shared trips (requested and matched) were increasing in 2024 but decrease in 2025. In the treatment group, total trips are a little lower in 2025 compared to 2024 and shared trips (requested and matched) rise (in 2024) and fall (in 2025) much quicker than in the control group.

The difference-in-differences analysis requires that the control group and the treatment group have similar trends before the treatment, i.e., the difference between the two groups is constant in the pre-period. We can use an event study to confirm this. The regression estimated for the event study is as follows:
ln(1+Yi,t)= β0+{∑kβkwI(t=k)+∑kβkTrTREATiI(t=k)}+POSTt{∑kβkPoI(t=k)+∑kβkTrPoTREATiI(t=k)}+ϵi,t
where is a dummy variable that is 1 if week is equal to and 0 otherwise. captures the trend for the control group before the treatment (in 2024). captures the difference between control and treatment in 2024; this should be zero for the pre-treatment period. Figure 3 plots for weeks 1 (wk 1) to 14 (wk 14) in 2024. These coefficients are zero for the pre-treatment period which indicates that the difference between control and treatment zones is not changing over time and the DiD assumption is satisfied.
We can also use the event study to see how the effect of the policy changes over time. captures the difference in trend between 2024 and 2025 for the control group. is analogous to and captures the effect of the policy over different weeks in 2025. Figure 3 plots for weeks 1 (wk 1) to 14 (wk 14) in 2025 and shows that the fall in demand due to CRZT is constant over time.
3. Findings
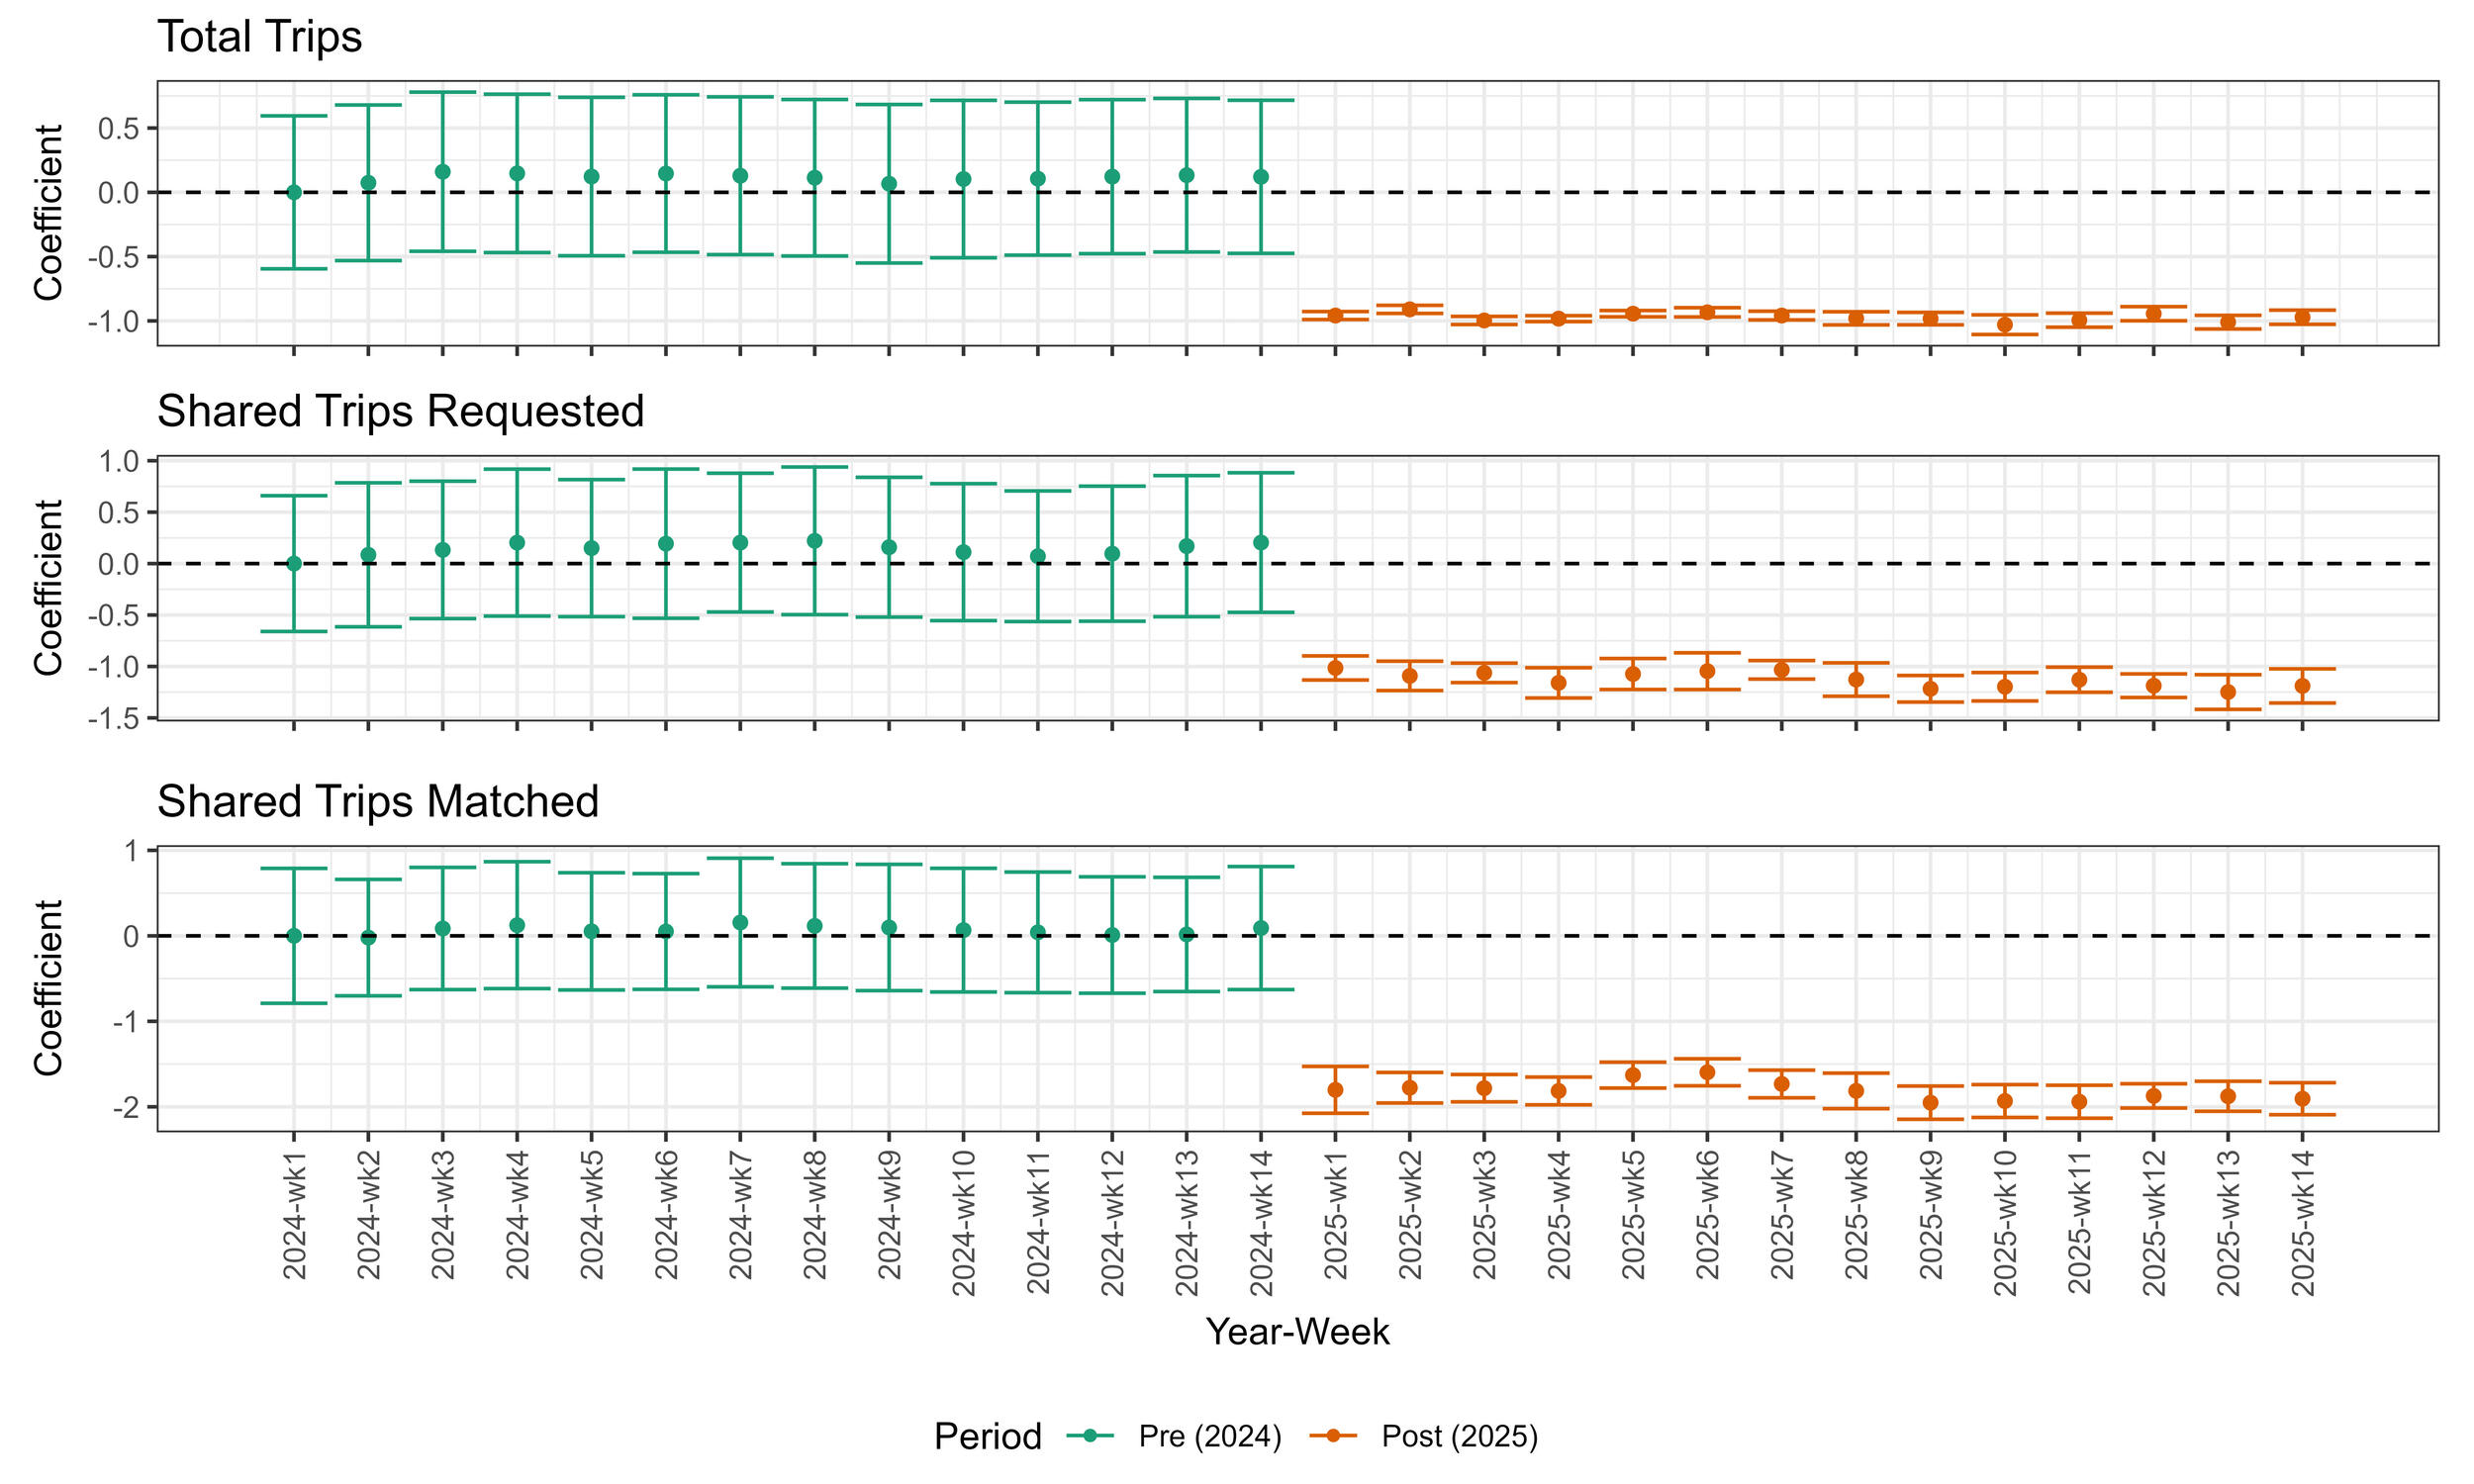
Table 1 shows the results from the difference-in-differences analysis for total, shared requested, and shared matched trips. The coefficients are significant and negative for all three types of trips. The relative change in the number of trips is given by total trips went down by 5.95%, shared trips went down by 38.08% and matched trips went down by 50.87%. We ran the analysis using Brooklyn and Queens as the control groups as well and the results are similar to the ones presented in the paper; Tables 2 and 3 in the Appendix show these results.
The results indicate that the CRZT has a significant and negative effect on the number of trips served by TNCs. If there was any demand shift from private cars to TNCs, it was not large enough to offset the 1.5$ per trip toll. The shared trips were affected more significantly, indicating that the absence of discounts for shared trips may have amplified the toll’s impact on shared trips.
A key limitation of this methodology is that the estimates include the effect of other changes between 2024 and 2025 that could have resulted in a dissimilar change between treatment and control groups. For example, Figure 2 shows that shared trips were increasing slightly faster in the treatment zones compared to the control zones in 2024, but the fall in shared trips requested in 2025 seems to be similar for both treatment and control zones. This may help put into context the significant decrease in shared trips due to the CRZT. Nevertheless, the introduction of the CRZT was associated with significant reduction in TNC activity. Future studies should confirm if this trend occurs in other cities when a congestion tax is added.