


1. Questions
Demand-responsive transport (DRT) systems face a core dilemma: accepting all trip requests to support inclusivity and accessibility, or selectively accepting requests to preserve efficiency and service quality (Schasché, Sposato, and Hampl 2022). Most DRT services adopt selective acceptance strategies to maintain service quality and control operating costs (Ho et al. 2018). But, DRT systems with serve-all policies maximise coverage, often compromising reliability and user satisfaction when demand exceeds capacity (Baier, Sörensen, and Schlüter 2024). This trade-off represents a broader Triple Bottom Line (3BL) challenge for sustainable DRT operations (Tiwari, Nassir, and Lavieri 2024b). While prior work has primarily optimised DRT from operational and cost–service perspectives (Narayanan, Chaniotakis, and Antoniou 2020), limited attention has been given to how request-acceptance policies shape system-wide performance at the metropolitan scale. Understanding this trade-off is crucial for a balance between social objectives, economic viability, and environmental efficiency. Therefore, the study addresses the following questions:
-
How does serving all requests versus selective acceptance affect fleet productivity and system efficiency?
-
What trade-offs emerge between accessibility, waiting times, and vehicle utilisation under each policy?
2. Methods
2.1. Simulation Framework and Study Setup
We employed MATSim, an open-source, agent-based transport simulation platform for large-scale transport modelling (Horni, Nagel, and Axhausen 2016), with dedicated modules for DRT operations in this study (J. Bischoff and Maciejewski 2016; Maciejewski and Nagel 2012).
We used the Greater Melbourne MATSim model (AToM) (Jafari et al. 2025), which has been used in earlier DRT studies (Tiwari, Nassir, and Lavieri 2025, 2024a, 2023b). A 10% synthetic population was used to maintain realistic travel patterns while ensuring computational efficiency, similar to earlier studies (Tiwari, Nassir, and Lavieri 2023a). Respective parameters were downscaled to maintain consistent congestion levels (Ben-Dor, Ben-Elia, and Benenson 2021). All private-car trips are converted into DRT requests to represent a future scenario of widespread on-demand mobility, resulting in 829,476 daily requests. This full car-to-DRT substitution serves as a stress-test to reveal policy trade-offs, although real-world adoption would be lower and relative differences between the policies should remain similar. Figure 1 shows the temporal and spatial distribution of demand, with two distinct peaks and high request density in the Melbourne CBD. Fleet sizes ranging from 2,500 to 25,000 vehicles, each with a capacity of four passengers, were tested.
_hourly_drt_demand_distribution._(b)_spatial_distribution_of_drt_demand_in_greater_melbou.png)
2.2. Policy Scenarios
-
Serve-all policy: All requests are accepted, representing universal service access.
-
Selective acceptance policy: Requests are only served if they satisfy predefined service quality constraints: a maximum waiting time of 10 minutes and a maximum total travel time: tmax where is the direct car travel time, is the detour factor, and s (Lu et al. 2024).
In both policies, requests are assigned in real time, and vehicle routes are dynamically updated through MATSim’s ride-matching strategy (Joschka Bischoff, Maciejewski, and Nagel 2017).
2.3. Equity Assessment
Service equity is evaluated using the Gini index (Dorfman 1979), with the Lorenz curve (Lorenz 1905) used to represent inequality graphically. For a sample of observations it is computed as
G = \frac{1}{2n^2\mu} \sum_{i=1}^{n} \sum_{j=1}^{n} |x_i - x_j|, \tag{2}
where denotes the sample mean. We calculated the Gini index for both individual trip waiting times and zonal average waiting times.
2.4. Performance Comparison and 3BL Aggregation
To quantify policy trade-offs, we computed the percentage performance advantage of the Serve-all policy over Selective-accept for each indicator :
\begin{aligned} a_i &= \frac{(2b_i - 1)(S_i - C_i)}{w_i} \times 100,\\ b_i &= \begin{cases} 1, & \text{if higher is better},\\ 0, & \text{if lower is better}, \end{cases}\\ w_i &= \frac{S_i + C_i}{2}, \end{aligned}\tag{3}
Here and denote Serve-all and Selective-accept values, respectively; indicates an advantage for Serve-all, while indicates Selective-accept performs better. The binary term encodes the preferred direction of improvement, and represents the average magnitude of indicator ensuring proportionate contribution. Aggregate trade-offs across each 3BL dimension are then obtained as:
A_d=\frac{\sum_{i \in d} w_i a_i}{\sum_{i \in d} w_i} . \tag{4}
3. Findings
Figure 2(a) shows that Serve-all reduces rejection rates more quickly as fleet size increases, reaching the 5% benchmark at around 12,500 vehicles, whereas Selective-accept requires about 20,000 vehicles. Hence, 20,000-vehicle fleet was adopted as the baseline to ensure comparable service reliability across policies.
_rejection_rate_at_different_fleet_size.png)
Figure 2(b) shows that the Serve-all scenario serves more trips throughout the day, particularly after the morning peak.
Figure 2(c)–(d) shows the zonal-average mean times (representing service quality) in both scenarios, with the Selective-accept scenario having lower wait times throughout the network.
Figure 2(e) shows lower inequality in individual waiting times under the Serve-all scenario, consistent with the lower Gini coefficients in Table 1. This indicates that, despite its operational strain, Serve-all provides a fairer distribution of waiting times compared to the Selective-accept scenario.
Table 1 and Figure 3 highlight trade-offs across the 3BL dimensions. From an economic perspective, Serve-all achieves higher operational productivity by serving more requests and serving more requests per vehicle. These outcomes translate into higher system-level revenue, reflecting a strong emphasis on maximising demand coverage and utilisation. Here, revenue reflects a neutral, comparative fare structure, and the system is not assumed to be either commercial or subsidised.
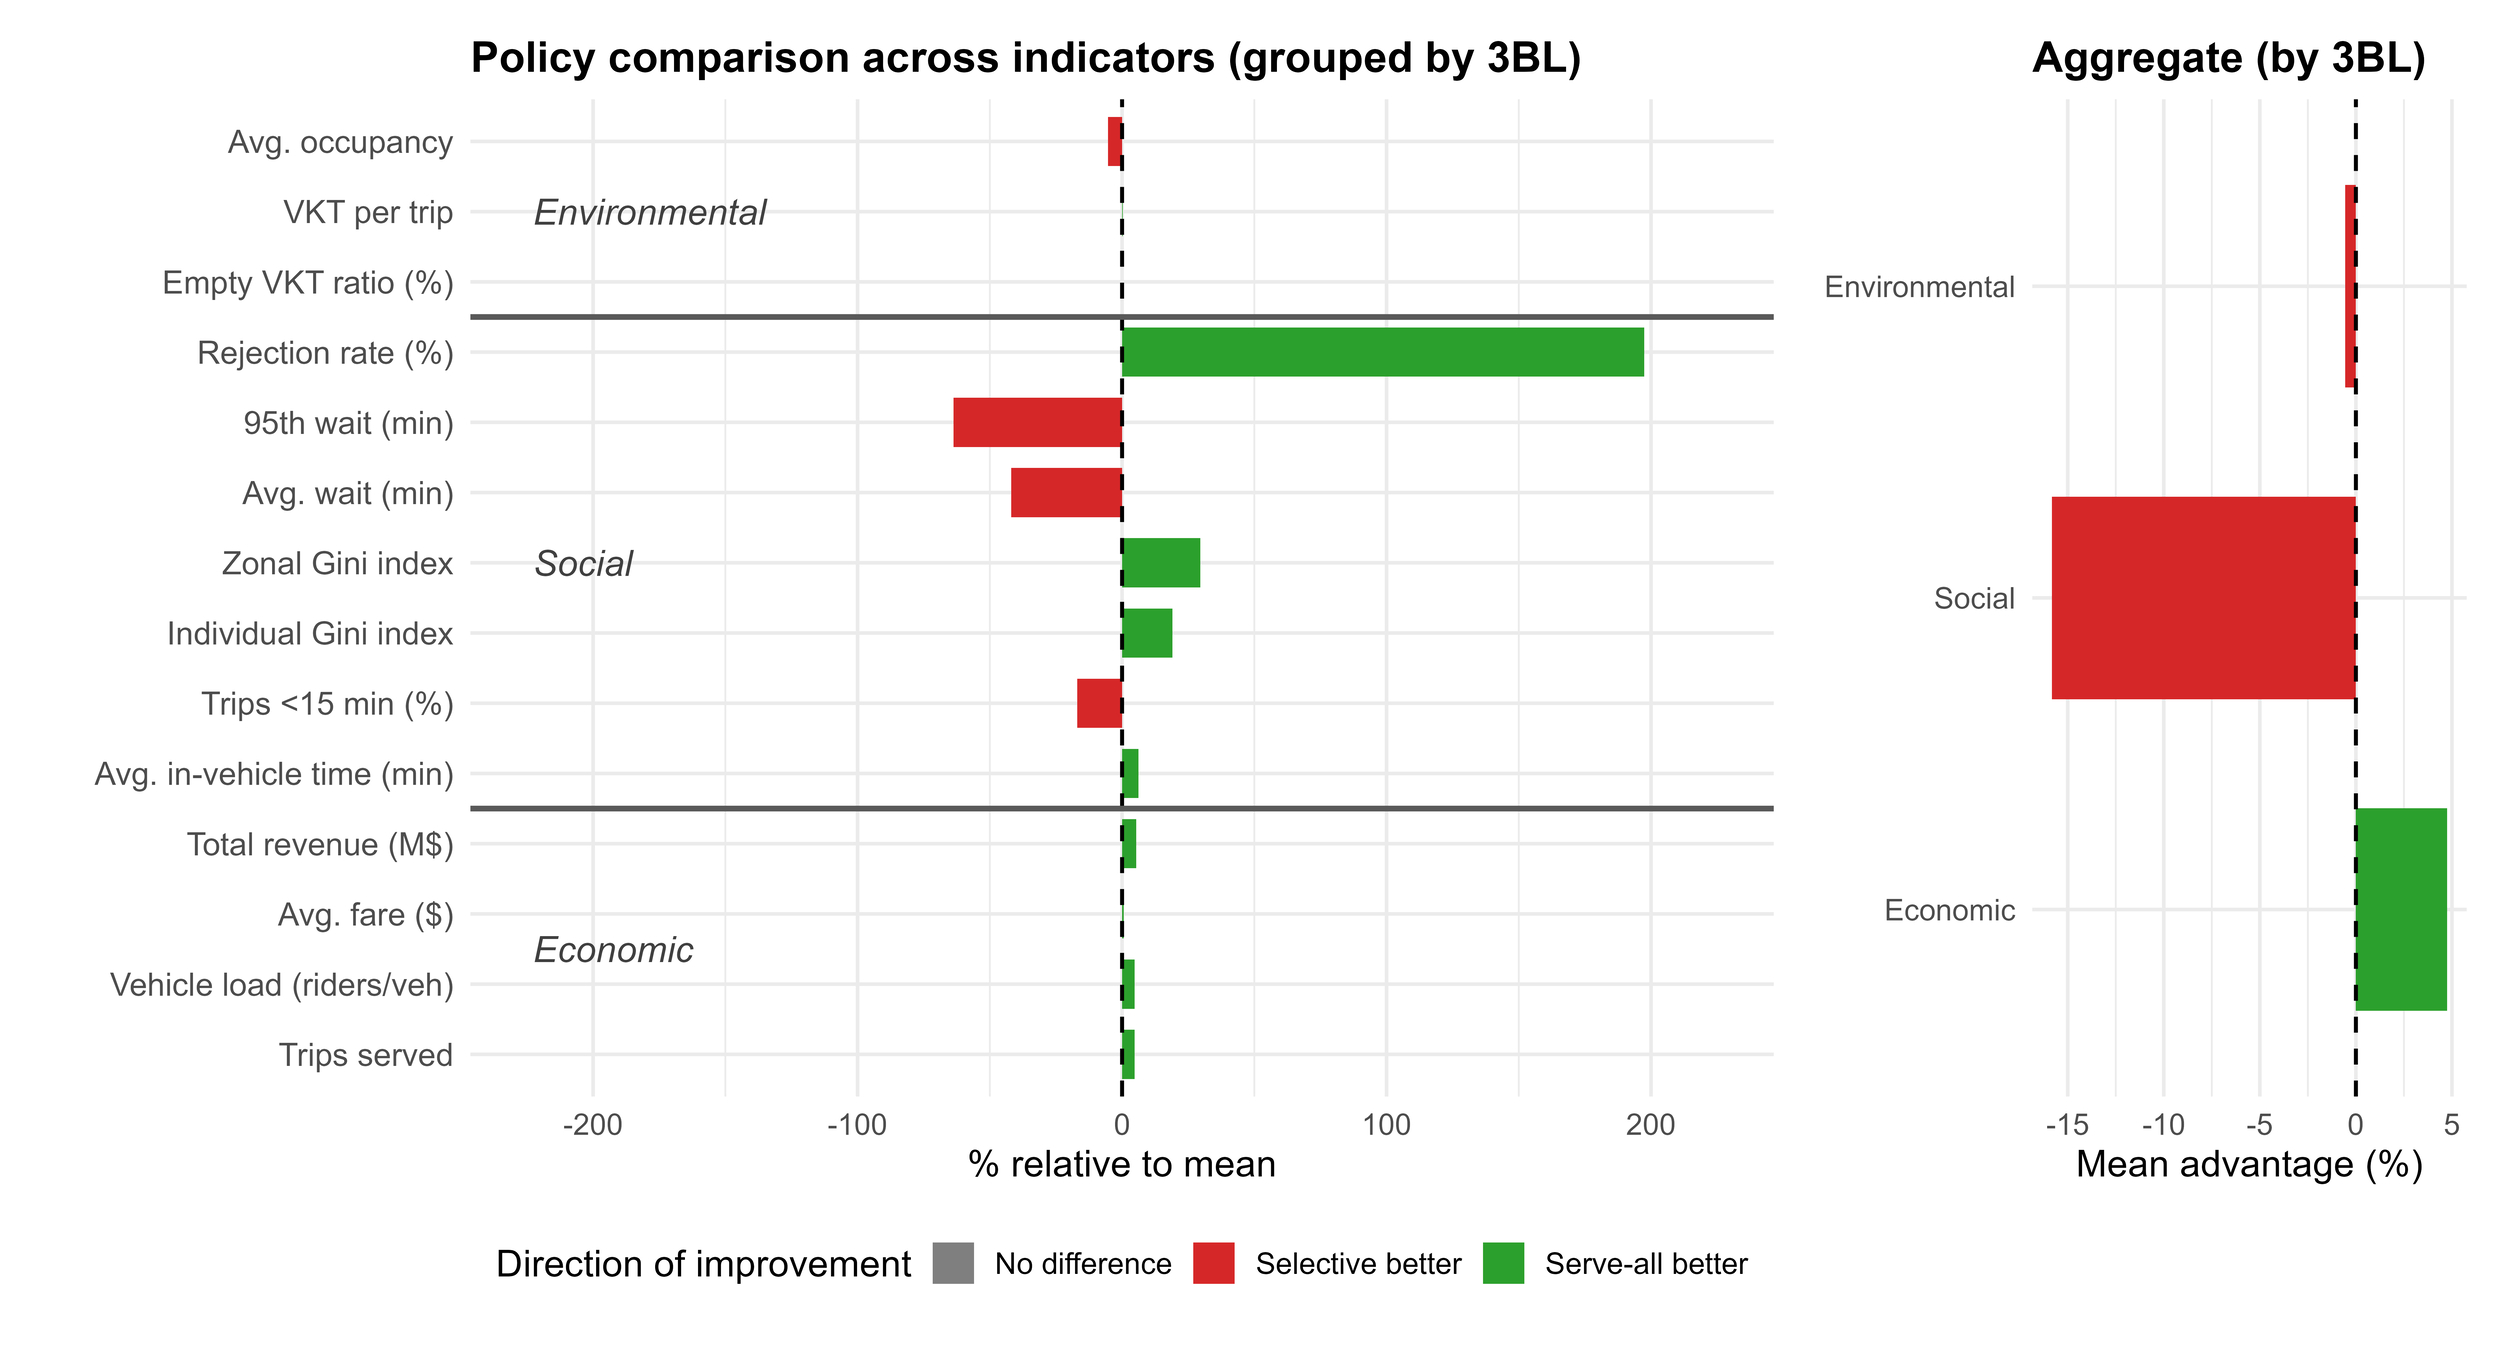
However, this efficiency comes at a social cost, as Serve-all results in significantly longer waiting times, reducing the share of passengers served within 15 minutes from 100% to 84.35%. In contrast, Selective-accept maintains shorter, more predictable waiting times and demonstrates stronger service quality.
Environmental outcomes differ only slightly, with Selective-accept performing marginally better overall. Although both policies show comparable vehicle-kilometre-per-trip and empty-distance shares, Serve-all exhibits lower vehicle occupancy, as it accepts many low-compatibility requests that cannot be efficiently pooled, thereby reducing operational efficiency compared with the Selective-accept scenario.
Aggregated 3BL results in Figure 3 indicate that Serve-all achieves a marginal economic advantage, whereas Selective-accept performs notably better in the social dimension, reflecting reduced inequality and improved reliability. Environmental differences remain minor, with a slight edge for Selective-accept. Overall, the results highlight the inherent trade-off among economic, social and environmental dimensions in DRT operations.