

1. Questions
Activity spaces represent areas within which individuals routinely travel (Cagney et al. 2020). The normative interpretation of variation in activity space areas depends on the narrative used to explain it. In a constraints-based narrative, larger spaces indicate greater opportunities to travel widely. In a freedom-based narrative, smaller spaces reflect less need for extensive travel. We examine the relationship between destination accessibility of individuals’ homes and activity space size. If small activity spaces are associated with lower accessibility or more constrained resources, this supports a constraints-based view. If smaller activity spaces correspond with higher accessibility, this supports a freedom-based view.
2. Methods
This study draws on data collected between May and June 2023 in the city of the Granada, Spain (Duro et al. 2025). The survey employed a multi-stage sampling design structured across three levels: district, census tract, and demographic quotas within each tract. Individuals were approached in public spaces according to predefined gender and age quotas for their census tract. Participants recalled all trips made on the most recent weekday and one day of the most recent weekend, including trip purpose, transport mode, and destination. All reported locations were geolocated. Respondents provided informed consent, in accordance with the University of Granada’s Code of Ethics, permitting the anonymous use of their data.
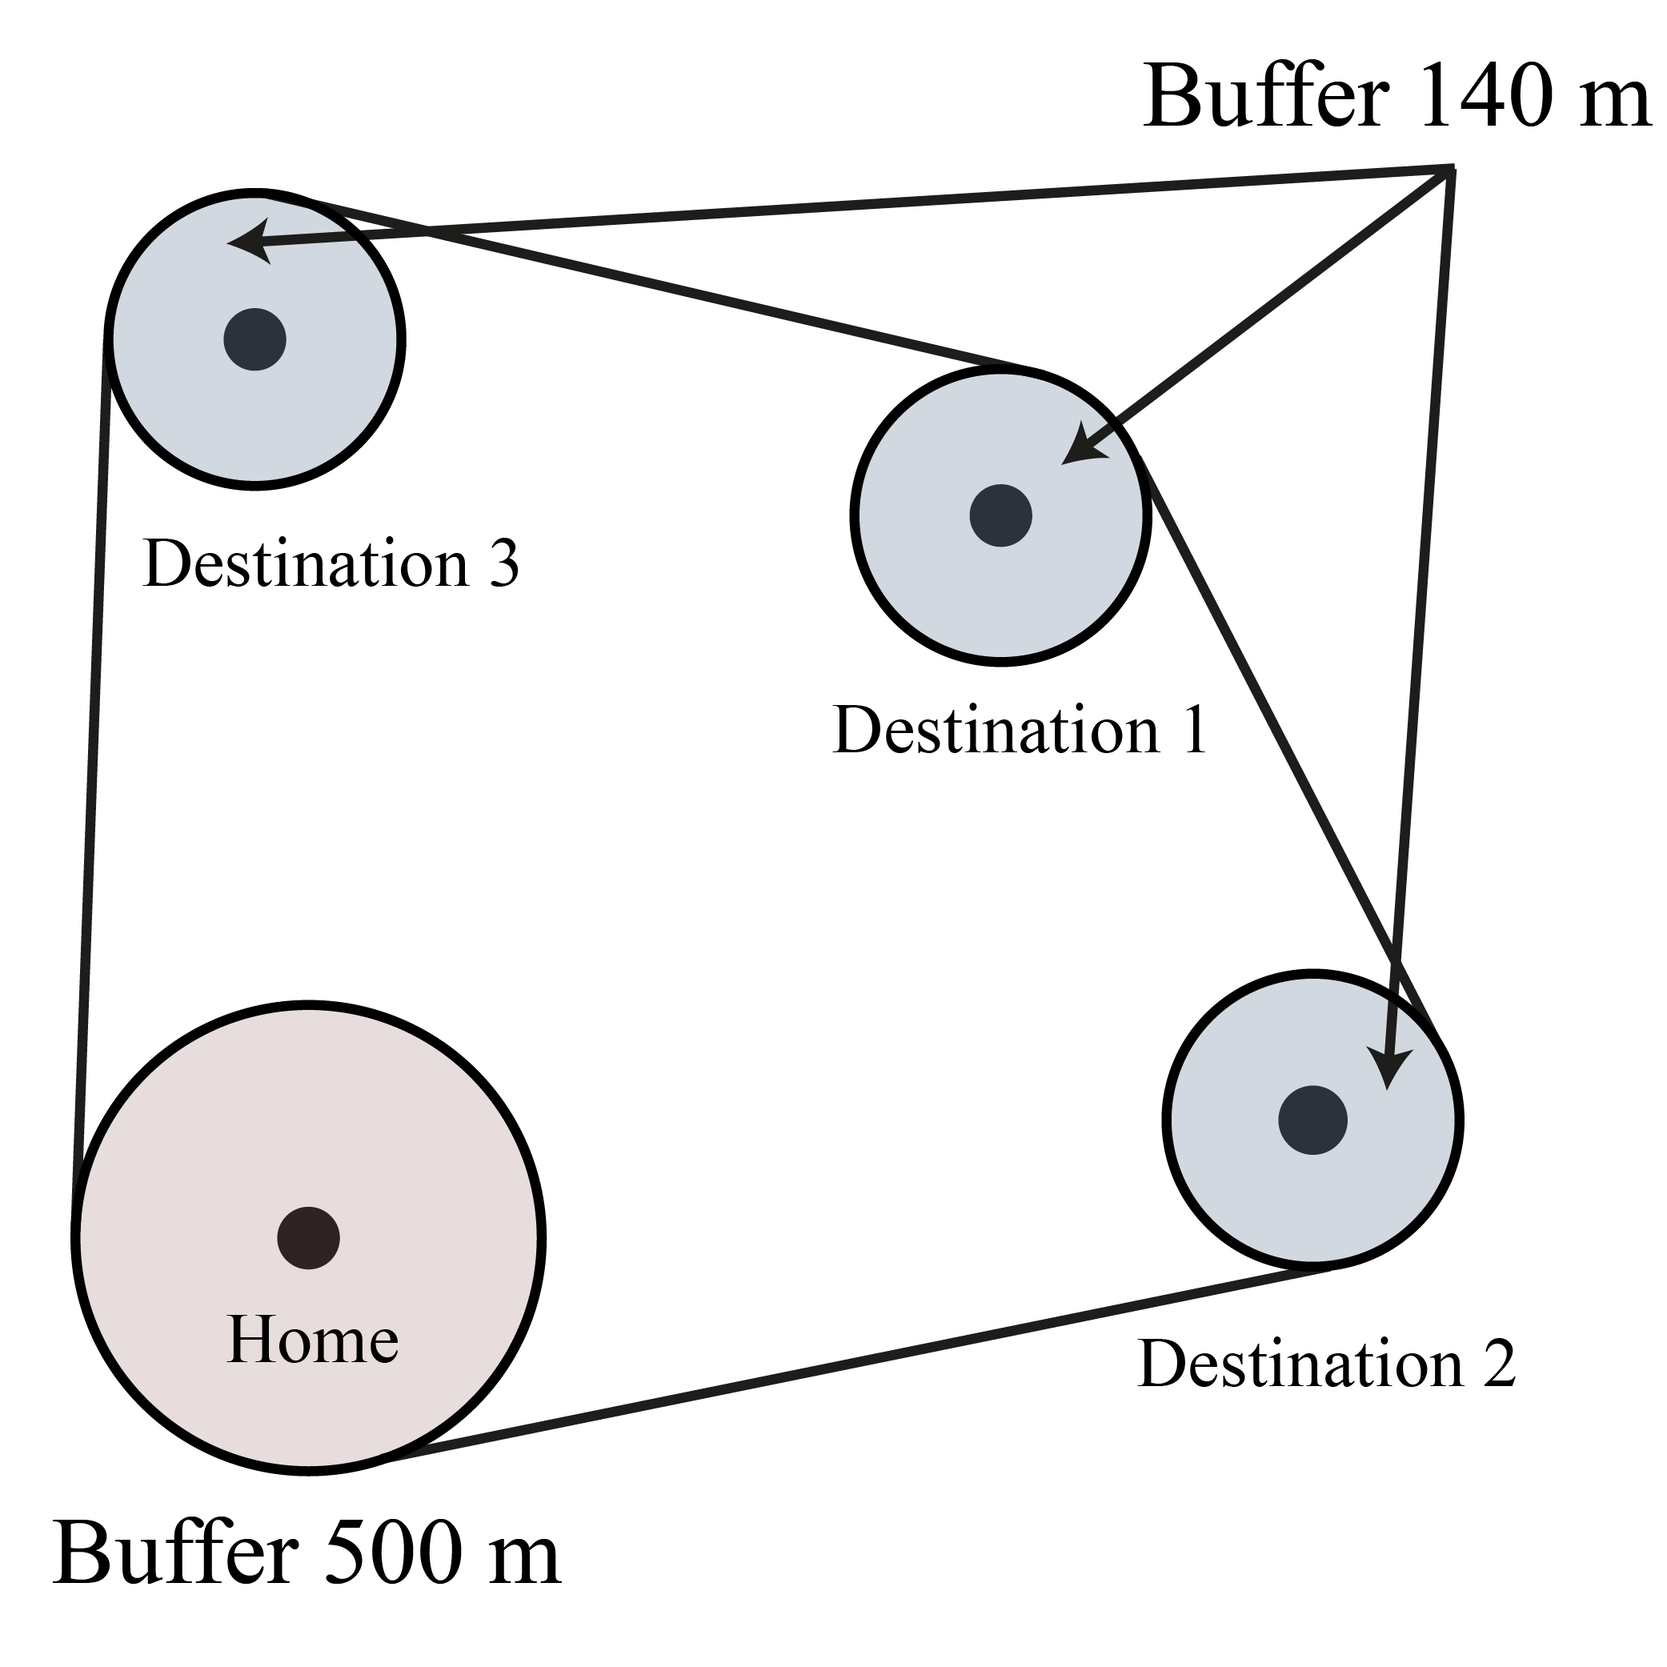
For this study, an individual’s activity space was defined as a minimum convex polygon (MCP) representing the geographic footprint of daily routines. Following Hasanzadeh, Broberg, and Kyttä (2017), home locations were buffered by 500 m to represent the immediate neighborhood environment, a widely used metric in activity-space research (Hasanzadeh, Broberg, and Kyttä 2017; Larsen et al. 2009; Markevych et al. 2016; Wendel-Vos et al. 2004; Wolch et al. 2011). Other stops were buffered by 140 m, an empirically derived threshold averaging kernel density and nearest-neighbor measures between trips (Hasanzadeh, Broberg, and Kyttä 2017) to capture spatial uncertainty. Figure 1 illustrates the steps taken to construct these activity spaces. We excluded one individual’s weekday activity space and three individuals’ weekend spaces that exceeded eight standard deviations above the mean. In the remaining sample, all activity space areas were within four standard deviations of the mean.

We calculated accessibility using parcel-level land-use data for Granada province, from the Spanish Land Use Information System (SIOSE) of the National Geographic Institute (Instituto Geográfico Nacional 2023). Parcel land uses were grouped into four categories:
-
leisure (retail, restaurants, tertiary sector, indoor culture and recreation),
-
other services (financial and public services such as schools and hospitals),
-
outdoor recreation (sports facilities and parks), and
-
residential.
Agricultural and industrial land uses were excluded from the analysis.
Land-use intensity was defined:
-
as total land area for outdoor recreation,
-
as population for residential uses (estimated in Equation 1), and
-
as gross floor area for leisure and other services.
Pparcel=Ptract(GFAparcelGFAtract)
where Pparcel = estimated population of the parcel,
Ptract = population of the census tract, from the Annual Population Census (INE 2023)[1],
GFAparcel = total gross floor area of all residential buildings on the parcel, and
GFAtract = total gross floor area of all residential buildings in the tract.
We used the r5r package (Pereira et al. 2021) to compute eight accessibility metrics for each respondent’s home: accessibility by car and accessibility by a combination of walking and transit for each of four destination types. Gravity-based accessibility was calculated as the sum of parcel sizes in Granada province, weighted by travel time using a logistic decay function Equation 2.
Ad,m=∑pIp1+eπ√3(Tp,m−30)/15
where Ad,m = the accessibility to destination type, d, by mode, m,
Ip = the land use intensity (as defined above for each destination type) of parcel p, and
Tp = the travel time in minutes from the respondent’s home to parcel p by mode, m.
The above decay function produces a median of 30 minutes and a standard deviation of five minutes. The median of 30 minutes approximates a reasonable travel time for routine daily trips, and the standard deviation of five minutes to allow for a less rigid cutoff at 30 minutes than would be achieved through a lower value (which would more closely approximate the step function that characterizes a cumulative-opportunity measure of accessibility). Santana Palacios and El-Geneidy (2022) have found that gravity-based and cumulative-opportunity measures of accessibility tend to be highly correlated and analysis conclusions are unlikely to be sensitive to the choice of decay function. We tested our analysis with alternative decay functions that vary the median value by ±10 and find that the resulting accessibility scores are highly correlated (r ≥ 0.90).
Accessibility scores were standardized (centered and scaled to a mean of zero and a standard deviation of one), as shown in Equation 3.
A′d,m=Ad,m−μAd,mσAd,m
where A’d,m = the standardized accessibility to destination type, t, by mode, m,
= the mean of Ad,m within the sample of study respondents’ residences,
= the standard deviation of Ad,m within the sample of study respondents’ residences.
Correlations among the four standardized car access metrics were greater than 0.94, as were correlations among the four standardized walk/transit access metrics. These highly correlated measures that had been standardized were averaged to form combined indicators of access by car and by walking/transit, as shown in Equation 4.
Am=A′l,m+A′s,m+A′o,m+A′r,m4
where Am = accessibility by mode, m,
A’l,m = standardized accessibility to leisure destinations by mode, m;
A’s,m = standardized accessibility to other serive destinations by mode, m;
A’o,m = standardized accessibility to outdoor recreation destinations by mode, m;
A’r,m = standardized accessibility to residential destinations by mode, m.
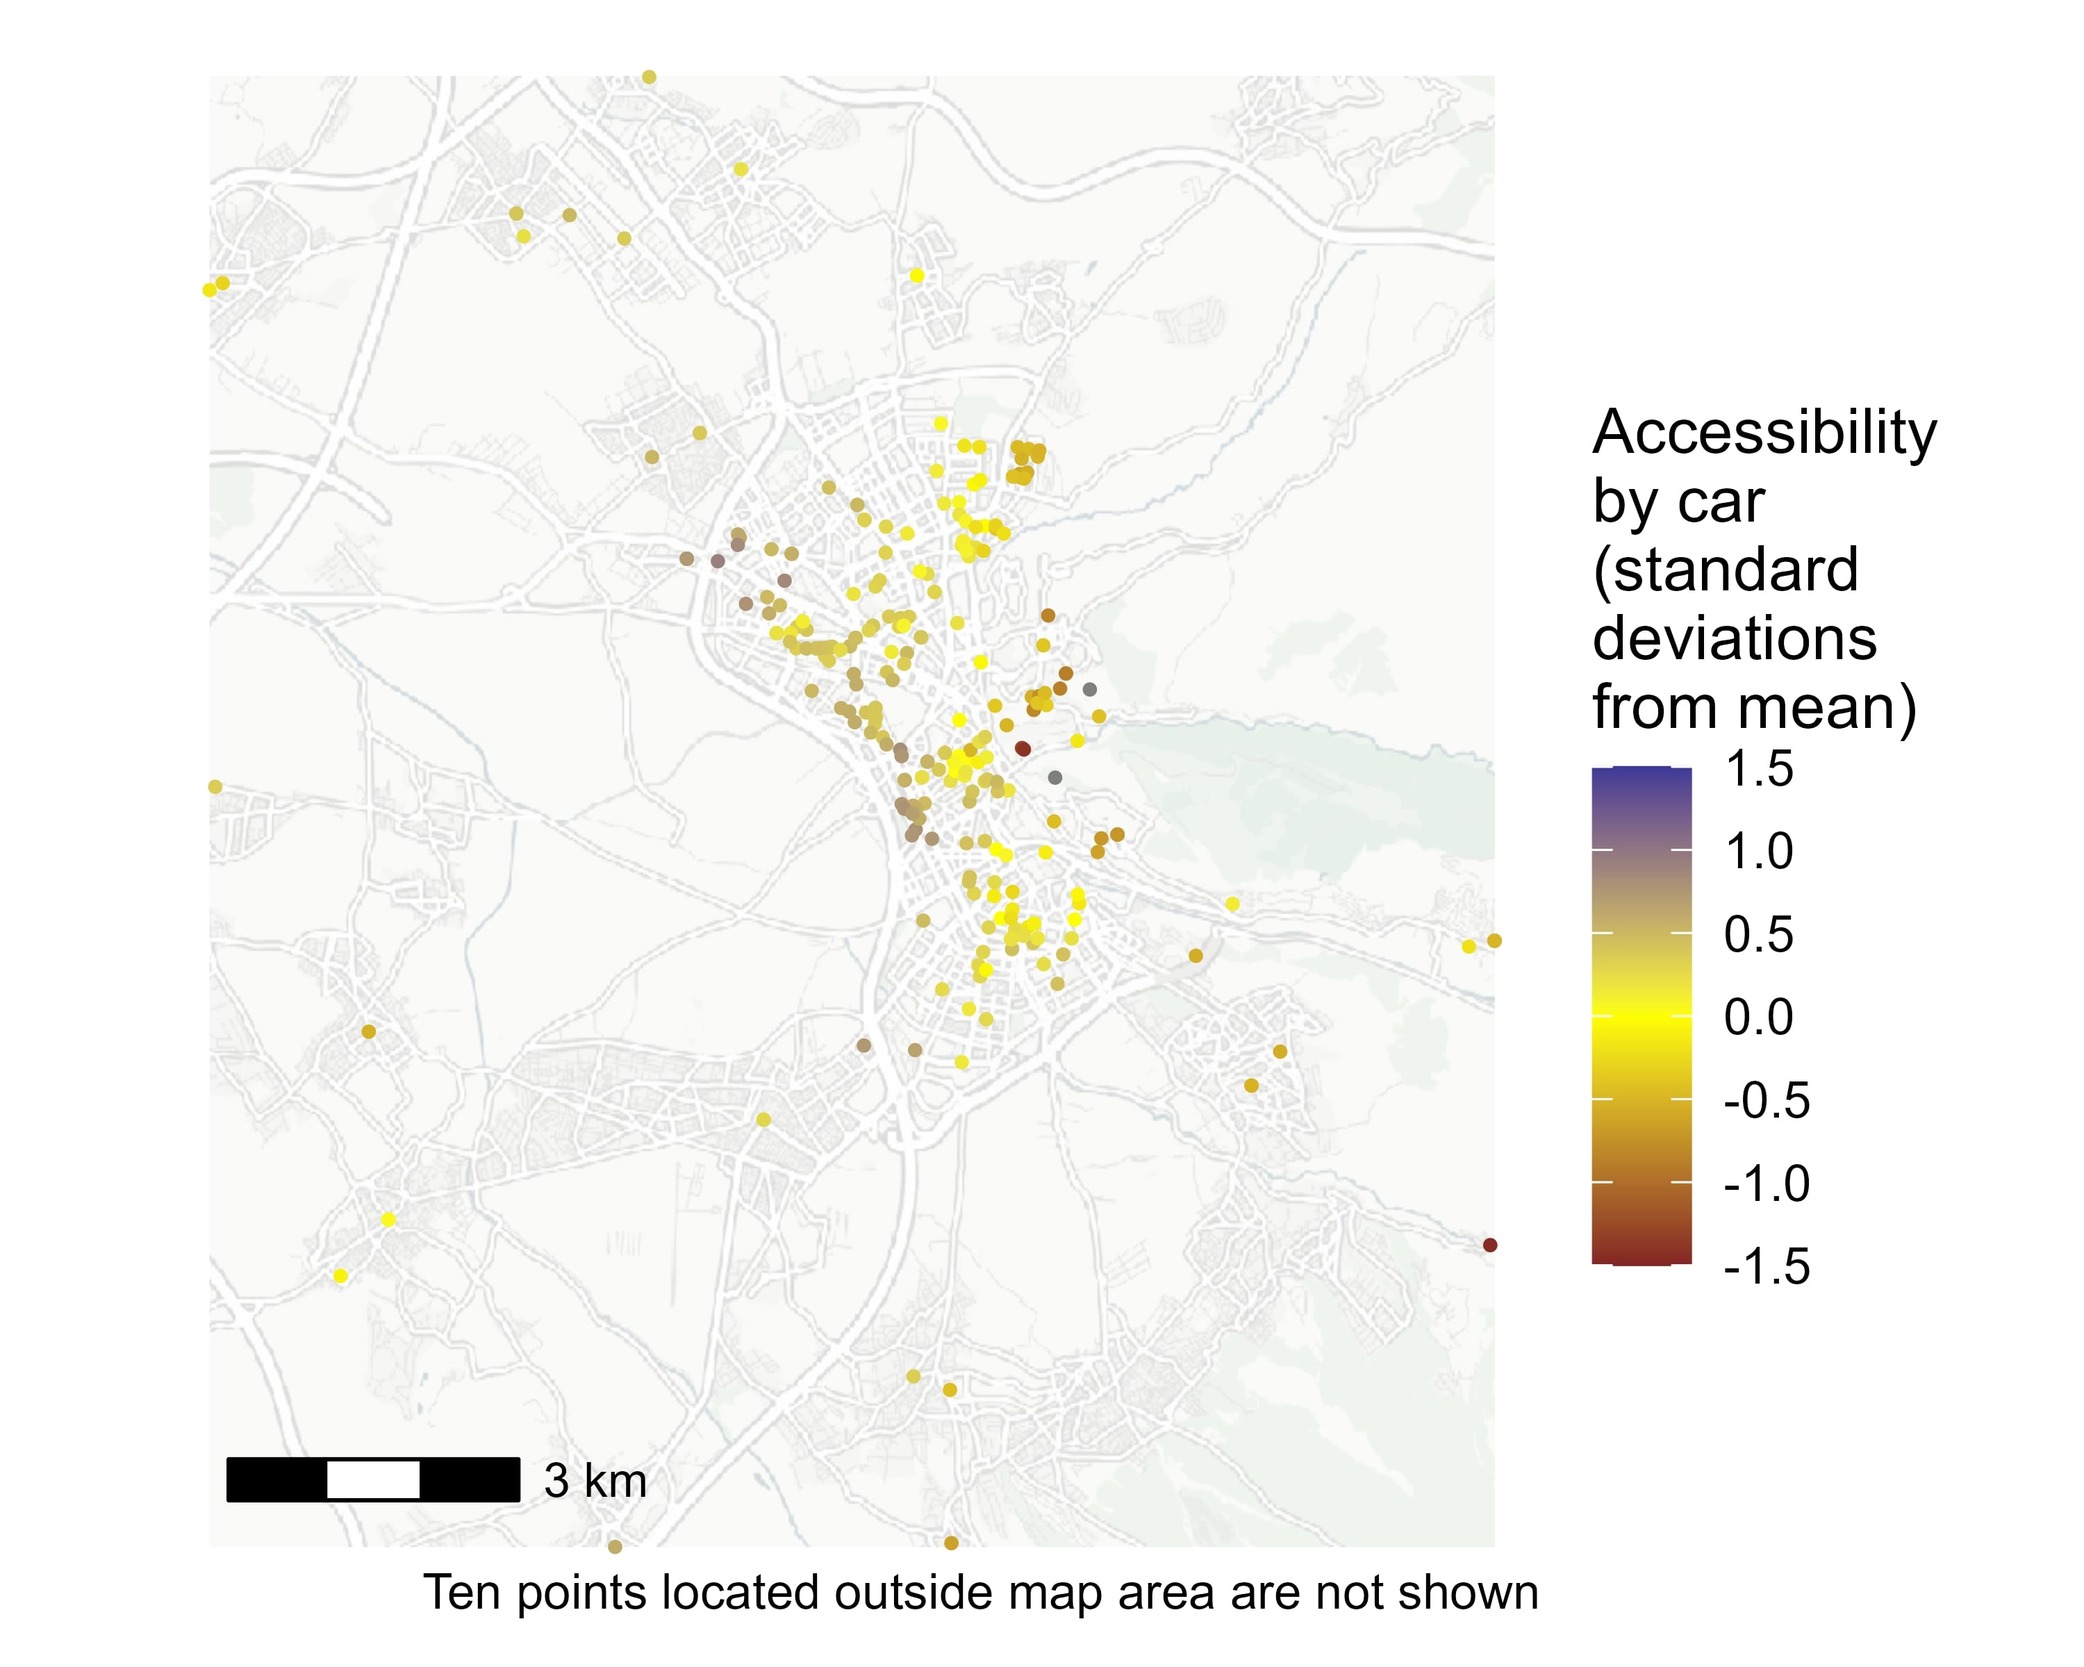
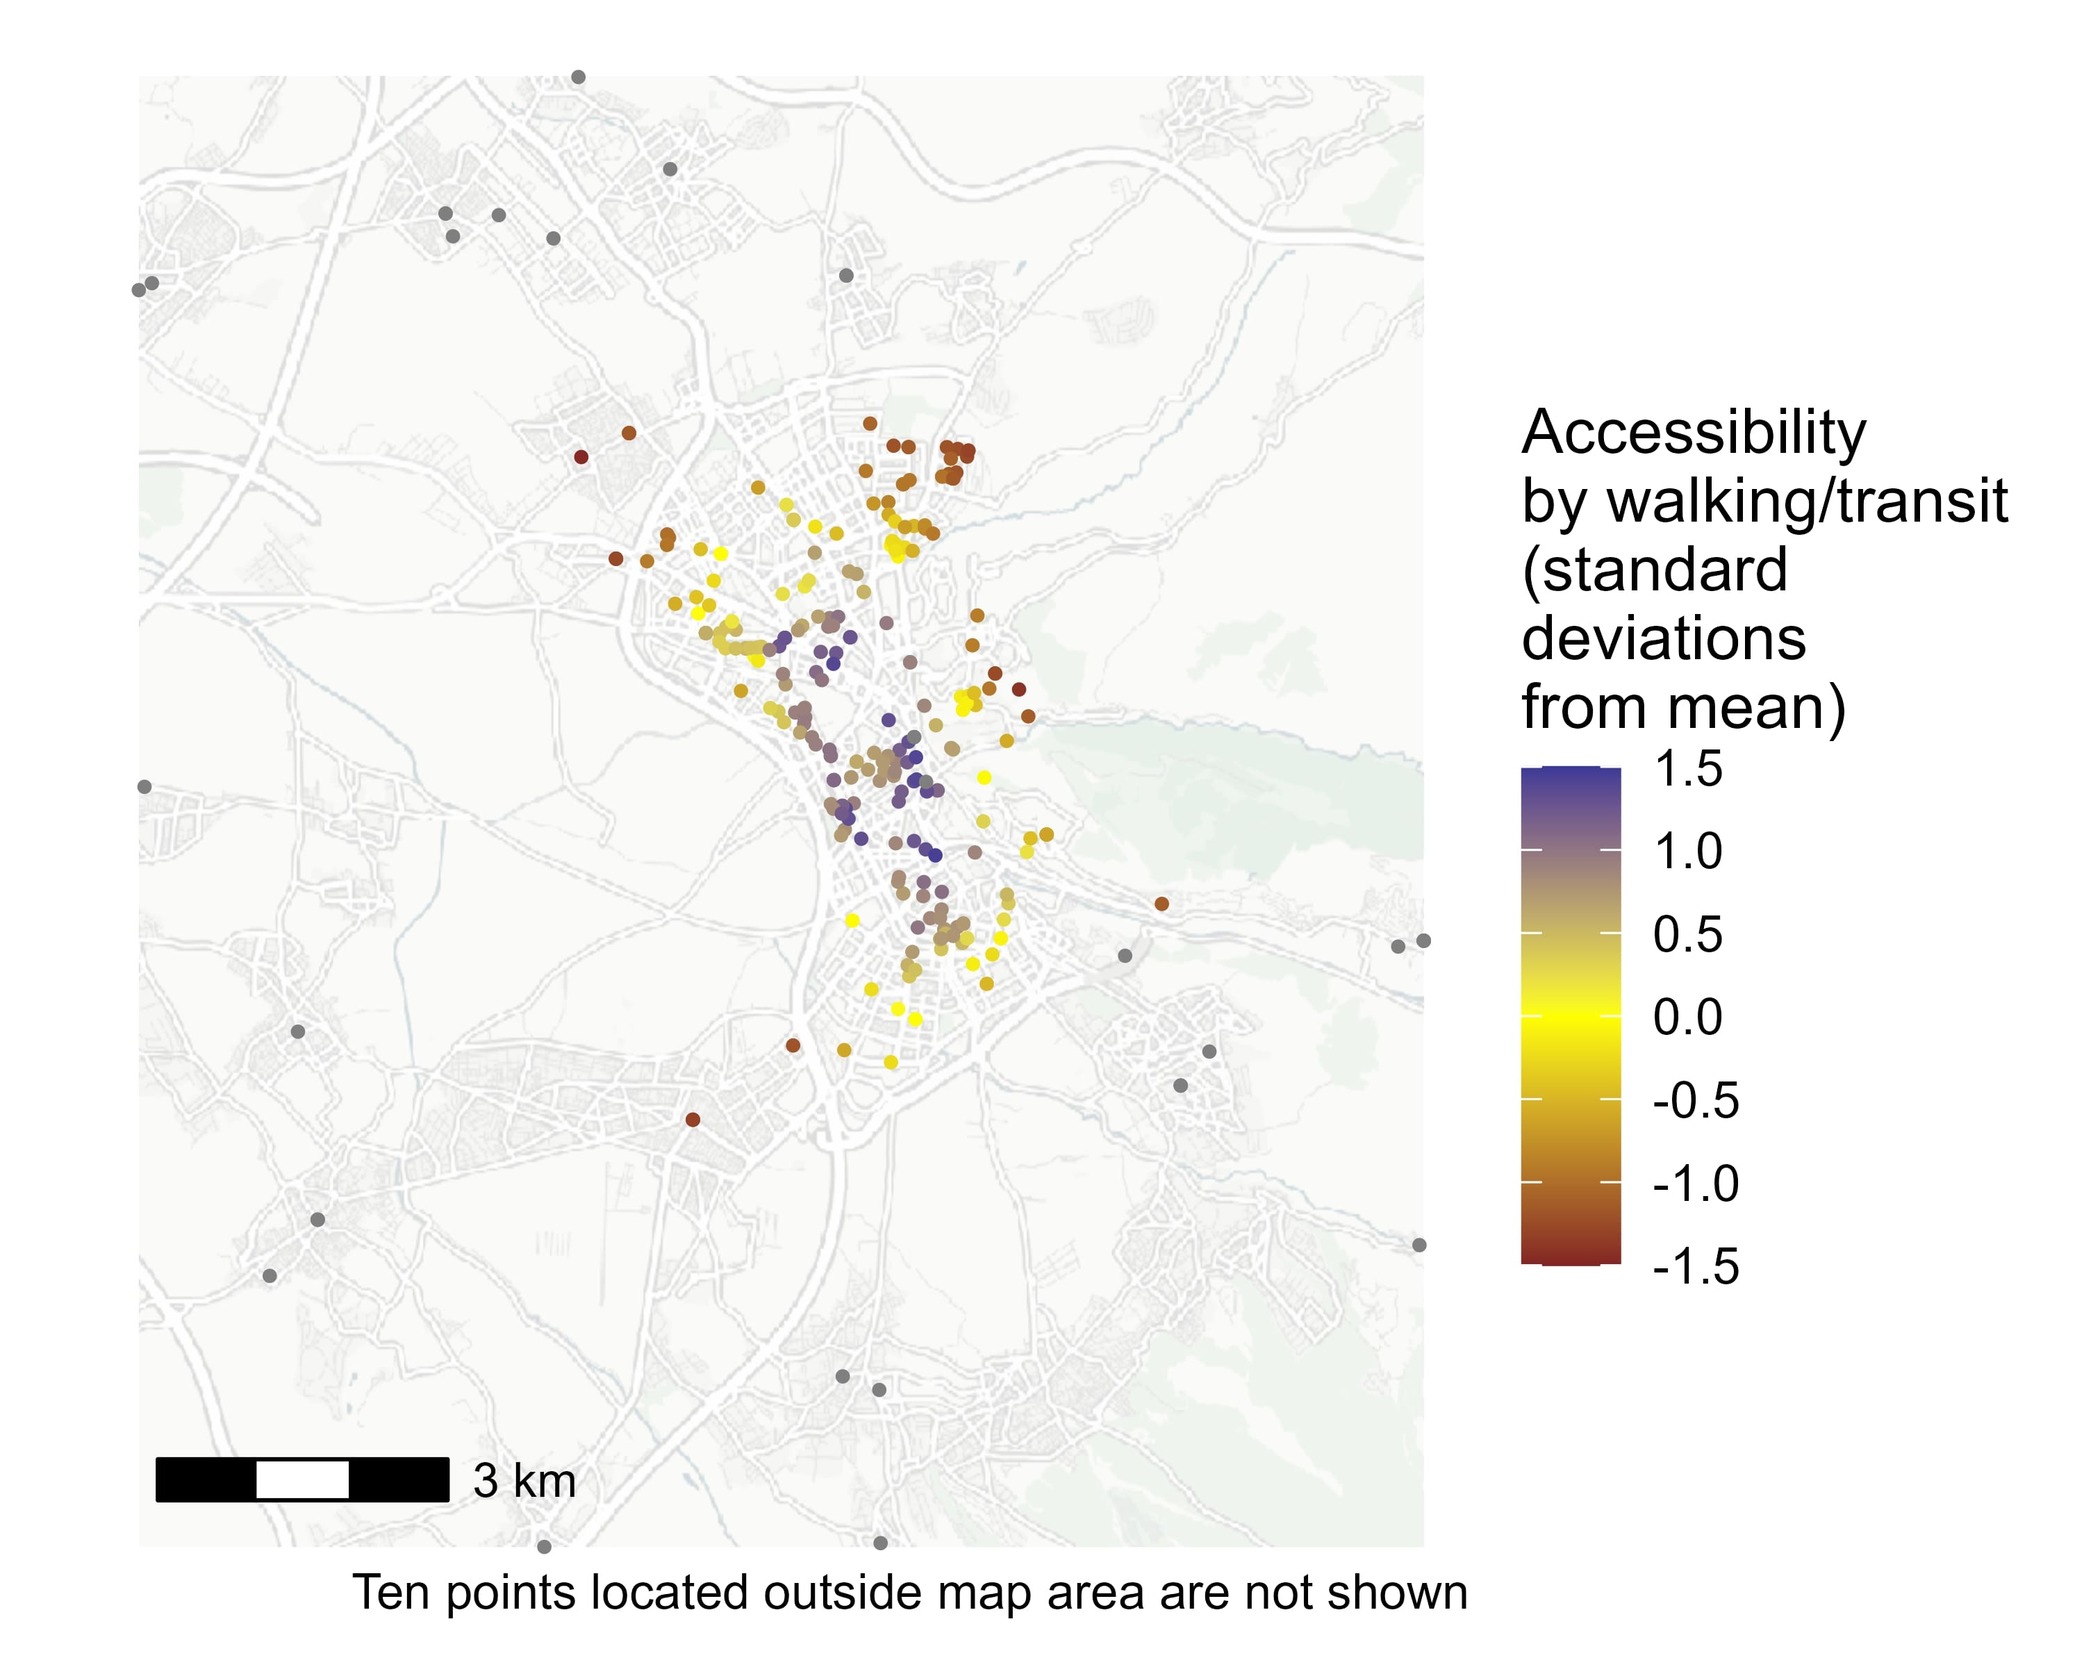
Figure 2 illustrates the spatial distribution of respondents’ homes and their accessibility measures. Note that these normalized values of access are not comparable across modes. Figure 2 shows that access without a car varies more than access by car.
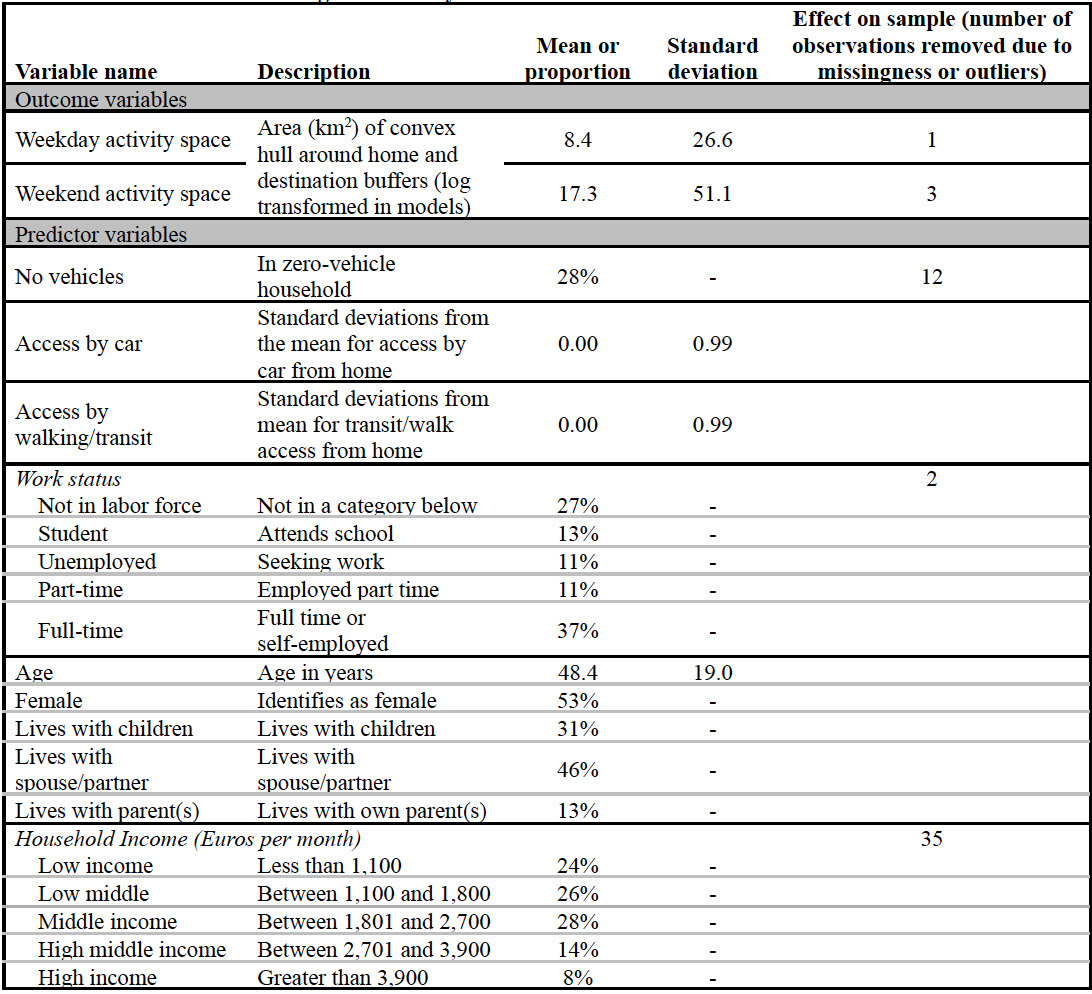
We estimated a regression model predicting the log-transformed activity space area for weekdays and weekends. Table 1 lists variables with descriptive statistics and the number of observations excluded due to outliers or missingness. The final sample comprised 327 individuals.

3. Findings
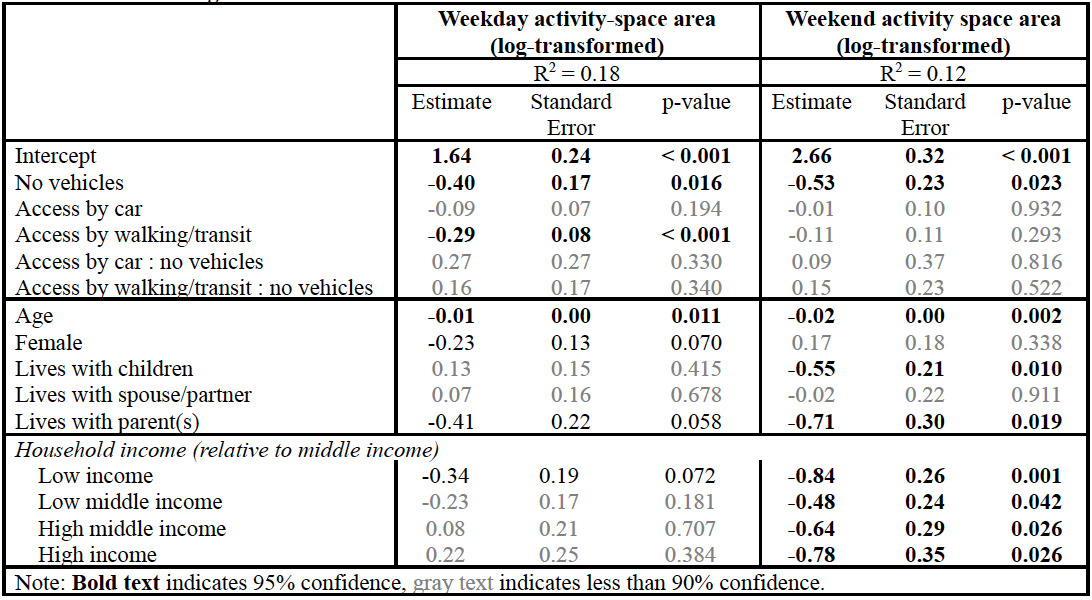
A model estimated with all variables in Table 1 showed multicollinearity, with a VIF value of 6.39 for Work Status. When this variable was removed from the model, remaining predictors had VIF values less than two for both models. Table 2 summarizes the final model results.

On weekdays, older individuals and those living with parents have smaller activity spaces. Controlling for these and other predictors, greater accessibility by walking/transit is associated with smaller activity spaces, consistent with the freedom-based narrative.
Accessibility is not a significant predictor of weekend activity spaces, which are better explained by household resources, supporting a constraint-based narrative. Individuals in households with children or without a vehicle have smaller weekend activity spaces. Interestingly, middle-income individuals have the largest weekend spaces relative to other income groups. The difference between low- and middle-income categories supports a constraints-based view, while the difference between middle- and high-income categories supports a freedom-based one. Middle-income households may enjoy greater freedom for discretionary trips while facing fewer time constraints than high-income peers (Tao et al. 2020).
These findings support a freedom-based narrative for weekday activity spaces and a constraints-based narrative for weekend spaces.
Acknowledgement
The project that gave rise to these results received the support of a fellowship from ”la Caixa” Foundation (ID 12010047).
The data were produced and made available thanks to funding from the Spanish R&D project PID2020-119569GA-I00 “Multi-Methodological Approach to Residential Behavior and Everyday Life” (MARBEL), funded by MCIN/AEI/10.13039/501100011033.
This publication is part of the Spanish R&D project PID2023-151749OB-I00 “Market and Spatial Dynamics of Housing” (DIME Vivienda), funded by MICIU/AEI/10.13039/501100011033 and by FEDER, UE.