


1. Questions
It is obvious that off-street parking occupies a substantial share of the land in U.S. cities, but it is hard to say precisely how much. Academic studies (e.g., Hoehne et al. 2019) have made estimates by inferrence from zoning codes and other rules. Garber et al. (2024, 2–3) provides a review. Recently, an organization called the Parking Reform Network (Carpenito 2023) has measured off-street parking more directly, in downtowns, by manually editing and supplementing polygons from OpenStreetMap (OpenStreetMap 2025). Similarly, this study introduces a novel dataset of parking lot boundaries for fifteen U.S. and a methodology to create such datasets using a deep learning model and post-processing techniques. It is hoped that this dataset will be useful to answering research questions involving surface parking. As an example, we use this dataset to answer: “How does the quantity of land used for off-street surface parking lots, and the share of tax parcel land devoted to them, vary between and within cities?”
Regarding the presence of “tax parcels” in this question, these[1] are of interest as a rough measure of land devoted to surface parking that could be used otherwise (e.g., for housing, retail or schools). Millard-Ball (2022, 31) estimates land used for streets (“including sidewalks, landscaping, and the road-way”) by the voids between parcels. Inspection of tax parcel maps showed that parcels do exclude most streets, as well as sidewalks and bodies of water. While imperfect, we think that parking lots’ share of parcel land measures their “opportunity cost” (Gabbe, Osman, and Manville 2021) better than their share of all land would, as the latter includes so much land that would be difficult or undesirable to develop.
2. Methods
The steps used to generate the parking lot dataset are as follows:
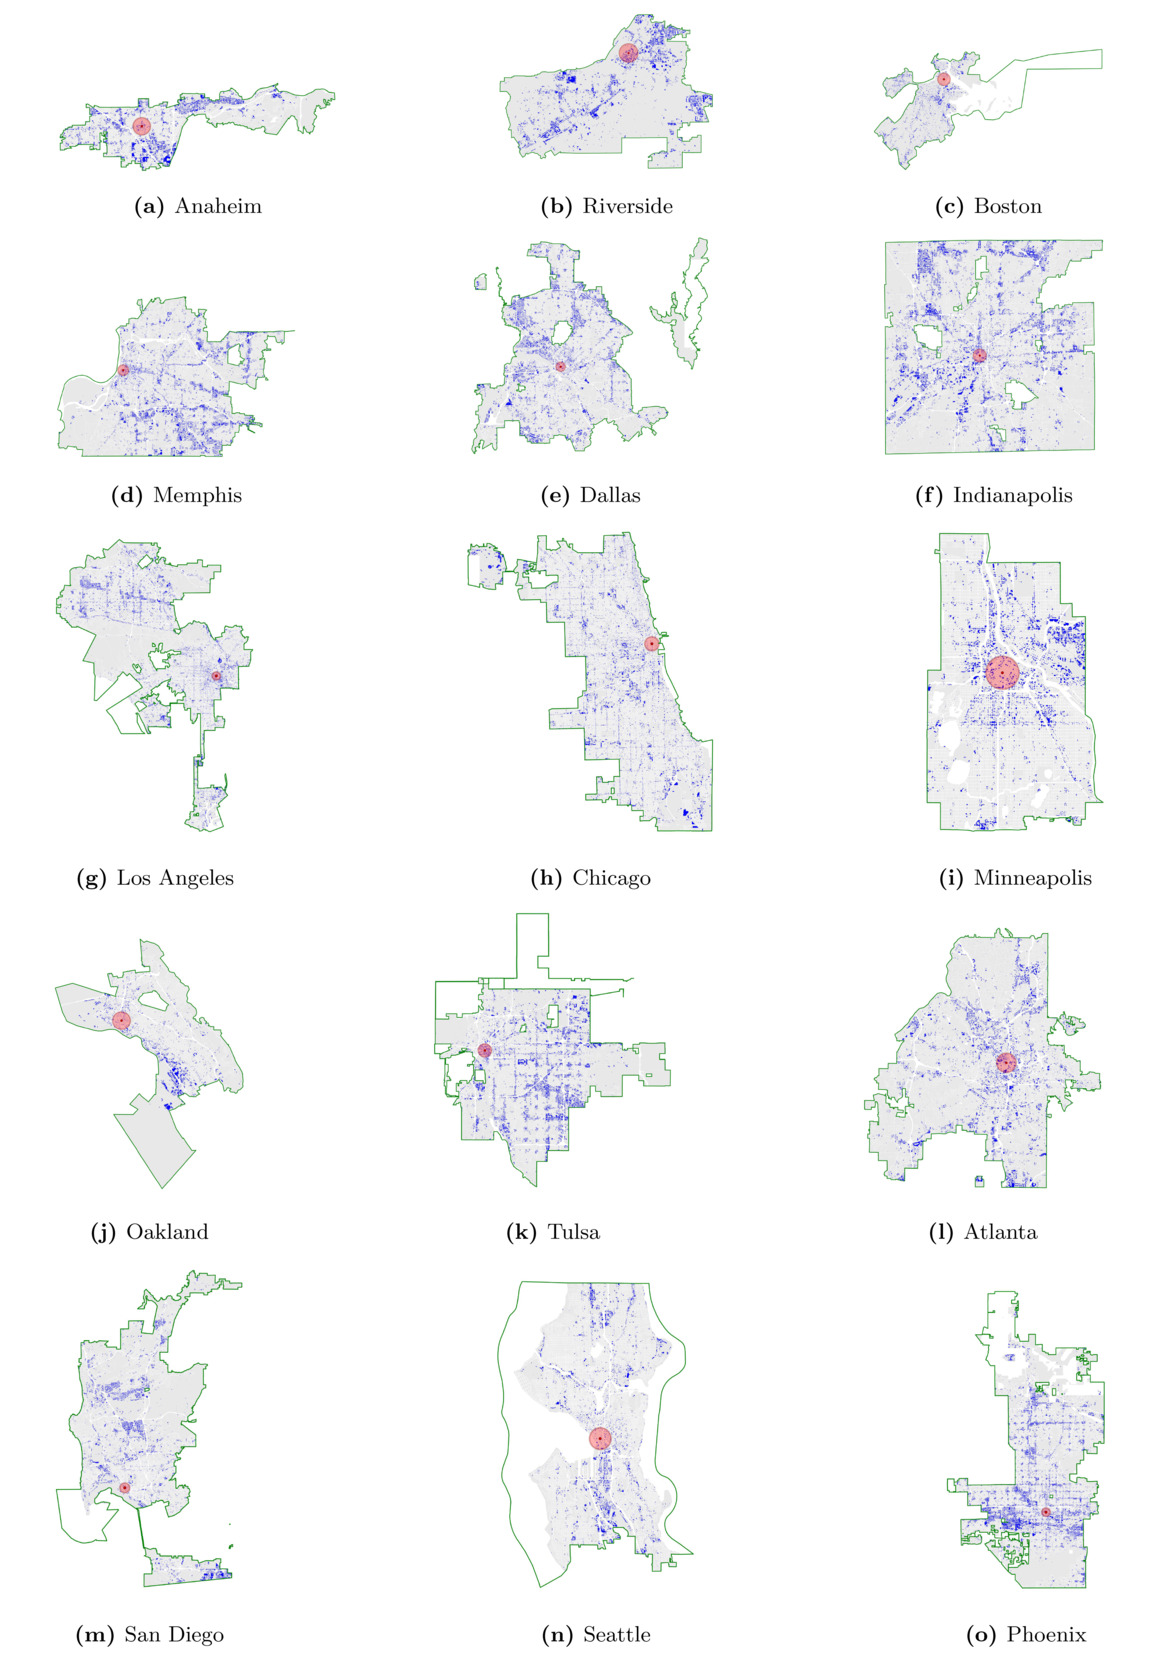
- Google Maps satellite tiles were downloaded for all land within the boundaries of the cities in Figure 1. These were selected because (i) they have accessible parcel data; and (ii) lie in different regions of the US. City limits are from the U.S. Census Bureau’s TIGER dataset (USCB 2024). We use city limits because laws such as minimum parking requirements (Shoup 1999) are typically applied at the city level.
-
The satellite tiles were fed into the deep learning model described[2] by Qiam, Devunuri, and Lehe (2025), which classifies each pixel in each tile as either parking or background. This model achieves a pixel-wise accuracy of up to 96.3% in test data. The deep learning model is available at https://huggingface.co/UTEL-UIUC/SegFormer-large-parking.
-
The predicted parking pixels were merged into GeoJSON polygons.
-
The Overpass Turbo service (https://overpass-turbo.eu/) was used to extract OpenStreetMap (2025) polygons of (a) airport aprons, (b) railroad land, and (c) parking garages. The model sometimes misclassifies (a) and (b) as parking. Regarding (c), garages are not surface parking—the study’s focus.
-
We used the ArcGIS polygon simplification tool to reduce the number of vertices in the parking polygons. This did not produce any noticeable changes in their shapes or the statistics, but it makes the dataset much smaller and easier to adjust.
-
Manual correction in ArcGIS was used to fix major mistakes and delete polygons of paved surface used for cargo handling or industry.
The code that executes steps (i)-(iv) is available at https://github.com/UTEL-UIUC/parking-lot-mapping-tool.
For the parcel share calculations, tax parcels were obtained from the county datasets. An online appendix at https://github.com/UTEL-UIUC/ParkingLot-Statistics provides links to the data sources used. Finally, we delete any parking polygons lying outside parcels—which were rare, very small and obviously erroneous.
To investigate how parking varies within cities, we assign each city a “downtown point” coordinate by choosing a point lying within the area labeled as “downtown” on Google Maps that seems to be central or focal. Duranton and Puga, Appendix A (2023, Appendix A) do the same. The exact point chosen is a judgement call, as there exist no Platonic city centers.
3. Findings
An interactive ArcGIS map showing the parking polygons, downtown points, and city limits is available at https://www.arcgis.com/apps/dashboards/f51defadb58e4a6fb7c219b6dc50f5bb. The parking lot dataset generated is available in shapefile format at https://huggingface.co/datasets/UTEL-UIUC/Parking-Lot-15cities. Figure 1 shades parking areas as blue and parcel areas as gray. The first column of Table 1 shows the total share of parcel land used for surface parking. Oakland has the least surface parking share overall (3.4%), while Anaheim has the highest (10.7%). Columns 2-4 of Table 1 present the share of parcel land used for off-street surface parking lots in three zones: a CBD area 1 km from the downtown point), a middle area (1-5 km from the downtown point), and an outer area (beyond 5 km). Tulsa’s CBD exhibits the highest share of parking (31.7%), and Boston’s the lowest (2.32%). The last column of Table 1 shows the how far, on average, a square meter of surface parking is from the downtown point. This average is obtained by taking a weighted average of the distance of each parking lot’s centroid to the downtown point, where each parking lot’s weight is its area.
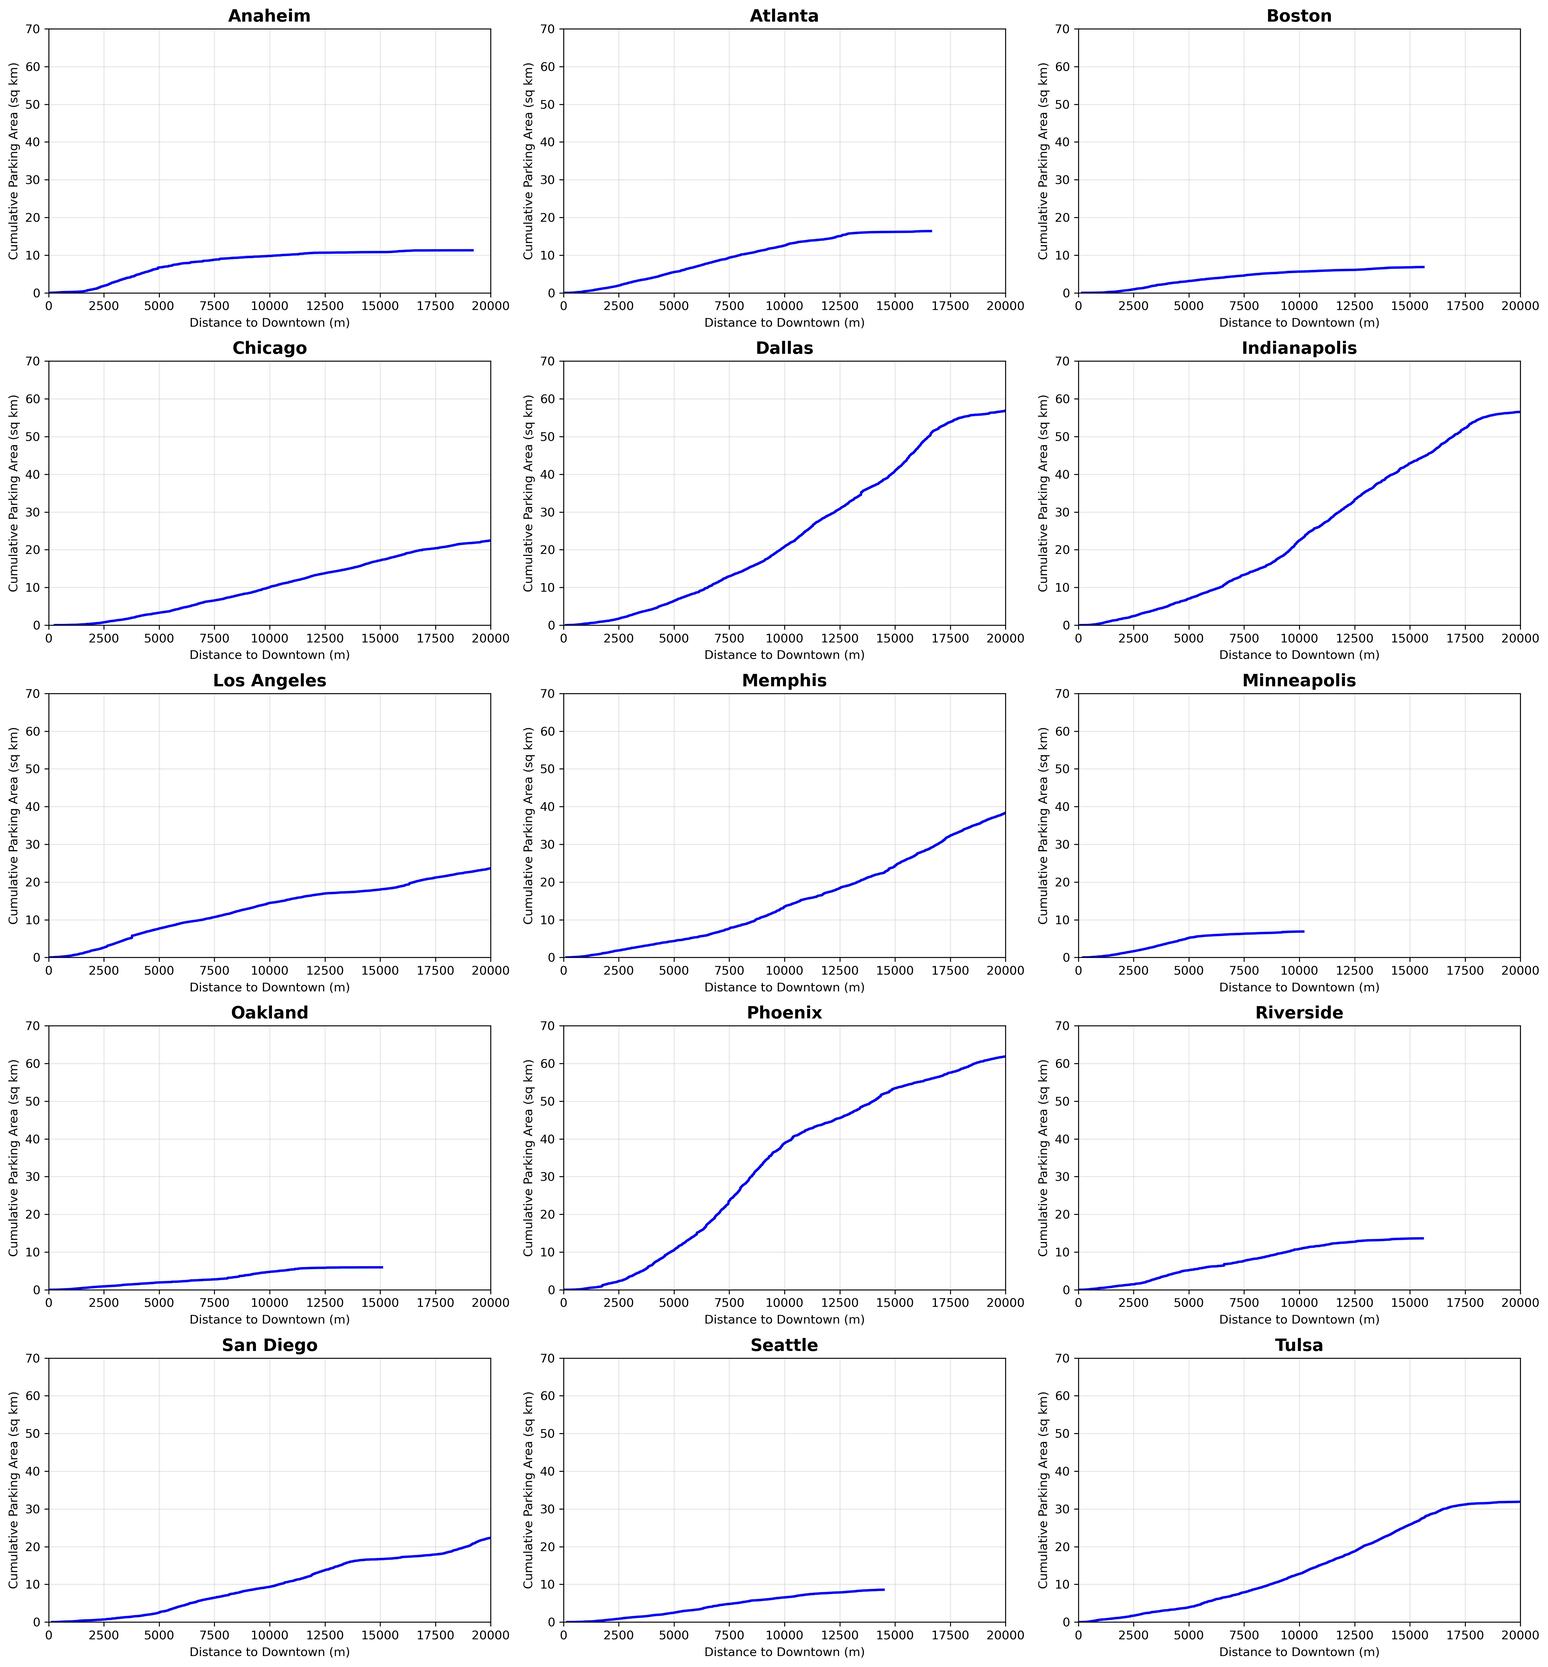
Figure 2 presents the cumulative parking area (in square kilometers) that lies within a certain distance from the downtown point, up to 20 km. Phoenix, Dallas and Indianapolis have the highest area of parking within 20 km of downtown, at around 60 km2. A common approach to analyzing spatial gradients of urban variables is to create concentric rings around the downtown point and analyze how the variable of interest varies across them (e.g., Jiao 2015). Figure 3 shows the percentage of parcel land in each ring used for off-street surface parking, with each ring being 1 km thick. Generally, the share of parking is highest close to downtown and declines overall with distance, but some cities (e.g., Oakland, Memphis, Tulsa) have a notable second peak farther out. By inspecting maps, we saw this second peak typically corresponds to rings containing shopping malls and car dealerships.

Beyond analyzing the distribution of parking lots, further research could use this study’s dataset to investigate relationships of cause-and-effect. Possible research topics include: (i) the influence of land-use regulations; (ii) the value of land occupied by surface parking lots, as investigated for streets by Millard-Ball (2022) and Guerra, Gilles, and and Ma (2025); and (iii) the association of parking and the urban heat island effect (Onishi et al. 2010). The methodology could also be used to generate similar datasets for other cities, or look at metropolitan areas rather than city boundaries.
Cook County (containing Chicago) provides a useful map at https://maps.cookcountyil.gov/taxmapviewer/ where readers can see the nature of US tax parcels.
While Qiam, Devunuri, and Lehe (2025) presents a manually-annotated training dataset of 12,000 mask/tile pairs used to train the model, that dataset is different than the one used here. This study’s dataset covers different titles, consists of model predictions, and uses different post-processing steps.