


1. Questions
Big mobility data, often generated from cell phones, are becoming increasingly more popular in transportation research. Cell phone-generated mobility data provide unprecedented spatial and temporal resolutions and extent at a fraction of the cost of traditional data collection. These datasets are typically generated as synthetic mobility records derived from multiple sources, trained on mobile location data, and validated against ground-truth observations for multi-state regions (Replica 2025). However, further data validation is necessary in advance of using data for applied science or for local decision-making. Our study asks the question: how well do modeled mobile phone tracking data, specifically Replica data, represent actual bike, pedestrian, and car volumes in Santa Barbara, California?
2. Methods
According to Replica, their transportation data are modeled from a variety of original data sources, such as mobile location data, demographic data, built environment data, economic activity data, and ground truth data from local municipalities. The scale of these models is “megaregions,” which encompass multiple states and 10 to 50 million residents, depending on the region (Massey, n.d.). Transportation data are modeled as individual trips, with each trip specifying the street network links traversed by a synthetic user. Trips are generated to represent an average weekday or weekend within a given season, such as a typical Thursday in the spring of 2021. Replica data also do not account for recreational trips, where the start and end points of the trip suggest biking or walking for exercise (Replica 2025).
We accessed modeled transportation volumes from ReplicaHQ.com and evaluated them against validation data provided by the City of Santa Barbara. Video counter volume data, collected at multiple intersections and analyzed manually, were cleaned and matched to Replica’s network links. For each time frame, Replica trips passing through intersections with video count data were totaled, and observations were aligned by day of the week, season, and year for comparability. In total, 33 sites across the city were matched, representing a range of car, bicycle, and pedestrian volumes.
To compare Replica counts to actual counts, we ran a linear regression for each of the modes of transportation. We estimated the R2 value for each analysis and compared the results among transportation types.
3. Findings
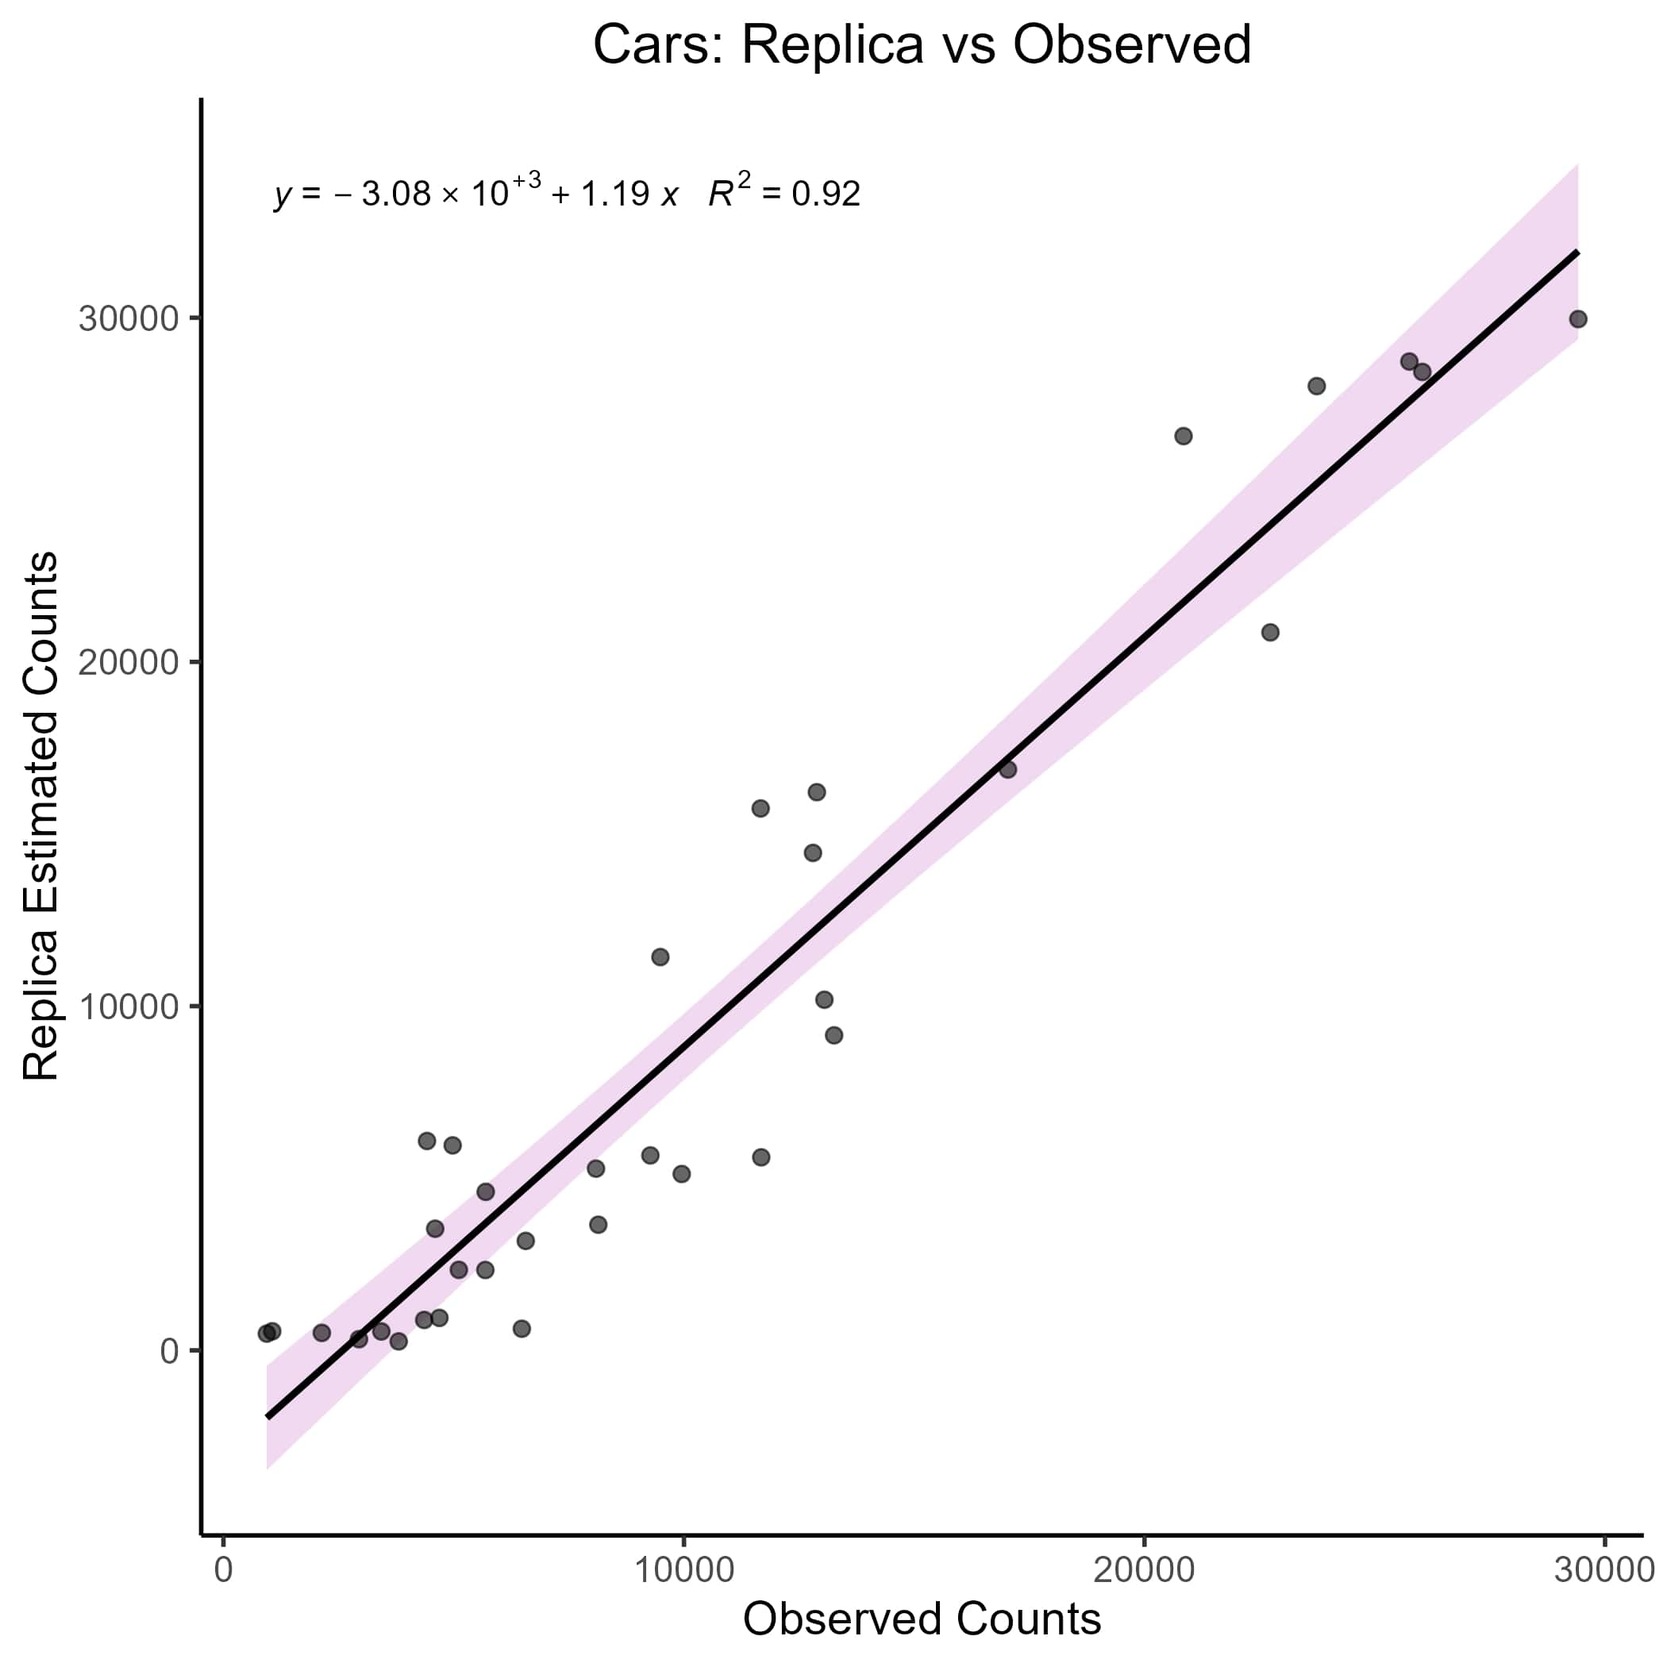
Modeled car volumes were accurate, with an R2 value of 0.94. Figure 1 shows the results of the linear regression analysis. As shown in the plot, a majority of the car count sites were underestimated by Replica’s model, particularly those with lower volumes. Most of the sites with the highest volumes were more likely to be overestimated by the model.
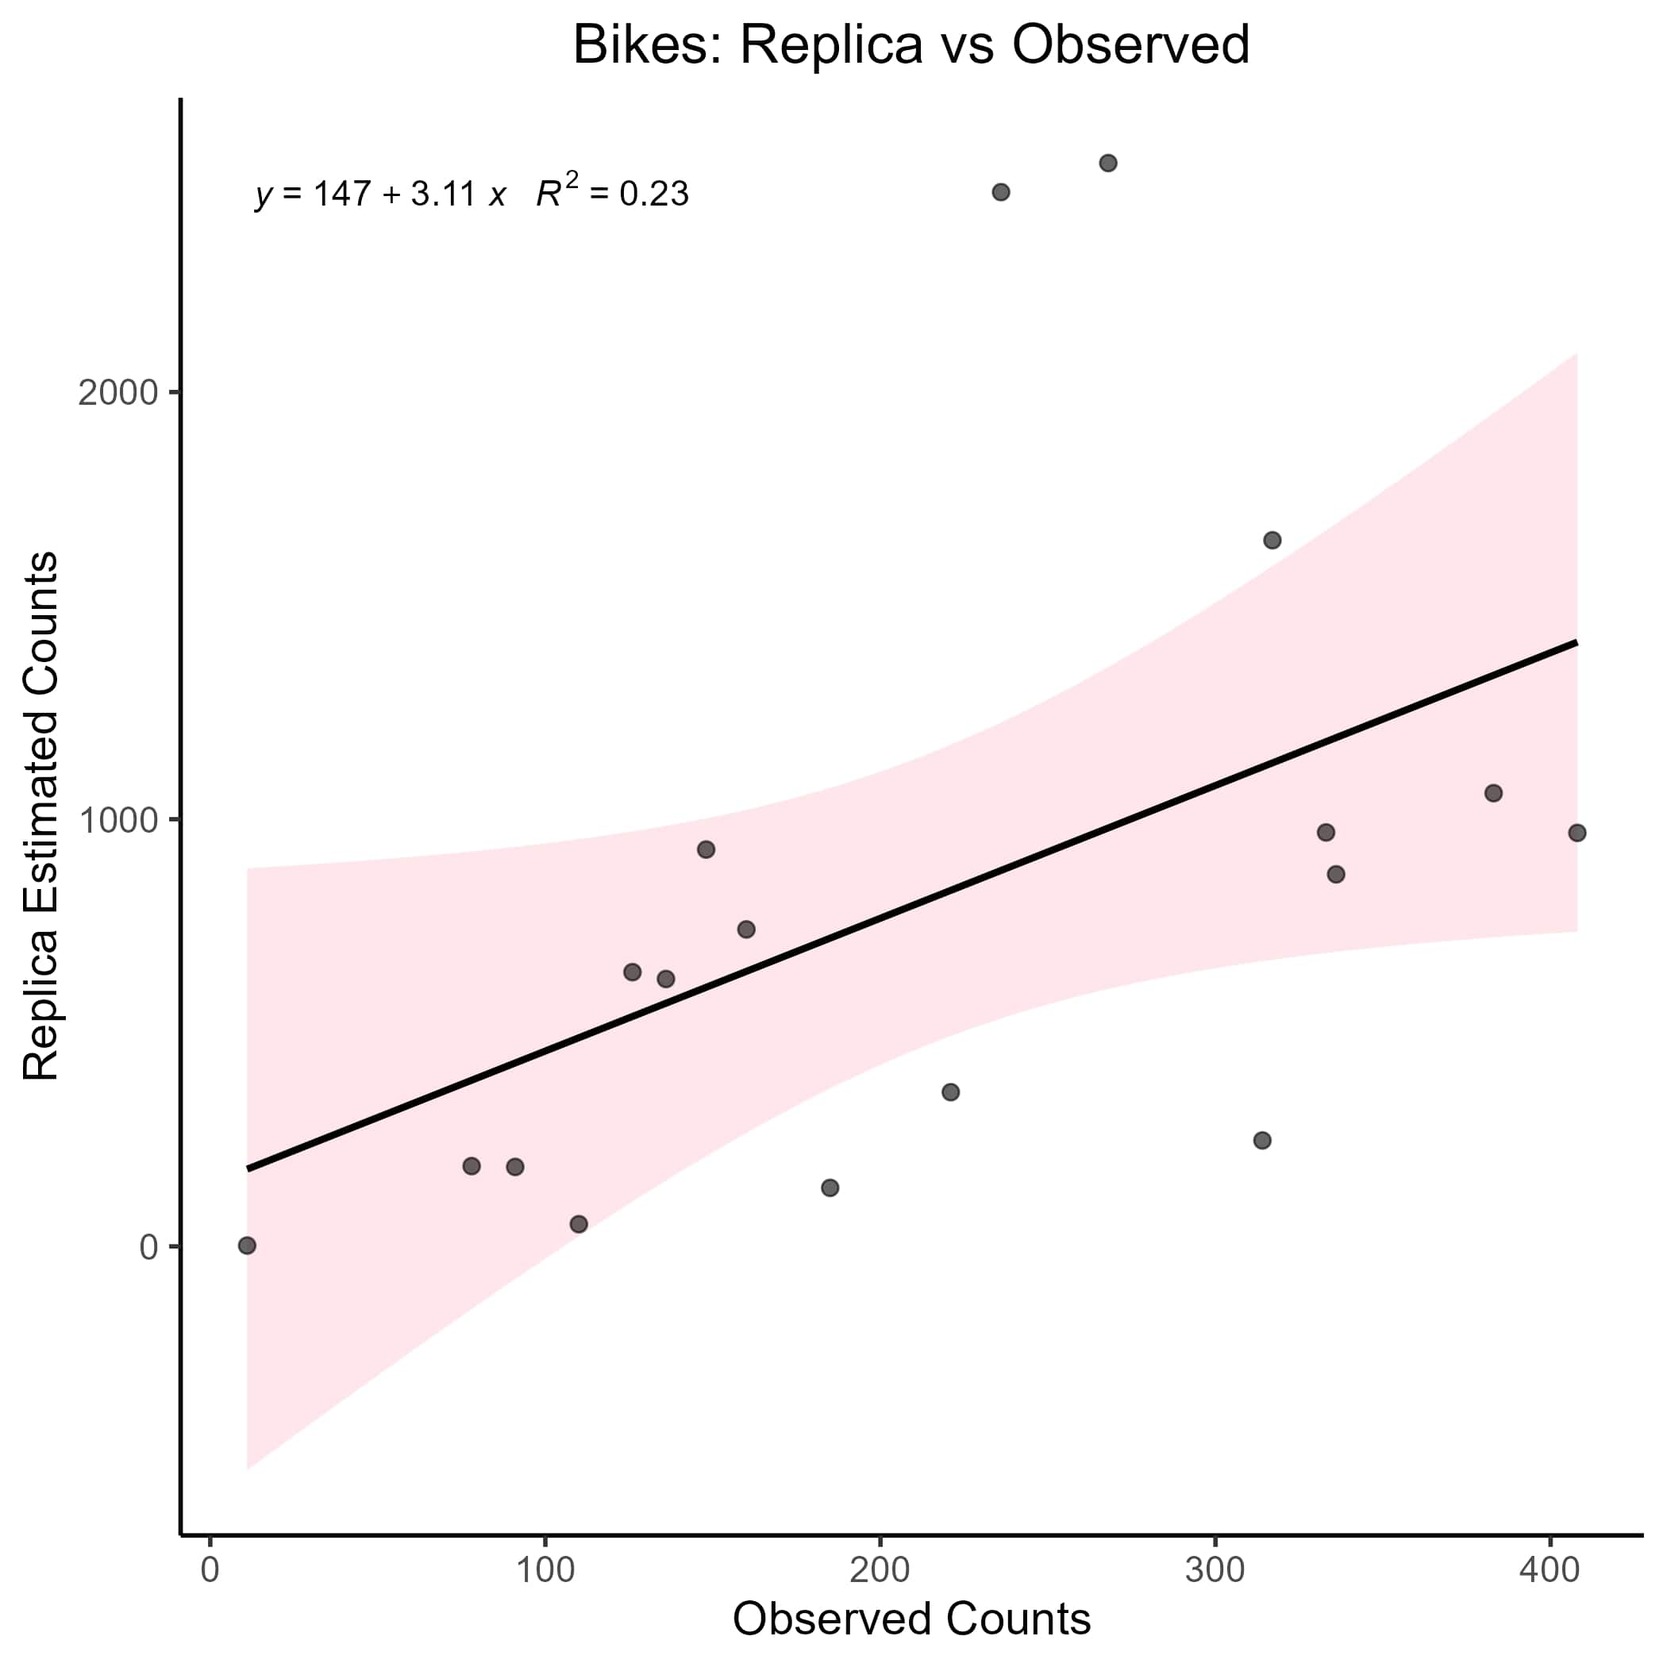
Bike volumes had a much lower correlation coefficient than vehicles, with an R2 of 0.23. Figure 2 depicts a much larger confidence interval, illustrating a higher chance of error. For bikes, Replica’s model over- and underestimates volumes at similar rates, with slightly more than half being underestimated by the model. The variability appears random, where the model over and underpredicts randomly, not based on the site volumes. The two sites with the largest residuals are overestimated by nearly an order of magnitude. While we do not show the results here, we spent significant time trying to identify patterns that could explain the differences in prediction, but the error always appeared random.
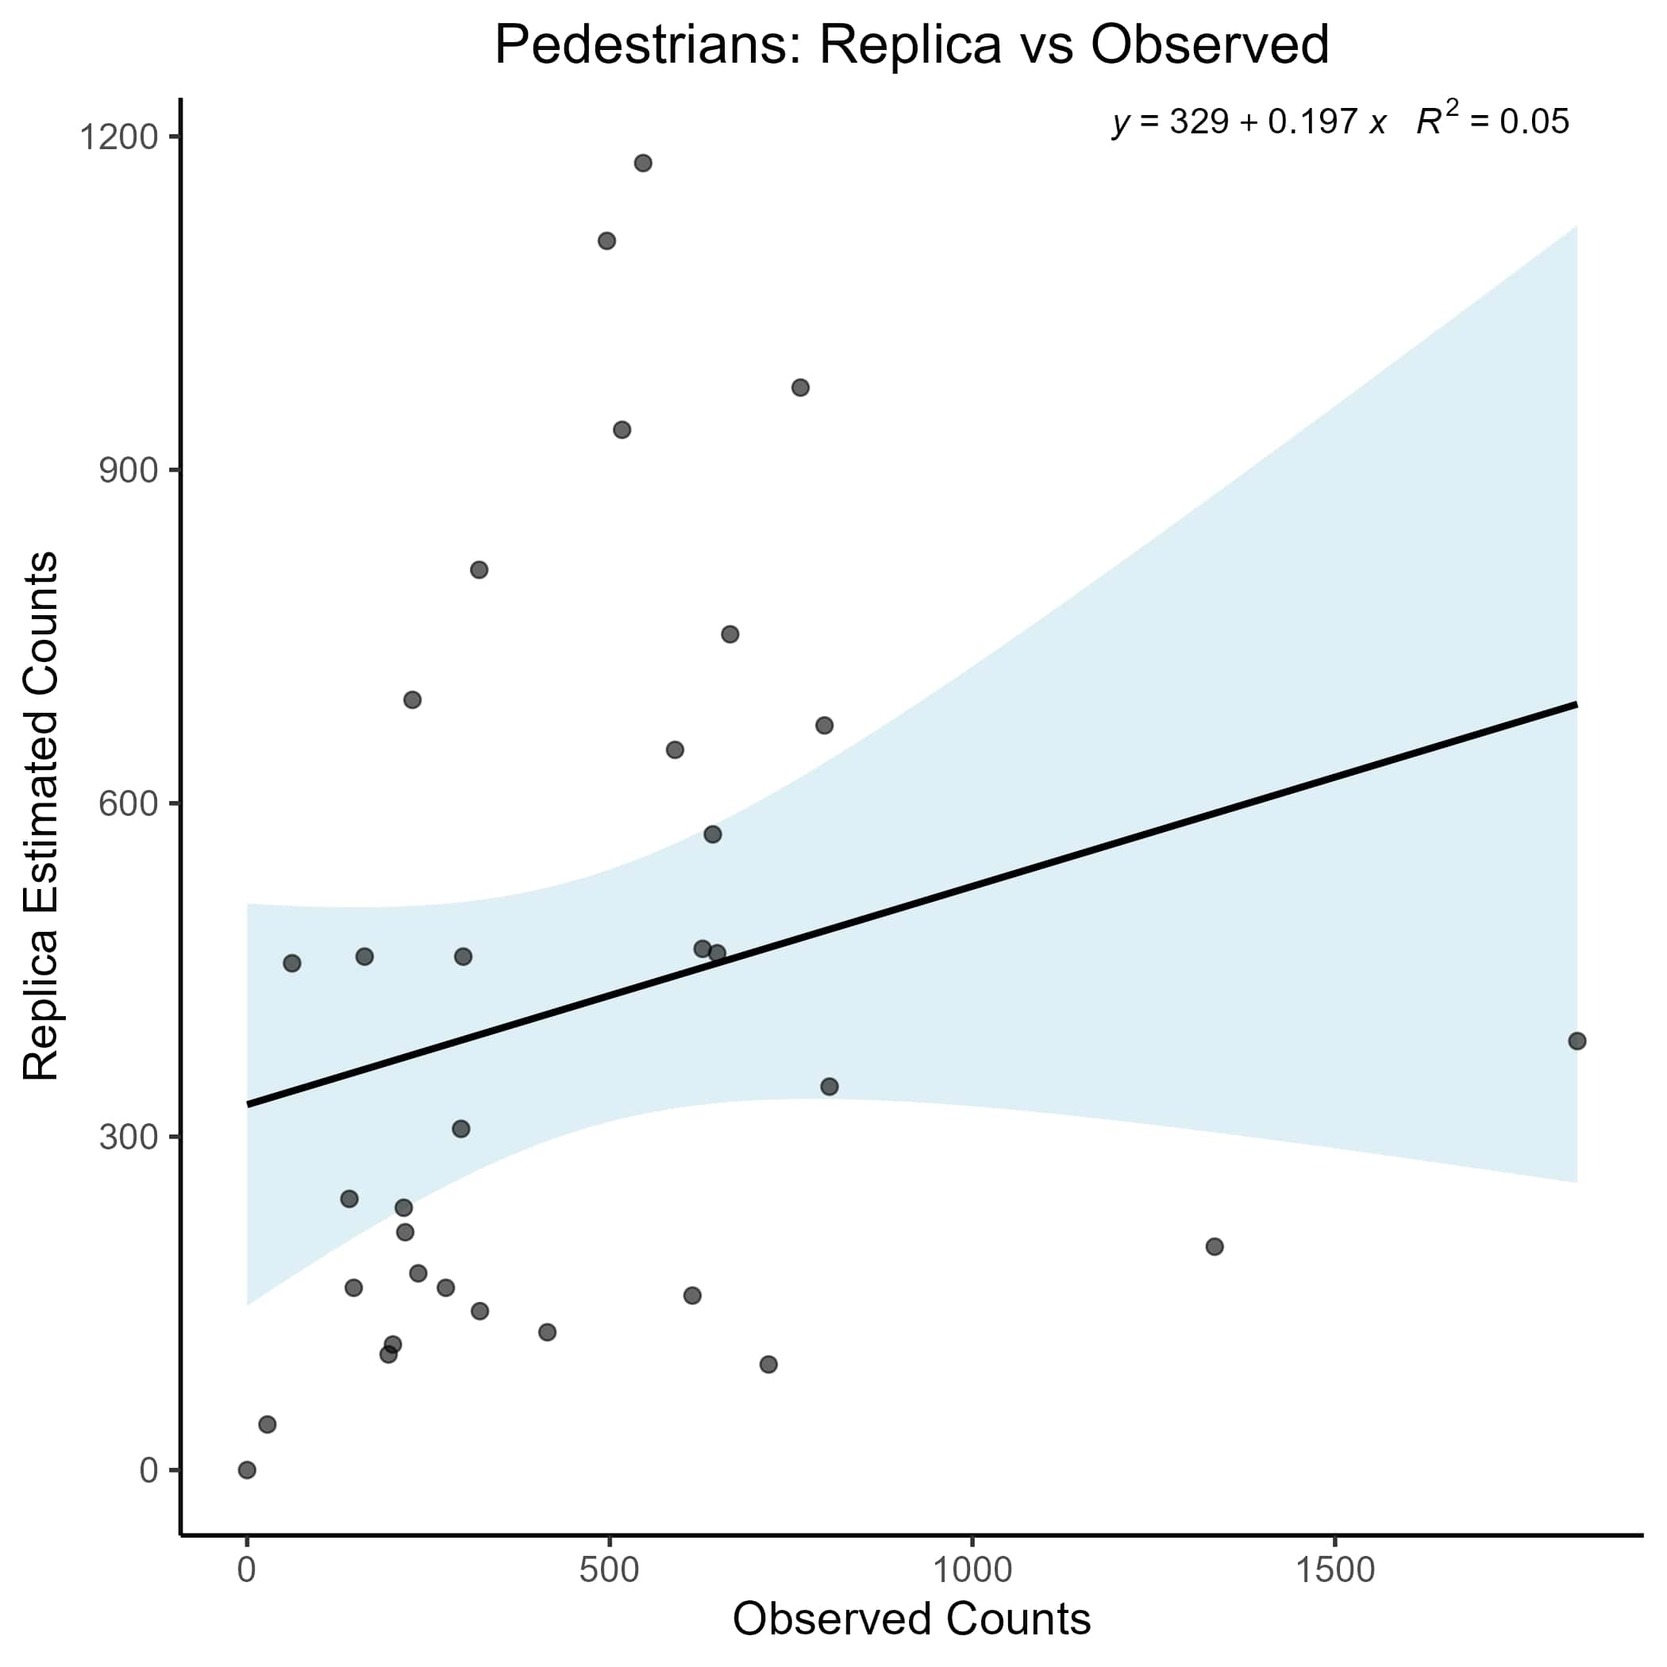
Among the three transportation modes, pedestrian volumes were modeled with the least accuracy, yielding an R² of 0.05 and wide confidence intervals (Figure 3). As with bicycle volumes, approximately half of the sites were overestimated and half underestimated, with no clear trend in model performance across volume levels. However, the magnitude of error was substantially greater, with the most severely overestimated site exhibiting observed volumes nearly eight times lower than the modeled estimate.
These findings highlight the critical need for improved data on bicycling and walking. Modeled car volumes likely achieve higher accuracy as a greater proportion of the cell phone data are generated through vehicle travel (Massey, n.d.). Bicycling and walking are more difficult to isolate based on space-time patterns (Lee and Sener 2020). Additionally, Replica does not model multi-modal transit trips, meaning the trips where individuals take the bus and walk to reach their destination are assigned one mode over the other (Replica 2025). This may lead to an underrepresentation of biking and walking trips near transit stops. Investment in bicycle and pedestrian count programs could improve training data and facilitate more accurate model development. In the meantime, alternative data sources will be necessary for applications such as exposure estimation. It is likely that this issue is not specific to Replica and includes other mobile location datasets, as the task of identifying different modes is challenging (Lee and Sener 2017, 2020). While mobile location data with high spatial and temporal resolution are appealing, reliance on them without sufficient validation may be problematic and risk misleading decision-making, particularly in small and mid-sized cities such as Santa Barbara.