Processing math: 100%
Skip to main content
null
Findings
  • Menu
  • Articles
    • Energy Findings
    • Resilience Findings
    • Safety Findings
    • Transport Findings
    • Urban Findings
    • All
  • For Authors
  • Editorial Board
  • About
  • Blog
  • covid-19
  • search

RSS Feed

Enter the URL below into your favorite RSS reader.

http://localhost:9521/feed
Transport Findings
September 02, 2020 AEST

Classifying Transport Mode from Global Positioning Systems and Accelerometer Data: A Machine Learning Approach

Avipsa Roy, Daniel Fuller, Kevin Stanley, Trisalyn Nelson,
accelerometergpssupervised classificationsupport vector machinestransportation mode detection
Copyright Logoccby-sa-4.0 • https://doi.org/10.32866/001c.14520
Photo by Erik Mclean on Unsplash
Findings
Roy, Avipsa, Daniel Fuller, Kevin Stanley, and Trisalyn Nelson. 2020. “Classifying Transport Mode from Global Positioning Systems and Accelerometer Data: A Machine Learning Approach.” Findings, September. https:/​/​doi.org/​10.32866/​001c.14520.
Save article as...▾
Download all (3)
  • Figure 1: Total number of trips with average trip duration of each transportation mode
    Download
  • Figure 2: ROC curve showing sensitivity and specificity across different feature sets for window size of 7s
    Download
  • Figure 3: Confusion matrix of all travel modes using test data for GPS and Accelerometer features with window size 7s
    Download

Sorry, something went wrong. Please try again.

If this problem reoccurs, please contact Scholastica Support

Error message:

undefined

View more stats

Abstract

Smartphones and wearable devices are driving a boom in mobility data. We use data-driven tools for classifying movement data into five different travel modes (bicycle, walk, bus, motor vehicle and SkyTrain) in Vancouver and St. John’s, Canada. Using data from a GPS-enabled smartphone app (Itinerum) combined with a wrist-worn accelerometer (GENEActiv) collected over a period of 67 days, we classified modes using Support Vector Machines from 4071 trips. Pre-labelled data were used to classify modes with 90.9% accuracy when data from both devices were combined in comparison to a single data source with accuracy ranging between 55.5% and 79.4%.

Research Question and Hypothesis

Understanding travel patterns is critical for transportation planning and monitoring impact of policy and infrastructure. Traditional travel data collection techniques, like GPS-based travel surveys (Stopher, FitzGerald, and Zhang 2008), are prone to underreporting of trip activity by participants (Bricka and Bhat 2006). As a result, sensor data collected by health apps on smartphones or wearable devices have emerged as a method for collecting data on transportation mode choices and travel patterns.

Researchers (Zhou and Hu 2008; Ellis et al. 2014) typically use GPS and accelerometry data from wearable health monitoring devices with accelerometer and GPS sensors built within the same device. Integrating these datasets from different platforms is challenging because of the varying space-time resolutions each device has. Some studies (Stenneth et al. 2011; Hemminki, Nurmi, and Tarkoma 2013) demonstrated how tree-based machine learning algorithms could be applied to GPS data collected at a frequency of 15 seconds for GPS data from mobile phones to 1.2 s from accelerometers for mode detection. However, there is a major gap in determining an optimal time window generalizable across multiple data platforms for achieving the highest level of prediction accuracy when it comes to classifying transportation modes.

The goal of our study is to demonstrate how classification of GPS and accelerometer collected from two different platforms into transportation modes - active (bike/walk), private (car) and public (trams/railways/subway), is more accurate when features from both sources are combined. We hypothesize that classification accuracy improves when data are combined using varying window sizes to tackle noise filtering from the fused data. To this end we use a supervised classification algorithm Support Vector Machine (SVM) with a radial basis function.

Methods and Data

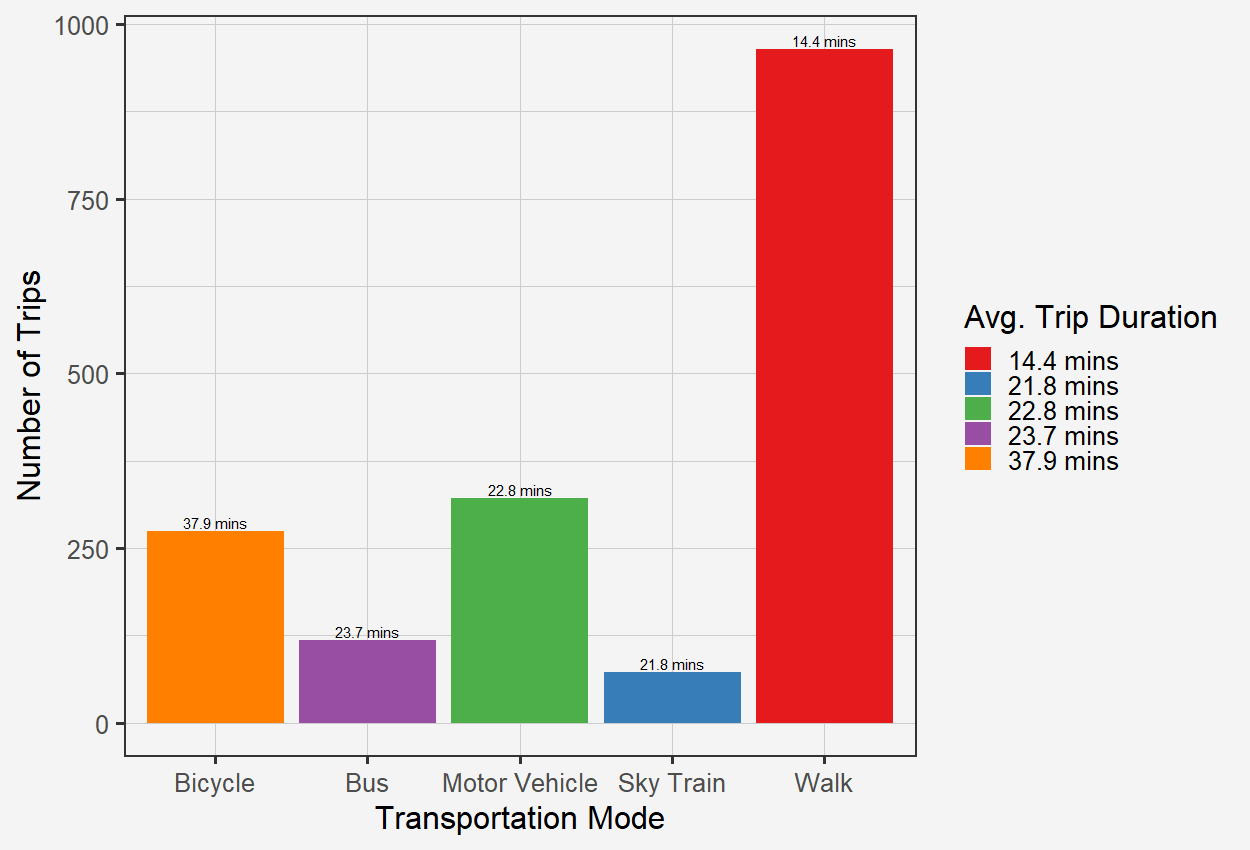
We recorded 4071 user-defined trips after removing stops and congestions from 12 users for a period of 6 months from a smartphone application Itinerum (Patterson et al. 2019) which collected GPS data and wrist-worn accelerometer (GENEActiv 2020). The data were analyzed at 1-minute temporal resolution and included 93,772 data points. Participants were from the cities of Vancouver and St. John’s, Canada. All trips were pre-labelled by participants and categorized into 5 different travel modes with varying trip durations (Figure 1), with an average trip duration of 24.5 minutes for all trips (min = 2 mins, max = 62 mins, bicycle= 37.9 mins, bus = 21.8 mins, motor vehicle = 22.8 mins, sky train = 23.7 mins, walk = 37.9 mins). Walking (n=964) followed by motor vehicles (n=321) were the most common modes in the dataset.

Figure 1
Figure 1:Total number of trips with average trip duration of each transportation mode

We computed summary statistics of speed and vector magnitude of acceleration –from raw GPS and accelerometer data (Table 1) and used signal processing functions (Table 1) to extract a total of 37 features which were used as input to the SVM algorithm. We also examined different window sizes of 3, 5, 7, and 10 seconds by summarizing the mean of the raw features in each time period in order to remove noise from the raw data. All analysis were performed using R 3.6.1 and ArcGIS© 10.7.1.

Table 1:Features extracted from raw GPS and Accelerometer data
Key Features Summary statistics Mode Description Reference
Distance Mean, SD, IQR, Skewness, Kurtosis GPS Euclidean distance between consecutive GPS points along a trajectory. Jahangiri and Rakha (2014)
Feng and Timmermans (2013)
Yang et al. (2018)
Speed Rate of change in net displacement
Net displacement The squared net displacement between the current relocation and the first relocation of the trajectory.
Height Relative altitude of a point along the trajectory from the ground.
Relative turning angle A relative angle between successive GPS points along a trajectory.
Vector magnitude of acceleration Accelerometer A square root of the squared sums of directional accelerations along X,Y and Z axes.
Peak intensity of acceleration Max The number of the signal (acceleration) peak appearances within a certain period of time ‘t’ Hemminki, Nurmi, and Tarkoma (2013)
Reddy et al. (2010)
Dominant frequency of acceleration Max The peak (max) acceleration obtained after performing a Fast Fourier transform on the acceleration signal.
Signal power of acceleration Mean The instantaneous power of the acceleration signal – calculated as the square of the acceleration magnitude at instant ‘t’

We applied a supervised classification algorithm - Support vector machines (SVMs) to our input feature set in order to classify travel modes. SVMs, first introduced by Cortes and Vapnik (1995) have been heavily used in data mining for different purposes (Hamel 2011; Li et al. 2011; Anguita et al. 2012) and are a non-probabilistic binary classifier that separates two classes by determining an optimal separation hyperplane. We used a multiclass separation using a radial basis function to classify all five travel modes by coupling binary classifier probabilities (Wu, Lin, and Weng 2004). 70% data were used for training the SVM model and the remaining 30% for testing with a 10-fold repeated cross-validation with 3 repeats across 3 feature set combinations (only GPS, only accelerometer, both GPS and accelerometer). Using a Synthetic Minority Sampling Technique (SMOTE) a resampling technique (Chawla et al. 2002) we accounted for the imbalance in trips among the five modes and calculated the area under the curve (AUC) (Hand and Till 2001) from resampled data to test the average accuracy of our model we use Equation 1. AUC score measures the separability between the estimated probability distributions that a randomly chosen member of one class belongs to that particular class compared to other classes.

AverageAccuracy=∑ki=1tpi+tnitpi+tni+fpi+fnik; where, k = no.(1)of classes, tp = true positive, tn = true negative,fp = false positive, and fn = false negative

We also report the F1-score, precision and recall based on sensitivity and specificity (Altman and Bland 1994) of each mode along with the balanced accuracy (Velez et al. 2008). Finally we visualize the classification accuracy using a confusion matrix for the best feature combination. Our study is a proof of concept for sensor fusion and window size, so we do not compare different machine learning methods.

Findings

We found the model accuracy varied with the type of data sources and window sizes used. The overall accuracy of the fitted model improved with increasing window size with the highest mean accuracy (91.1%) achieved by combining both GPS and accelerometer features (Table 2). Among all scenarios, the window size of 7s had the lowest variance in accuracy (Table 2) using SMOTE to account for imbalanced classes. The accelerometer features had the lowest mean accuracy of 55.5%.

Table 2:Variation in model accuracy with window size and type of features using SVMs
Feature Set SVM Hyperparameters: methods = “repeatedcv”, k = 10 folds, repeats = 3, resampling = “smote”, kernel = “radial”
Window Size Lower (5% CI) Accuracy Upper (95% CI)
GPS 3s 0.642 0.689 0.734
5s 0.705 0.763 0.815
7s 0.727 0.794 0.852
10s 0.779 0.854 0.911
Accelerometer 3s 0.510 0.560 0.610
5s 0.4915 0.555 0.618
7s 0.495 0.571 0.646
10s 0.526 0.618 0.704
GPS and Accelerometer 3s 0.703 0.748 0.790
5s 0.758 0.812 0.859
7s 0.856 0.909 0.947
10s 0.846 0.911 0.955

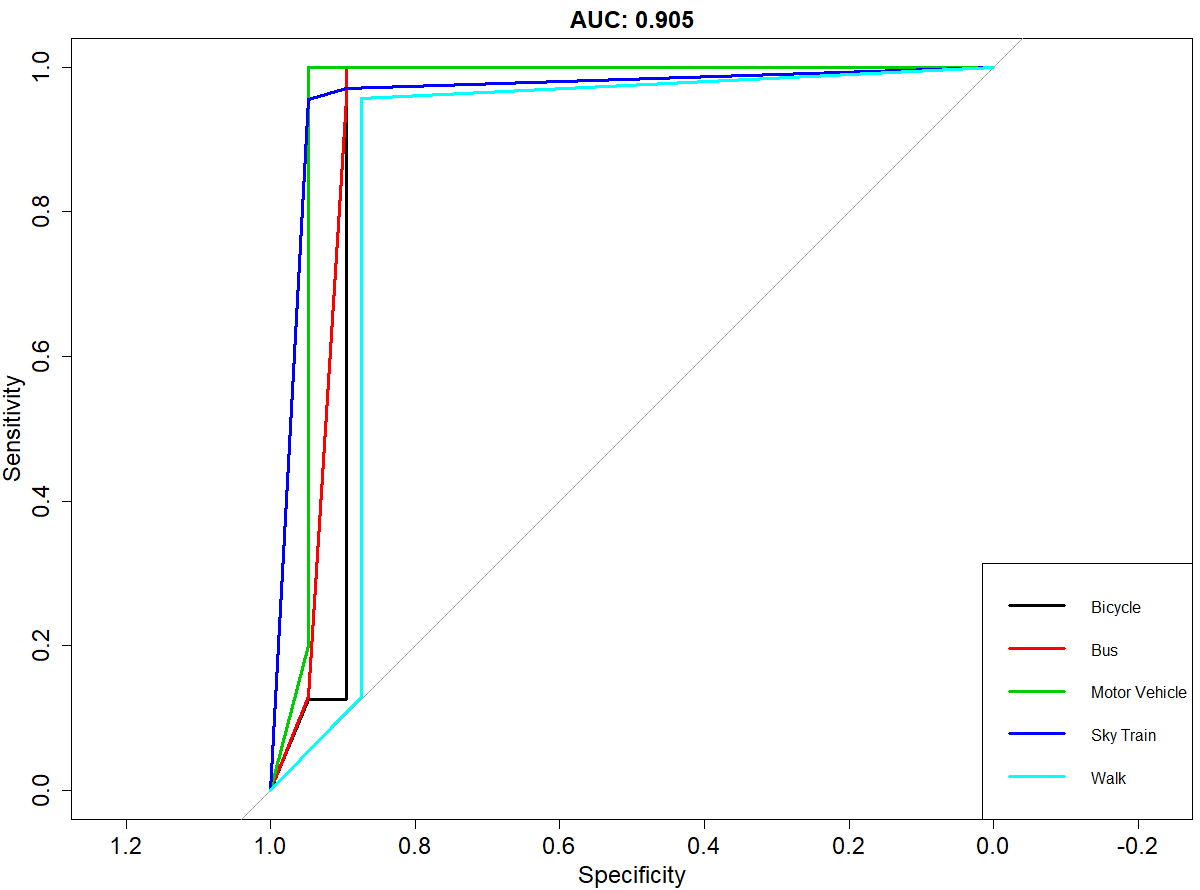
The best model fit with 90.9% accuracy was obtained by combining both GPS and accelerometer data with a 7s window. The overall AUC score was 0.905 (Figure 2) for all 5 classes combined. The maximum accuracy (95% CI) of the SVM classifier in the 7s window when we fit combined features showed an improvement by nearly 9.5% from only GPS and 30.1% from only accelerometer features respectively.

Figure 2
Figure 2:ROC curve showing sensitivity and specificity across different feature sets for window size of 7s

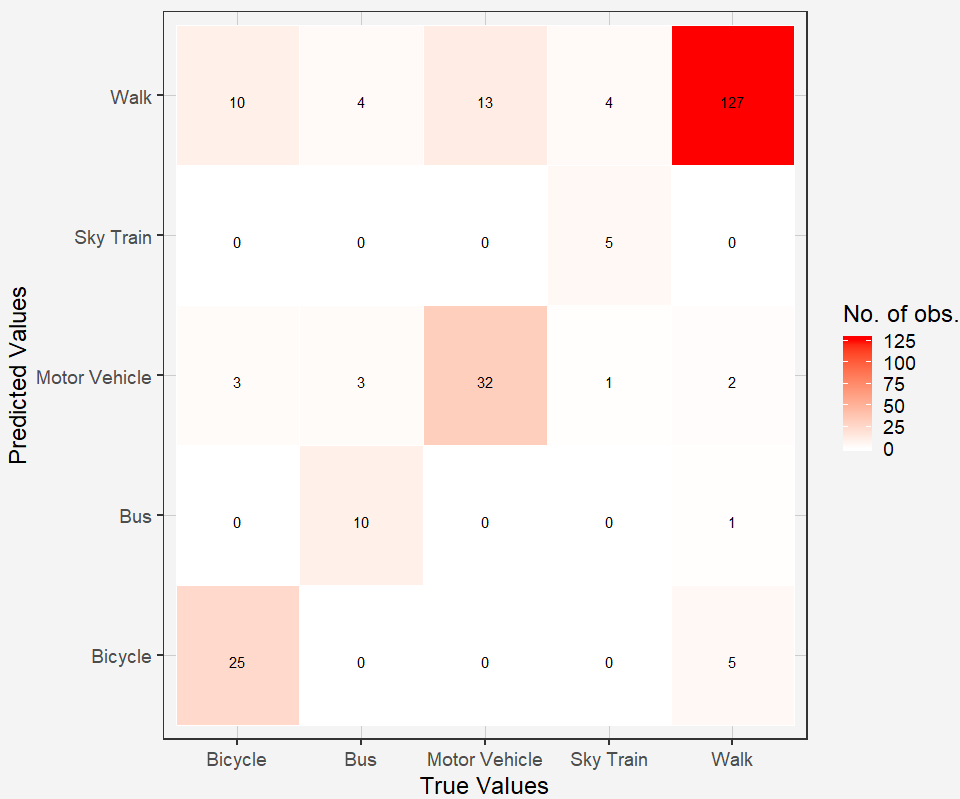
The confusion matrix in Figure 3 shows the classification accuracy of each mode on the 30% testing data. Overall, public transportation modes were most accurately classified (Table 3) followed by bicycling – after accounting for imbalanced data.

Table 3:Prediction accuracy assessment for each transportation mode using both GPS and Accelerometer features of window size 7s
Class Sensitivity Specificity Precision Recall F1 Balanced Accuracy
Bicycle 0.857 0.952 0.774 0.857 0.814 0.905
Bus 0.917 1.000 1.000 0.917 0.957 0.958
Motor Vehicle 0.875 0.993 0.966 0.875 0.918 0.934
Sky Train 1.000 1.000 1.000 1.000 1.000 1.000
Walk 0.927 0.899 0.918 0.927 0.922 0.913
Figure 3
Figure 3:Confusion matrix of all travel modes using test data for GPS and Accelerometer features with window size 7s

Our model is a good approximation of human mobility as per previous studies (Hemminki, Nurmi, and Tarkoma 2013; Widhalm, Nitsche, and Brändie 2012) and would work well with similar populations. Our methods can be used to inform planners about the most preferred travel modes in a city and to understand how modes change with interventions using open reproducible methods for decision making purposes.


Acknowledgments

The authors would like to thank INTERACT team for providing valuable feedback and supporting the work. The study is supported by a grant #IP2-1507071C from the Canadian Institutes of Health Research. This study was approved by the Memorial University Interdisciplinary Committee on Ethics in Human Research (20180188-EX).

References

Altman, D.G., and J.M. Bland. 1994. “Statistics Notes: Diagnostic Tests 1: Sensitivity and Specificity.” British Medical Journal 308 (6943): 1552. https:/​/​doi.org/​10.1136/​bmj.308.6943.1552.
Google ScholarPubMed CentralPubMed
Anguita, Davide, Alessandro Ghio, Luca Oneto, Xavier Parra, and Jorge L. Reyes-Ortiz. 2012. “Human Activity Recognition on Smartphones Using a Multiclass Hardware-Friendly Support Vector Machine.” In International Workshop on Ambient Assisted Living, 216–23. Berlin, Heidelberg: Springer Berlin Heidelberg. https:/​/​doi.org/​10.1007/​978-3-642-35395-6_30.
Google Scholar
Bricka, Stacey, and Chandra R. Bhat. 2006. “Comparative Analysis of Global Positioning System-Based and Travel Survey-Based Data.” Transportation Research Record: Journal of the Transportation Research Board 1972 (1): 9–20. https:/​/​doi.org/​10.1177/​0361198106197200102.
Google Scholar
Chawla, N. V., K. W. Bowyer, L. O. Hall, and W. P. Kegelmeyer. 2002. “SMOTE: Synthetic Minority Over-Sampling Technique.” Journal of Artificial Intelligence Research 16 (June):321–57. https:/​/​doi.org/​10.1613/​jair.953.
Google Scholar
Cortes, Corinna, and Vladimir Vapnik. 1995. “Support-Vector Networks.” Machine Learning 20 (3): 273–97. https:/​/​doi.org/​10.1007/​bf00994018.
Google Scholar
Ellis, Katherine, Suneeta Godbole, Simon Marshall, Gert Lanckriet, John Staudenmayer, and Jacqueline Kerr. 2014. “Identifying Active Travel Behaviors in Challenging Environments Using GPS, Accelerometers, and Machine Learning Algorithms.” Frontiers in Public Health 2 (April):36. https:/​/​doi.org/​10.3389/​fpubh.2014.00036.
Google ScholarPubMed CentralPubMed
Feng, Tao, and Harry J.P. Timmermans. 2013. “Transportation Mode Recognition Using GPS and Accelerometer Data.” Transportation Research Part C: Emerging Technologies 37 (December):118–30. https:/​/​doi.org/​10.1016/​j.trc.2013.09.014.
Google Scholar
“GENEActiv Accelerometer Device.” 2020. https:/​/​www.activinsights.com/​products/​geneactiv/​.
Hamel, L.H. 2011. Knowledge Discovery with Support Vector Machines. Vol. 3. John Wiley & Sons.
Google Scholar
Hand, D.J., and R.J. Till. 2001. “A Simple Generalisation of the Area under the ROC Curve for Multiple Class Classification Problems.” Machine Learning 45 (2): 171–86.
Google Scholar
Hemminki, Samuli, Petteri Nurmi, and Sasu Tarkoma. 2013. “Accelerometer-Based Transportation Mode Detection on Smartphones.” In Proceedings of the 11th ACM Conference on Embedded Networked Sensor Systems - SenSys ’13, 1–14. ACM Press. https:/​/​doi.org/​10.1145/​2517351.2517367.
Google Scholar
Jahangiri, A., and H. Rakha. 2014. “Developing a Support Vector Machine (SVM) Classifier for Transportation Mode Identification by Using Mobile Phone Sensor Data.” In Transportation Research Board 93rd Annual Meeting, 14:1442.
Google Scholar
Li, Cheng-Hsuan, Bor-Chen Kuo, Chin-Teng Lin, and Chih-Sheng Huang. 2011. “A Spatial-Contextual Support Vector Machine for Remotely Sensed Image Classification.” IEEE Transactions on Geoscience and Remote Sensing 50 (3): 784–99. https:/​/​doi.org/​10.1109/​tgrs.2011.2162246.
Google Scholar
Patterson, Zachary, Kyle Fitzsimmons, Stewart Jackson, and Takeshi Mukai. 2019. “Itinerum: The Open Smartphone Travel Survey Platform.” SoftwareX 10 (July):100230. https:/​/​doi.org/​10.1016/​j.softx.2019.04.002.
Google Scholar
Reddy, Sasank, Min Mun, Jeff Burke, Deborah Estrin, Mark Hansen, and Mani Srivastava. 2010. “Using Mobile Phones to Determine Transportation Modes.” ACM Transactions on Sensor Networks 6 (2): 1–27. https:/​/​doi.org/​10.1145/​1689239.1689243.
Google Scholar
Stenneth, Leon, Ouri Wolfson, Philip S. Yu, and Bo Xu. 2011. “Transportation Mode Detection Using Mobile Phones and GIS Information.” In Proceedings of the 19th ACM SIGSPATIAL International Conference on Advances in Geographic Information Systems - GIS ’11, 54–63. ACM Press. https:/​/​doi.org/​10.1145/​2093973.2093982.
Google Scholar
Stopher, Peter, Camden FitzGerald, and Jun Zhang. 2008. “Search for a Global Positioning System Device to Measure Person Travel.” Transportation Research Part C: Emerging Technologies 16 (3): 350–69. https:/​/​doi.org/​10.1016/​j.trc.2007.10.002.
Google Scholar
Velez, D.R. et al. 2008. “A Balanced Accuracy Function for Epistasis Modeling in Imbalanced Datasets Using Multifactor Dimensionality Reduction.” Genetic Epidemiology 4:306.
Google Scholar
Widhalm, P., P. Nitsche, and N. Brändie. 2012. “Transport Mode Detection with Realistic Smartphone Sensor Data.” In Proceedings of the 21st International Conference on Pattern Recognition (ICPR2012), 573–76. IEEE.
Google Scholar
Wu, T.F., C.J. Lin, and R.C. Weng. 2004. “Probability Estimates for Multi-Class Classification by Pairwise Coupling.” Journal of Machine Learning Research 5 (Aug): 975–1005.
Google Scholar
Yang, Xue, Kathleen Stewart, Luliang Tang, Zhong Xie, and Qingquan Li. 2018. “A Review of GPS Trajectories Classification Based on Transportation Mode.” Sensors 18 (11): 3741. https:/​/​doi.org/​10.3390/​s18113741.
Google ScholarPubMed CentralPubMed
Zhou, Huiyu, and Huosheng Hu. 2008. “Human Motion Tracking for Rehabilitation-A Survey.” Biomedical Signal Processing and Control 3 (1): 1–18. https:/​/​doi.org/​10.1016/​j.bspc.2007.09.001.
Google Scholar

This website uses cookies

We use cookies to enhance your experience and support COUNTER Metrics for transparent reporting of readership statistics. Cookie data is not sold to third parties or used for marketing purposes.

Powered by Scholastica, the modern academic journal management system