


1. Questions
Proximity is often treated as an objective, measurable concept based on distance (Torre and Gallaud 2022). In reality, proximity is deeply subjective and shaped by factors such as time, cost, experience, culture, and physical exertion (Larsen and Guiver 2013; Loukopoulos and Gärling 2005). As a result, perceived proximity varies across individuals and affects their travel mode choices (Hernández and Witter 2015; Hess 2012). While understanding proximity perceptions is crucial for effective transport planning, little attention has been given to how people perceive distance in relation to construction sites of major public transport infrastructure. To address this gap, we use survey data from residents who reported their perception on whether they were “near” the construction of the Réseau Express Métropolitain (REM) light rail, linking downtown Montreal with various suburbs and the airport. This research explores the questions: (1) At what distance do people perceive being close to the REM construction from their home, work, or school? (2) How do sociodemographic characteristics and travel mode use patterns affect proximity perceptions?
2. Methods
This study uses data from the third wave of the Montreal Mobility Survey (MMS), a bilingual survey that collected data from 4,065 participants in Fall 2022 about their travel behavior and opinions on major transport projects in the region (Negm et al. 2023). At the time, construction of Montreal’s new 67-km light rail had been underway for four years and was in an advanced stage. To better understand the impacts of this construction, complete answers that passed the thorough cleaning process described in Negm et al. (2023) were retained for analysis.
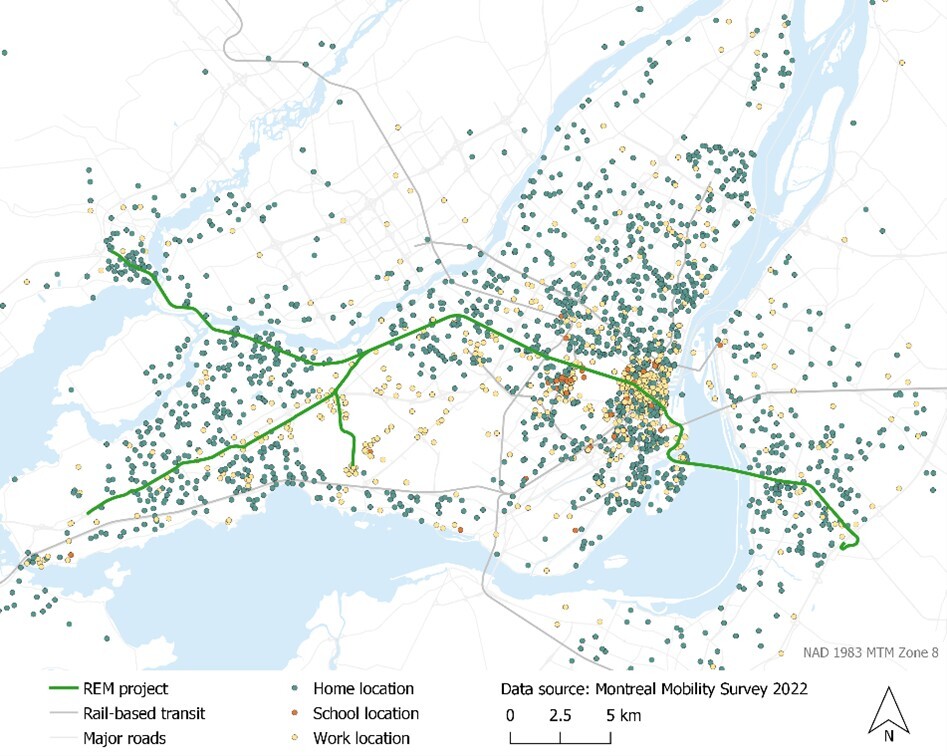
Our analysis follows a two-step methodology to address the study’s research questions. To identify at what distances people perceive being close, the first step consists in modeling the decay of proximity perception with objective distance. For this purpose, we specifically analyzed home, work, and school locations where respondents reported the status of the REM’s construction as complete, underway, or starting in the future nearby (N = 2,819). We calculated the distance between these locations and the project’s construction site using Montreal’s road network. For each home, work, or school location in Figure 1, we computed the shortest travel path to the REM line using the “dodgr” package in R described by Padgham (2019).
Using these distances, we constructed a complementary cumulative distribution function (CCDF) from normalized counts of respondents who reported being close to the REM construction. We grouped distances into 100 m bins from 0 to 35 km. We calculated and normalized the number of respondents located beyond each distance, generating curves resembling negative exponential decays where the proportion of respondents decreases as distance increases.
Next, we fit negative exponential decay functions to the CCDF curves using nonlinear least squares (NLS). The produced decay functions take the form: 𝑦 = 𝛼𝑒−𝛽𝑥, where 𝑦 is the normalized respondents beyond a given distance, 𝑥 is the distance from the REM (in meters), 𝛼 is the scaling parameter (typically approaching 1), and 𝛽 is the decay rate. The parameter 𝛽 quantifies how rapidly perception of proximity to the REM diminishes with distance. We compared 95% confidence intervals for 𝛽 to assess whether decay rates differed significantly across groups.
The second methodological step addresses how sociodemographic factors and mode-use patterns affect proximity perceptions. For this purpose, we estimated a set of two binomial logit models using the generalized linear model function (glm) in R. These models estimate the probability of perceiving closeness to the REM as a function of distance, predominant mode, and sociodemographic characteristics such as age, gender, and income. The two models respectively evaluate proximity perception to the REM from home and work/school location.
3. Findings
We first examined the relationship between location type and respondents’ perception of proximity to REM construction sites. Those who reported being near the construction at work or school (N = 927) were located at a shorter distance from the REM than those who perceived nearness at home (N = 1,892) – see Figure 2. The median distance for perceived proximity at work or school (850 m) is less than half the distance observed for home locations (2.3 km). This finding is likely due to individuals engaging in more localized areas around their workplaces or schools, while interactions around the home extend over broader space. Construction disruptions may therefore be perceived differently across various daily activity locations.
_and_work_o.jpg)
We studied how the respondents define being near the REM’s construction based on their mode-use patterns. Figure 3 shows that predominant travel mode (> 50% of weekly trips) influences proximity perceptions. The majority of respondents were classified as multimodal (N = 1,730), meaning no single mode accounted for over half of their trips in a week. Proximity perceptions were significantly shorter for respondents who predominantly use public transport or active modes (N = 373) compared to those who predominantly drive (N = 699) or are multimodal.
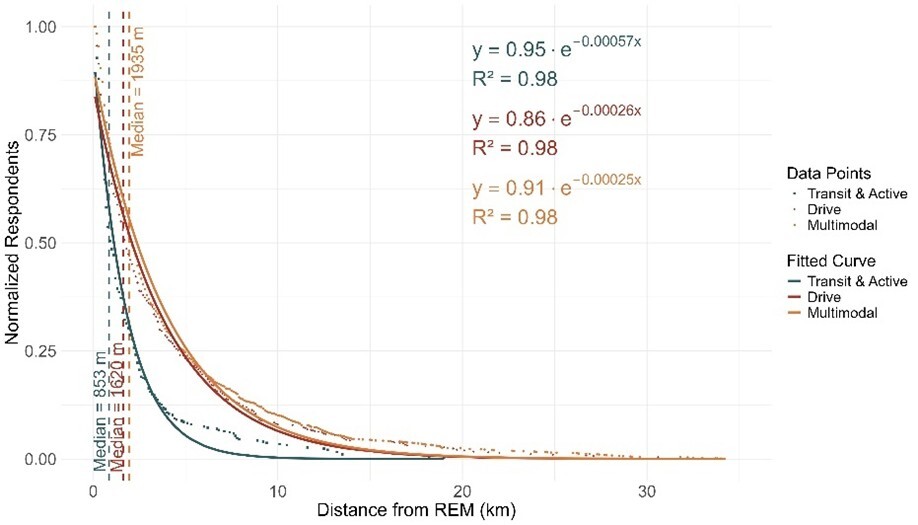
The median distance at which closeness to REM construction was perceived for active mode and transit users was of 850 m compared to 1.6 km and 1.9 km for drivers and multimodal users. This highlights that transit and active travelers may be more sensitive to spatial gaps due to longer travel times or greater physical effort, while people who drive can cover long distances quickly and more effortlessly making them perceive closeness at further distances. Overall, mode-use patterns appear to shape individuals’ perceptions of public transport infrastructure construction proximity.
The results of the logit models are presented in Table 1. As expected, the odds of perceiving proximity decreases as distance from the REM increases. The decline in odds is steeper for work or school locations (14% per km) than for home locations (9% per km). This confirms the findings seen in the CCDF (Figure 1), again indicating higher spatial sensitivity at work or school locations.
We found other variables also had a significant effect on proximity perception. First, older adults and higher-income individuals are approximately twice as likely to perceive being near the REM at home, ceteris paribus. Women, on the other hand, have consistently lower odds of perceiving proximity to the REM, both at home (30% less) and at work (38% less). In contrast, active travelers and transit users are 56% and 41% less likely to report living near the REM at home, when keeping all else constant. At work or school, active travelers also show a 39% lower likelihood of perceiving proximity. These results likely reflect the heightened awareness of distance among active travelers, for whom separation translates directly into additional time and effort.
Most respondents in our survey who perceived closeness to the REM were located within 2.3 km of the project’s construction sites, with proximity perceptions declining quickly beyond. Our findings show that sense of proximity varies by activity location (home, work, or school) and is shaped by respondents’ sociodemographic characteristics, as well as by their mode-use patterns. Therefore, communication and mitigation strategies should account not only for surrounding land use, but also for people’s travel patterns and the context in which they experience proximity. For example, public outreach efforts might need to extend further in residential or car-oriented neighborhoods and be more focused around employment centers or areas dominated by the use of public transit and active modes. These results can lead to more effective mitigation measures in the construction of major public transport projects by helping define how proximity to construction sites is perceived.
Finally, while this study treats the REM as a single entity and focuses exclusively on proximity, construction impacts may vary across segments of the project. This may reflect different factors such as increased noise, travel times, and safety concerns. Disaggregating these effects represents a valuable avenue for future research.
Acknowledgements
This research was funded by the Collaborative Health Research Projects Grant (CIHR PJT-195797) of the Canadian Institutes of Health Research (CIHR).