
1. Questions
This study examines how the COVID-19 pandemic influenced motor vehicle crash injury severity among drivers in California, with a focus on differences across demographic groups. We ask whether the pandemic increased the likelihood of injury crashes and whether the effects varied by driver age, race, and sex. We also explore whether combinations of these demographic factors resulted in greater vulnerability to severe crash outcomes during the pandemic.
We hypothesize that the pandemic increased the overall likelihood of injury crashes compared to pre-pandemic conditions. We further hypothesize that young drivers and Black drivers were disproportionately impacted, experiencing higher odds of severe crash outcomes during the pandemic. Finally, we expect that interactions between demographic characteristics and the pandemic contributed to inequitable safety outcomes during this period.
2. Methods
This study used crash data sourced from the California Highway Patrol’s Statewide Integrated Traffic Records System, covering the period from January 2019 to April 2021 (Transportation Injury Mapping System (TIMS) 2021). The records before March 2020 were classified as “pre-pandemic” and records from March 2020 to April 2021 were classified as “pandemic.” Only drivers, who constitute 89% of the total records, were analyzed. Race and ethnicity were modeled using the categories white, Black, Hispanic, Asian, and Others. According to California Census data for 2021, the population of white, Black, Hispanic, and Asian were approximately 36.5%, 6.5%, 39.4%, and 15.5% respectively. In our crash data, the percentages are 32.7%, 10.1%, 42.3%, and 7.8% respectively. The overrepresentation of the Black and Hispanic driver population can be observed in the dataset which is consistent with previous literature (Gkritza et al. 2010). The records with missing or unknown data for driver sex, driver age, and driver race were excluded from analysis. Only drivers aged 18 to 97 years old were included in this study. Drivers aged less than 18 were considered as an outlier as there are different rules for driving for this age group (i.e., provisional licenses). Drivers older than 97 years were also omitted due to a small number of records outside this age range. Crash injury severity was divided into two main categories: “Injury” and “No injury.” Fatal, severe injury, other visible injury, and complaints of pain cases were defined as “Injury.” “No injury” was defined for property damage only cases. Notably, crashes from March 2020 accounted for only 3.7% of the total pandemic-period crashes, suggesting that whether or not this transition month is included would have little effect on the substance of the results. The final dataset consisted of 1,413,661 cases.
Binary logistic regression models were developed to assess the impact of driver demographic characteristics on crash injury severity during the pandemic. Interaction terms were incorporated to determine the effect of the pandemic on other independent variables. The marginal probability and confidence interval were used to quantify the main effects and interaction effects of significant independent variables on the dependent variable.
3. Findings
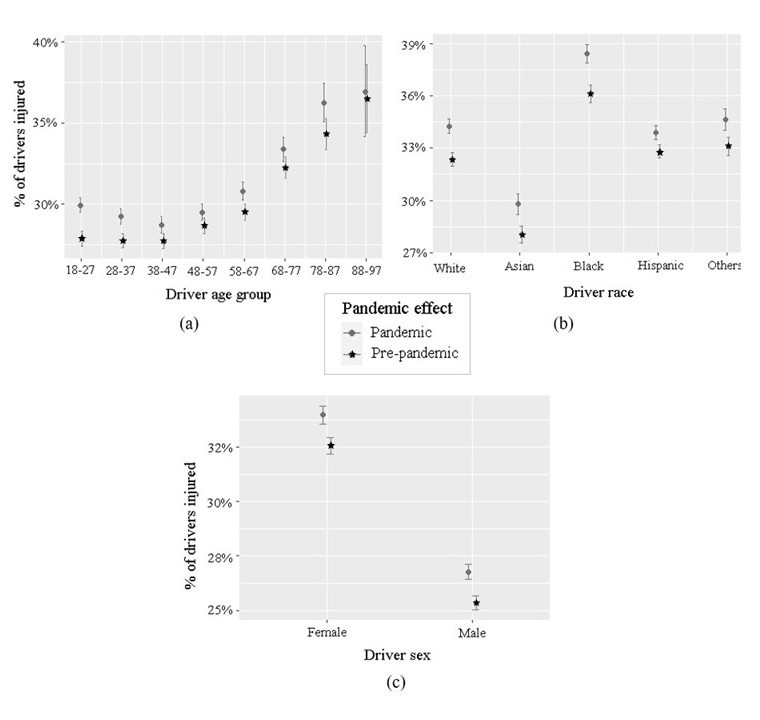
The analysis revealed that the pandemic was associated with an increased probability of injury crashes in California. Across all demographic groups, the likelihood of injury crashes was higher during the pandemic compared to pre-pandemic conditions. Figure 1 presents the marginal probability and the 95% confidence interval of crash injury severity for different driver age groups, races, sexes, and pandemic effects.
_driver_a.jpg)
During the pandemic, all age groups showed a higher likelihood of experiencing severe crash injuries, with young drivers, aged 18-27, exhibiting a 2.3% increase and those aged 28-37 a 1.7% increase.
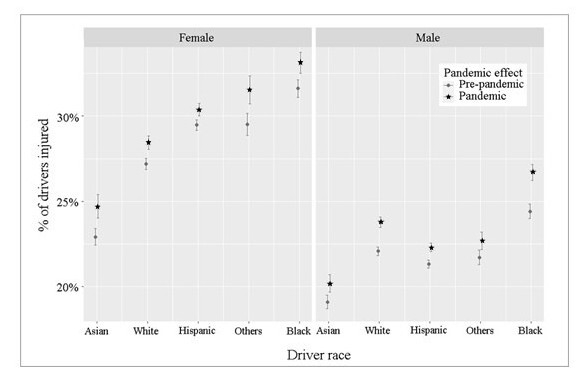
In terms of race, Black drivers had the highest probability of injury crashes both before and during the pandemic. The probability of injury crashes among Black drivers increased by 1.8 percentage points for females and 2.6 percentage points for males during the pandemic, larger than the increases observed in other racial groups, as presented in Table 1. This can also be observed in Figure 2.
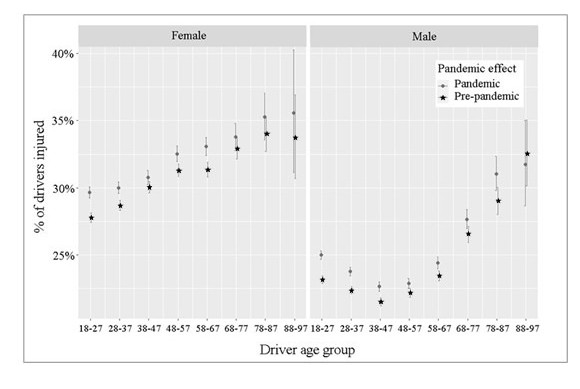
The interaction among driver sex, driver age group, and the pandemic effect was found to be significant at the 95% confidence level. As shown in Figure 3, an upward pattern can be seen in female drivers’ crash injury severity with increasing age, while for males, middle-aged male drivers were less likely to experience injury crashes compared to other age groups. Considering the effect of the pandemic on these groups, middle-aged female drivers from ages 48-67 were found to experience higher odds of crash injury severity compared to similar-aged male drivers. This finding may be confounded considering female drivers are more likely to have worse injury outcomes in the same crash conditions as male drivers (Ryan et al. 2022).

Acknowledgments
The assistance of the California Highway Patrol is acknowledged for providing the data.