1. Questions
Which federally subsidized affordable housing properties are most likely to be lost to market-rate conversion? Current preservation practice relies on reactive watchlists that flag contract expirations but fail to diagnose the underlying economic and demographic drivers of conversion risk. We address two research questions:
-
Can we create a quantitative, replicable metric that diagnoses conversion risk by capturing both the financial motive of owners and the market opportunity to exit PBRA contracts?
-
Do these risks reveal distinct, policy-relevant patterns across communities, particularly in relation to race, poverty, and gentrification?
We hypothesize that conversion risk is jointly determined by an owner’s financial incentive (rent gap) and the market context that makes exit feasible (low vacancy and high cost burden). This theoretical framework draws from gentrification theory, where Smith (1979) established that both financial motive and market opportunity are necessary conditions for property conversion. Finkel and Buron (2008) empirically demonstrated that owners weigh both financial incentives and market conditions equally when making opt-out decisions, while Hendrick and Zielenbach’s (2021) analysis of PBRA exits confirmed that both rent differentials and local market tightness independently predict opt-out probability. We further hypothesize that at-risk neighborhoods cluster into distinct, empirically measurable groups rather than forming a uniform risk spectrum.
2. Methods
We developed a Vulnerability Score, a composite index calculated at the census tract level. Our method integrates property-level subsidy data for all PBRA contracts expiring between June 2025 and June 2035 (National Housing Preservation Database, NHPD) with neighborhood-level data from the 2018–2022 American Community Survey (ACS). The score for each tract is constructed in three steps:
-
Financial Incentive Score (Motive): We calculate the Rent Gap as the difference between ACS median gross rent and unit-weighted average subsidized rent : Rt=max
-
Market Pressure Score (Opportunity): We quantify opportunity using the rental vacancy rate inverted) and percentage of cost-burdened renters Each is min–max normalized, then averaged: P_t = 0.5 \times (1 - N(V_t)) + 0.5 \times N(C_t)
-
Final Vulnerability Score: We combine normalized components with equal weighting: Score_t = 0.5 \times N(R_t) + 0.5 \times P_t
The 50/50 weighting follows Finkel and Buron’s (2008) empirical finding that owners weight financial incentives and market conditions equally in opt-out decisions, and Reina’s (2018) theoretical framework establishing both as necessary preconditions for market-driven conversion. We analyzed 2,805 tracts, segmented into terciles representing three risk tiers: Low Risk, Medium Risk, and High Risk. We used one-way ANOVA to validate that these represent statistically distinct groups rather than arbitrary points on a spectrum. We also conducted sensitivity analysis using alternative weightings (70/30 and 30/70) to test robustness.
To contextualize these risk tiers and understand their policy implications, we profiled them using key demographic and ownership variables. We selected Poverty Rate, Percent Non-White, and Percent Renter Occupied from the ACS because these variables capture the socio-demographic characteristics most associated with displacement vulnerability in prior research (Zuk et al. 2018; Newman and Wyly 2006). We also analyzed the share of PBRA-assisted units in each tract held by for-profit owners (“Percent For-Profit Units”) from the NHPD, as for-profit ownership has been consistently linked to higher opt-out rates (Finkel and Buron 2008). These variables allow us to move beyond purely economic diagnosis and evaluate which populations face disproportionate exposure to potential housing instability.
3. Findings
Three Statistically Distinct Risk Tiers
Our analysis confirms three statistically distinct risk tiers with systematically different profiles. As shown in Table 1, the average rent gap increases thirteen-fold from $21 in Low Risk tracts to $282 in High Risk areas, while vacancy rates decline and renter cost burden rises. For-profit ownership concentration peaks in Medium Risk tracts (82.2%), where poverty rates are also highest (20.3%).
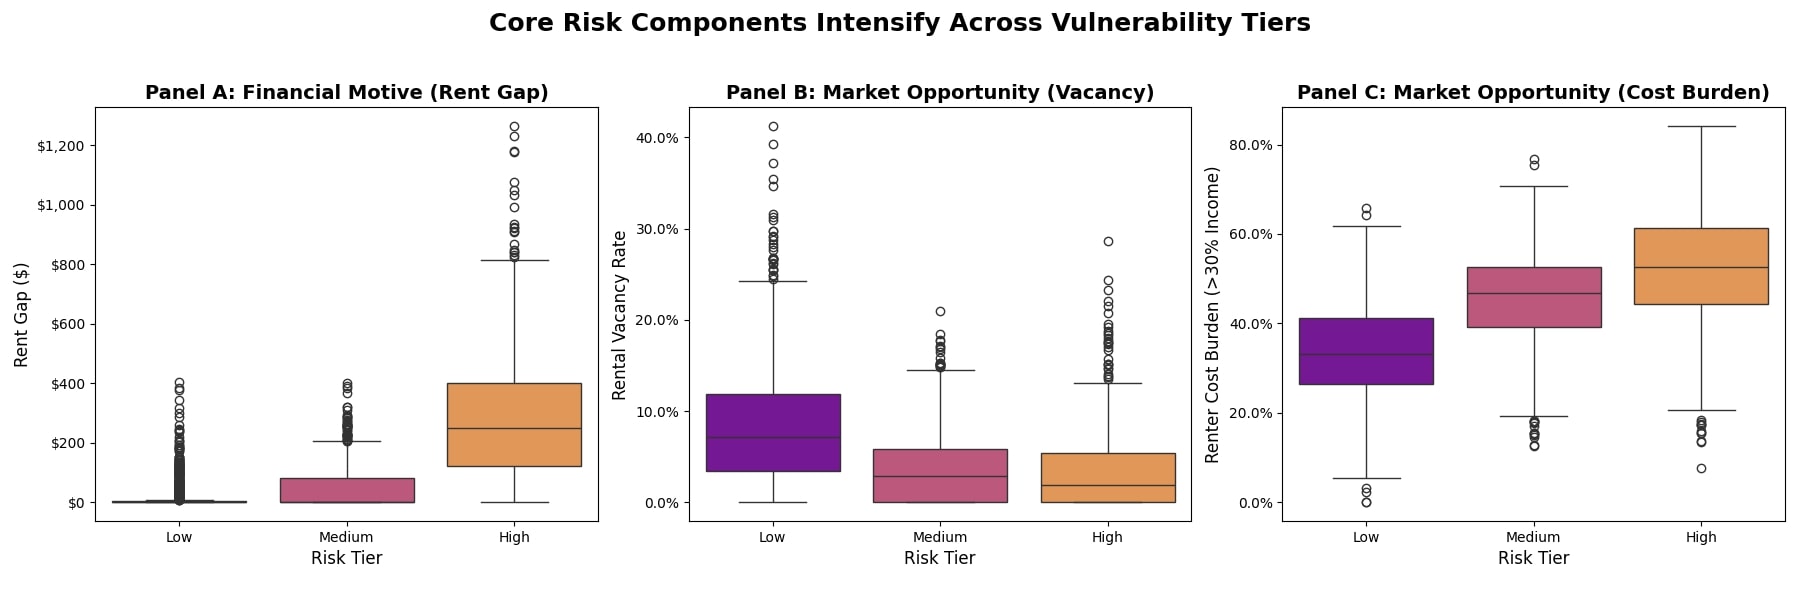
Figure 1 demonstrates that each risk component escalates systematically across tiers, validating our theoretical framework. Rent gaps (Panel A) remain negligible in Low Risk tracts but rise sharply in High Risk areas, indicating strong financial incentives for conversion. Vacancy rates (Panel B) decline steadily from Low to High Risk, signaling increasingly tight housing markets that create both market opportunity for owners and limited alternatives for displaced residents. Cost burden (Panel C) rises in parallel, reflecting intensifying affordability pressures. This joint escalation illustrates how motive and opportunity interact synergistically rather than operating independently, supporting our hypothesis that conversion risk intensifies through the combined effect of both forces.
.jpg)
The observed patterns reflect neighborhoods experiencing market-level gentrification pressures in the broader housing stock surrounding PBRA properties, not displacement from the subsidized units themselves (which remain occupied under current contracts). As neighborhoods gentrify, rising property values and market rents create the large rent gaps and tight market conditions that make future PBRA conversion both financially attractive and feasible once contracts expire. This process of neighborhood change establishes the preconditions for conversion risk before any actual displacement from PBRA properties occurs.
Regional Variation in Risk Drivers
Risk drivers vary significantly across regions, revealing two distinct pathways to vulnerability. Table 2 shows how states can be classified based on whether financial motive or market opportunity is the primary driver. We classify states as “Financial Motive” driven when rent gaps exceed $100 and vacancy rates remain above 4%, indicating strong profit incentives in moderately tight markets. States are classified as “Market Opportunity” driven when vacancy rates fall below 3% regardless of rent gap size, indicating extremely constrained markets where even modest financial incentives become viable. States with intermediate values on both dimensions are classified as “Mixed.”
For example, California exhibits motive-heavy risk (rent gap $133, vacancy 5.1%), where large profit margins drive conversion pressure despite moderate market tightness. Massachusetts illustrates opportunity-driven risk (rent gap $14, vacancy 2.8%), where extreme market constraints make conversion viable even with modest financial incentives. These distinct pathways demonstrate why expiration-date-only approaches miss critical risk variation.
Model Robustness and Geographic Concentration
Sensitivity analysis using alternative weightings (70% financial / 30% market pressure vs. 30% financial / 70% market pressure) produced a Jaccard similarity score of 0.51, indicating moderate robustness. We compare the top decile of tracts under each weighting scheme (280 tracts 10% of 2,805). Table 3 shows that 188 of the top 280 high-risk tracts (67%) are consistently identified across weightings, with 92 tracts unique to each scenario. This demonstrates the model’s utility as a diagnostic tool capable of highlighting different risk profiles based on whether financial incentives or market pressures are the primary driver.
Risk is geographically concentrated in places dominated by large metropolitan areas. To avoid ambiguity, we define “at-risk units” as PBRA-assisted units from the NHPD that are located in High Risk tracts. Summed to the state level, New York (23,557 at-risk units), California (12,793), and Ohio (12,373) lead in absolute counts. In contrast, rural areas, where vacancy rates are typically higher and market rents lower, predominantly fall into the Low Risk category.
Data Availability
The PBRA analysis dataset is available at Zenodo: https://zenodo.org/records/16907864 (restricted; access may be provided upon request). All analysis code is openly available at GitHub: https://github.com/Nischal1011/PBRA_Analysis/tree/main.