
1. Question
Despite ongoing interest in sustainable school travel, prevailing research often overlooks the nuanced heterogeneity embedded in everyday mobility. By aggregating across school types, grade levels, and commute directions, the diversity of travel behaviours is regularly flattened into overly simplistic patterns (for examples see Ji et al. 2022). This paper challenges that tendency by unpacking variations in school travel through the lens of the educational sector. Our key research question is: How do commuting modes and distances differ between public and private school students?
Our interest is inspired by marked shifts in the spatial distribution and governance of schools across multiple contexts (Chmielewski 2019), particularly growing flexibility in school selection and increased diversity in school types. Reflecting this trend, enrolments in private schools have grown. This is most notable in our case study context of Australia, where only 63% of children attend public schools (Australian Bureau of Statistics 2024) - less than in any other OECD nation (OECD 2023).
These shifts challenge the traditional assumption that children attend schools close to home and have obvious consequences for school travel patterns. In Australia, public school students are generally expected to enrol at their local school, with “out of area” placements permitted only under specific conditions, or for attendance at schools with an academic or other specialisation. By contrast, private schools typically place minimal emphasis on residential proximity when accepting enrolments. As a result, students attending private schools are likely to travel longer distances than their public school counterparts – for school, extra-curricular activities, and social interaction with the friends they make while learning.
The changing geography of schooling has received some attention in transport research, albeit far less than the intense focus on children’s school travel generally. Of relevance to Australia, Yan et al. (2022) found that private school students in Southeast Queensland are significantly less likely to walk or cycle to school than public school students—reporting that 7.4% of private school students used active transport compared to 16.9% of public school students. In this paper, we build on Yan et al. (2022), using more comprehensive and refined data on school travel across Australia.
2. Method
Data for this study were collected in May 2025 through a national survey administered by a professional survey panel company, targeting over 5000 Australian families. The survey – known as the Australian School Travel Survey - focused on school travel patterns and travel for extracurricular activities, using parental accounts to capture detailed information on school and home location, mode choice across a specific week, and distance between home and school. The sample was designed to be representative of the Australian population based on household income and distribution across urban, regional, and remote areas, enabling robust analysis of travel behaviours across diverse geographic and socio-economic contexts.
In this paper, we report descriptive statistics of school travel mode for 6517 students, representing 66,424 trips to and from school across five days. We also report estimations of distance between school and home, based on a question asking parents to estimate this distance by choosing from a series of distance bands (as shown in the results). Results are disaggregated by school sector and aggregated by mode, with walking, cycling and scooter trips all classed as “active”, all public transport modes classed as “PT” and school buses, whether publicly or privately provided[1], classed as “school bus”. We include data only from students attending their government designated local school (“public”) or a private school – defined as a non-centrally governed educational institution that receives funding primarily from tuition fees and private sources (“private”). This distinction is relevant in that it removes potential bias introduced by students enrolled in public schools designated to be outside of their local catchment, recognising that, by definition, these students’ trips are likely to be longer and less accessible using active modes (17.3% of students in our original sample fall into this category). We also removed a small number of students who were home-schooled, and students who attended specialist schools or who did not attend school the week they were surveyed. From the remaining sample of 6517 students included in this analysis, 26.6% of primary and 35.2% of secondary students attended private schools.
3. Findings
How do commuting modes differ between public and private school students?
Figure 1 reveals clear distinctions in school travel modes between private and public-school students which echo through child ages and stages.

Car travel dominates private school travel in both primary (children aged ~5-12) and secondary school (~13-18). In primary school, 75% of private school commutes are by car, compared to 62% of students attending public schools. In high-school, car mode share for both public and private school travel decreases by approximately 20%, and public transit and school bus modes increase significantly. Interestingly, the figures for active transport remain relatively static from primary to high-school. Around 12% of children attending private primary and high schools have an active commute, compared to over 30% of public primary and high school students. These findings align with the results of Yan et al. (2022), who also reported higher rates of active school travel among public school children compared to those in private schools. However, the magnitude of difference observed in our study is substantially greater. In our study 18% more public students use active transport than private students, compared to just 9.5% reported in Yan et al. (2022). One possible explanation is our ability to exclude students enrolled in out-of-area public schools, suggesting it is local schooling, not necessarily public schooling, that fosters active school transport.
While a comprehensive analysis of the determinants of these differences is beyond the scope of this Finding, we conclude with reflections on the most obvious and commonly researched shaper of school travel – distance (for example, Mandic et al. 2020).
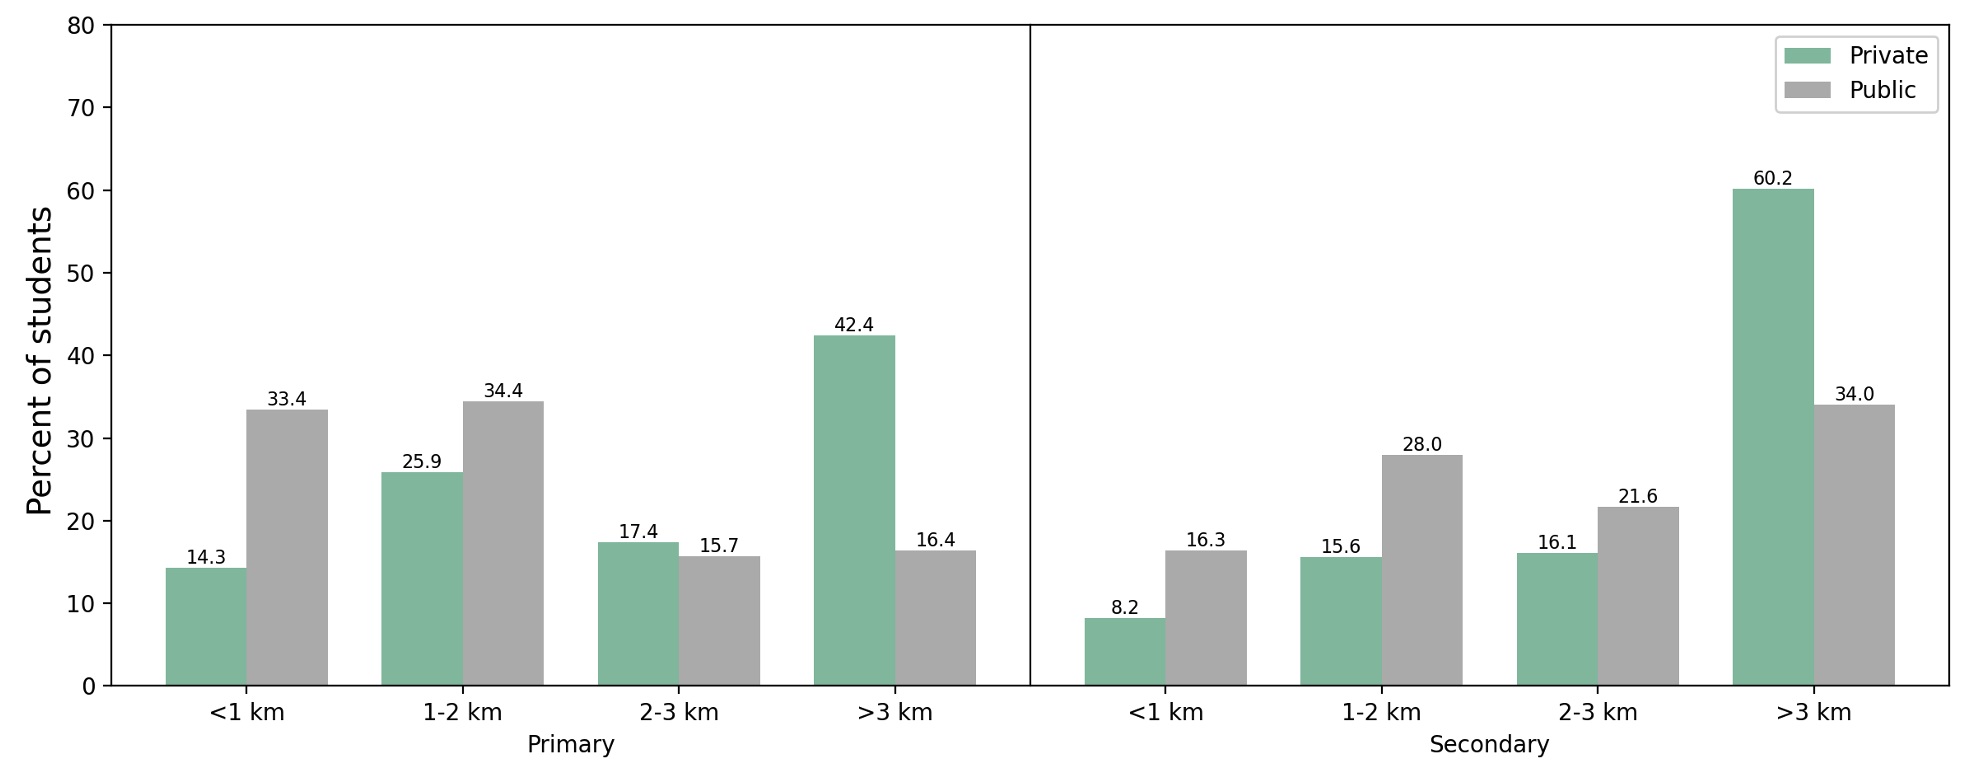
Figure 2 shows the differences in travel distance for private and public-school students at primary and high school stage, demonstrating patterns clearly comparable to mode share in Figure 1 and reaffirming the role of distance as a barrier to AST. More public-school students have travel distances less than 2km, while private school students are approximately twice as likely to live more than 3km from their school.

We used a multinomial logistic regression model to confirm the significance of this finding. Four mutually exclusive dummy variables—primary/public, secondary/public, primary/private, and secondary/private—were defined to classify the sample into distinct groups, with primary/public serving as the reference category in a model predicting the distance categories. The statistically significant coefficients (Table 1) indicate meaningful differences in the distribution of distance categories across the four school groups. This approach confirms the observed distribution of distance categories within each school sector, while formally testing statistical significance. The model’s predicted probabilities for each distance category match the observed distribution reported in Figure 2 to within 0.5 of a percent.
Dedicated school buses are less common in Australia than in, for example, the USA. In urban areas, public school students have access to general public transport, while dedicated school buses are more common in regional and rural settings. Private schools may offer their own bus services, but these are not standardized nationwide.