1. QUESTIONS
Trip Connect is an on-demand transit service launched as a two-year pilot on December 11, 2024 to serve areas that have limited or no fixed transit routes operated by either Iowa City Transit, Coralville Transit, or CAMBUS (transit service run by the University of Iowa) in Johnson County, Iowa. It provides door-to-door service Sunday through Friday from 5 p.m. to 12 a.m. for people traveling for work, education, or childcare in the northern portion of Johnson County for a fee of $2 per trip (Johnson County Social Services 2024). Two Trip Connect vans are operated by NTS Horizons, while the scheduling and routing platform is provided by Via Transportation. Trips can be scheduled using a smartphone application or a phone up to 30 minutes before the desired start time. This study investigates how Trip Connect integrates into Johnson County’s transit ecosystem, seeking to determine the degree to which Trip Connect complements or competes with the existing fixed-route transit network.
2. METHODS
We analyzed anonymized trip records from December 2024 to March 2025, including rider and trip ID, areas of pick-up and drop-off, shared as 1000 by 1000 foot polygons that we converted to centroids, and trip timestamps. Geospatial data for the existing Johnson County fixed route transit network was sourced from the archived General Transit Feed Specification for March 2025. We produced a suite of summary statistics from Trip Connect’s operational data using standard processing techniques. We also mapped Trip Connect’s origins and destinations, associating them with the communities, and creating a 0.25-mile buffer around the stops of the existing fixed-route transit network to represent the walking access to them (Wasfi, Ross, and El-Geneidy 2013).
We used r5py library (Fink et al. 2022) to model all weekday Trip Connect’s trips if they were completed using a fixed-route transit system, imposing a 0.25-mile walking distance limit and a 60-minute cap on the trip length (Alousi-Jones et al. 2025; Mokhtarian and Chen 2004), focusing on the first percentile of estimated trip times. This was assumed for a fair comparison with on-demand service that requires beforehand planning, meaning that fixed-route transit trips would be planned way ahead to align with the service schedule as well. The fixed-route transit trips were modeled for the hours when actual Trip Connect trips occurred.
3. FINDINGS
Our data shows that Trip Connect’s use has been growing, starting with 39 trips in December 2024, and reaching 273 in March 2025, when the combined ridership of the three transit systems in the region was 426,760 (Federal Transit Administration 2025). Out of all completed trips, 81% were work-related, 11% provided connection to education, while childcare with other purposes accounted for the rest. This distribution suggests that the data was unlikely to be impacted by the seasonality of the university schedule. The average occupancy per trip was one passenger, and ridership was almost evenly distributed between the hours and days of operations. A total of 86 unique riders used the service 769 times, with a median of five, and a maximum of 43 trips. When we used the median as a cutoff point to determine frequent riders, the sample went down to 45 riders who completed 679 trips. This suggests that more than half of users relied on it frequently, with a median of 12 trips.
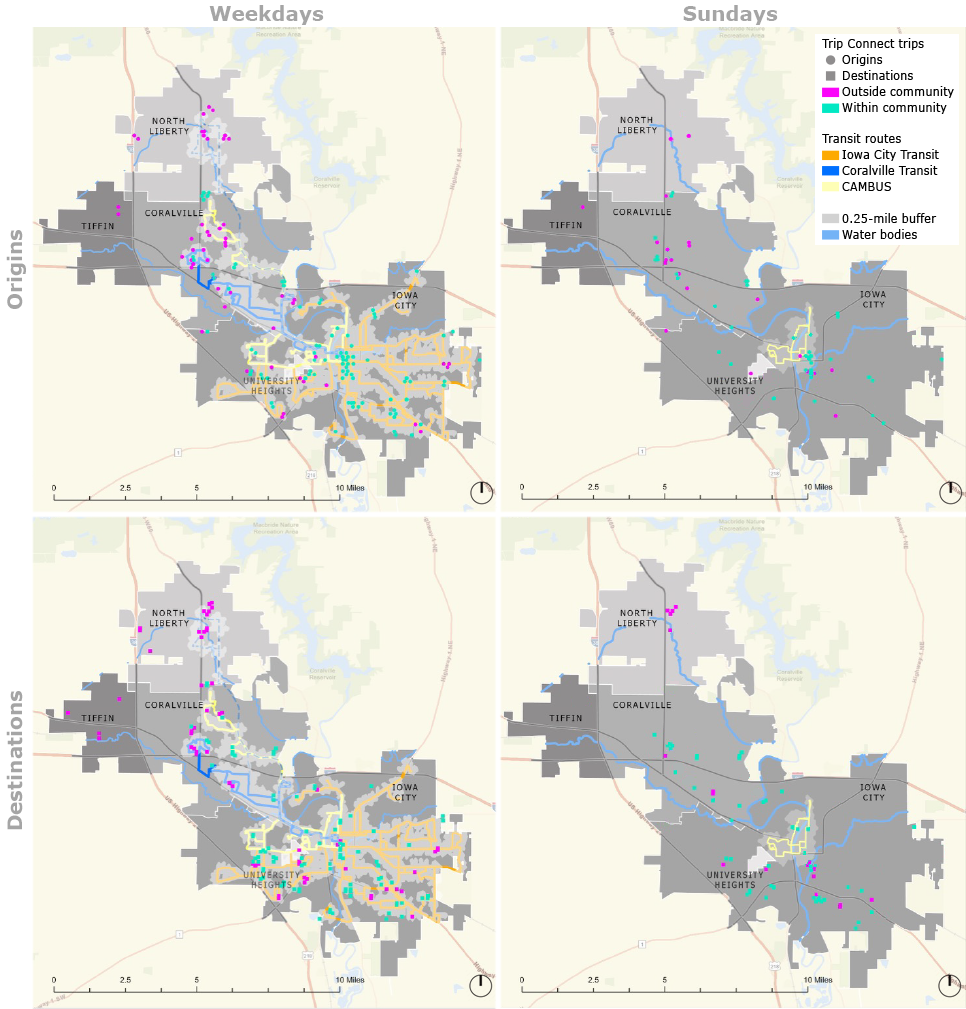
Spatial analysis of the origins and destinations presented in Figure 1 offers additional insights. Evidently, most of the origins and destinations served on a weekday (650 trips) are within the walking distance of fixed-route transit stops. It should be noted that the route from Iowa City to North Liberty visualized with a dashed line is only offered in the early morning, and in the early evening. On the other hand, the 119 Sunday trips shows that Trip Connect bridges an important gap on that day, since only one fixed route operates on that day. Overall, Figure 1 suggests that Trip Connect riders might be transit users who reside within the service area of the existing network, because of a self-selection process.
.png)
We can see the distribution of Trip Connect’s rides within and between the cities in Table 1. Notably, 44.1% of all trips originated and terminated in Iowa City, indicating strong demand within the largest city in the county. In contrast, trips associated with Coralville show a more distributed pattern, with 10.4% of all rides staying within Coralville, 15.3% linking to Iowa City, and 10.8% connecting to North Liberty. Other city-to-city trip volumes are considerably lower. Overall, more than half of all trips (54.5%) took place within the same community where they originated.
Lastly, we modeled fixed-route transit trip times using origins, destinations, and trip start times of actual Trip Connect rides, assuming walking to and from the bus stops of the transit network. As Table 2 suggests, only 16.6% of 650 weekday trips (108 trips) could theoretically have been accommodated by the current fixed-route system. It also illustrates that most of those weekday trips could have been completed only within Iowa City (92 trips, or 32.7% of all weekday trips in Iowa City), which is not surprising, given that the three transit operators’ routes overlap there. Most of those trips, 76.8%, took place between 5 and 9 p.m., though they still account just for 22.6% of all weekday trips at that time.
The comparison of 108 Trip Connect’s and modeled fixed-route transit travel times provides an insight into the question why riders choose on-demand over the fixed-route service. Of those Trip Connect trips, the shortest duration was 2 minutes, while the longest was 23 minutes. On average, Trip Connect rides took about 10 minutes to complete. At the same time, the shortest duration for fixed-route transit trips could have been 8 minutes, while the longest - 57 minutes. On average, fixed-route transit trips would take about 38 minutes to complete, or almost four times longer than using Trip Connect. Table 3 shows that this trend in trip time difference is consistent across most origin-destination pairs. Among those trips, 4.6% (5) required two transfers to reach the destination, and 40% (43) depended on a single transfer between routes. Nevertheless, the average trip times and wait times between those and trips without transfers were not significantly different. This suggests that the main driver of time differences between Trip Connect and the fixed route network is due to fixed routes’ alignment (which is not the shortest path for every unique trip), and time spent at bus stops.
Overall, our analysis suggests that even though it is very likely that Trip Connect’s riders are also users of fixed-route transit, the service provides significant benefits to them. First of all, it dramatically reduces the trip time for its users, and secondly, it allows for transit rides on Sundays and late at night, when most of the fixed-route service is not operational. It is evident that such on-demand service acts as a complement to the existing fixed-route network in northern Johnson County, Iowa.
ACKNOWLEDGMENTS
We appreciate the assistance provided by Johnson County staff and Via Transportation for their cooperation and assistance in this research.
Since Iowa City is listed in the table twice, values do not add to a 100%. Cross-tabulations in the following tables follow the same logic.
% represent the share of trips that could have been completed on the fixed-route network out of the total number of trips for a given origin-destination pair.