

1. QUESTIONS
Transport poverty (TP), a multidimensional phenomenon, refers to the systemic barriers limiting an individual or group from reaching a destination, whether for service availability, infrastructure, resources, time and available destinations, etc. (Lucas et al. 2016). Land use and transport mediate how accessibility to destinations and socio-economic marginalization contribute to TP.
In this context, we ask:
- Are there differences in transport poverty between men and women in Canada?
- Within urban areas, are there clustered areas with high levels of transport poverty, inaccessibility, marginalization, and a high proportion of women (or men)?
2. METHODS
To answer the first question, we assigned a transport poverty index to Dissemination Areas (DA) - the smallest geographic unit of the Canadian census (400-700 inhabitants). This index draws on previous work (see Guerrero-Balarezo et al. (2025)) and integrates two components: a marginalization subindex and an inaccessibility subindex.
Marginalization is a multidimensional phenomenon in which persons or groups are deprived from important socio-political experiences (e.g., control over self-will, access to critical resources, mobility) (Hall and Carlson 2016). Operationally, the marginalization subindex developed by Matheson et al. (2012) (data available here: Matheson et al. (2016)), combines with equal weights four dimensions of socio-economic circumstances (household conditions, material resources, population age, and immigration and visible minorities).
The inaccessibility subindex (Guerrero-Balarezo et al. 2025) combines accessibility measures from 2022 (data available here: Statistics Canada (2023)) to different urban services weighted by their potential for trip generation using three different modes with equal weights: public transport, bicycle, and on foot. Both subindexes are then combined with a weight of 50% each, to compose a measure of transport poverty (Equation 1).
Transport Poverty (TP)= Marginalization∗0.5+Inaccessibility∗0.5
Following this, we averaged the index and two subindexes for each urban area in Canada (Census Metropolitan Area (CMA) and Census Agglomeration (CA)) (Statistics Canada 2021) per gender, by weighting the average of the values per DA based on the number of women and men. Equation 2 calculates the average indexes for each urban area using TP and women as an example, which was repeated for men, and for each of the subindexes.
TPW, Ai=∑Ni=1TPDAi∗ Number of Women in DAi∑Ni=1 Number of Women in DAi
Where corresponds to the average TP index for women in urban area Ai, and N corresponds to the number of DA in the urban area Ai.
Finally, we performed a paired t-test to identify significant differences between the average TP index score of men and women for each urban area. A paired Wilcoxon signed-rank test, less sensitive to outliers or heavy-tailed distributions, was also conducted. To answer the second question, we performed Local Indicators of Spatial Association (LISA) analyses (Anselin 1995) at the DA level, using Montréal and Hamilton as study cases, to investigate the relations between the spatial distribution of women/men, transport poverty, inaccessibility, and marginalization. These cities were selected to capture different urban sizes and dynamics that may generate distinct gendered patterns of TP. Montréal is a large urban area (metropolitan population > 4 million) with a large centralized public transport network, while Hamilton is a small-intermediate city (population around 750,000), served by a local bus system. Additionally, both cities occupy different positions in their urban city systems: Montréal is the core metropolitan area of its region, while Hamilton is a satellite city to the larger metropolitan area of Toronto. Finally, both cities represent different urban-cultural landscapes, as Montréal developed under French, and Hamilton under English influence.
Two pairs of LISA analyses were conducted for each urban area: (1a) marginalization and proportion of women, and (1b) inaccessibility and proportion of women; (2a) marginalization and proportion of men, and (2b) inaccessibility and proportion of men. This intersectional approach combines age, ethnicity (minorities), and economic conditions with gender. Results were then overlayed, for each gender, to identify clusters of TP with high marginalization, high inaccessibility, and a high proportion of women or men.
For the spatial matrix, a necessary feature in the LISA analyses, we tested distance matrices of the type K-Nearest Neighbors (KNN) with an inverse distance power of two, and different numbers of neighbors. This matrix was chosen because the inverted distance from the centroid enables accounting for the effect of the diminishing influence of far elements in polygons of varying sizes, such as DAs. Results were consistent for different numbers of neighbors, and we decided on a matrix of 80 KNN for Montreal and 35 KNN for Hamilton.
3. FINDINGS
The average TP per urban area suggests that women have a higher TP index in most urban areas. Figure 1a shows the paired plot of this measure per gender, with urban areas ordered from the lowest to the highest TP index. The curve of TP for women is, in most cases, to the right of the curve for men. This indicates that women have a higher TP index, a finding consistent with Tiznado Aitken, Palm, and Farber (2024), which found that women are more time poor than men in a transport-related time poverty analysis. In Figure 1b, we can see that women have a lower average inaccessibility (to the left of the curve of men), implying they have more access to destinations than men by public and active transport.
Finally, Figure 1c shows the paired subindex of marginalization, where women have a higher average index of marginalization than men. Although women have more access to destinations, the combination with a higher marginalization index leads to an overall higher TP index among women.

In Table 1, the results of the paired t-test were significant for the three measures, as well as for the Wilcoxon test. A sensitivity analysis was conducted with varying weights of the subindexes. We tested the following weights: 25% Marginalization–75% Inaccessibility, and 75% Marginalization–25% Inaccessibility. In both cases, the analyses (t-test and Wilcoxon test) yield a significantly higher average TP index for women (at the 99% confidence level) as compared to men. While the difference in terms of TP index is small (0.705 vs 0.702), the findings (consistent across large, medium and small urban areas, and statistically significant for all weights tested) suggest the presence of a trend that warrants further investigation.
Although the average results suggest that women have a higher TP index due to the marginalization component, the overlay of the spatial analyses results in Figure 2 disclose a more nuanced picture, by unmasking critical spatial disparities. In squared hatch over red, we identify significant local clusters of high values of inaccessibility/proportion of women and marginalization/proportion of women. From an intersectional perspective, the areas with a high proportion of women and a high marginalization are more likely to concentrate women characterized by socio-economic factors that, when combined with inaccessibility, result in adverse conditions. These areas where the high values of the three measures converge are surrounded by larger areas (in squared hatch) of inaccessibility and a high proportion of women (without the high marginalization component). On the other hand, the areas where the three variables coincide for men (inaccessibility, marginalization, and high proportion of men), in dotted hatch over light green, are mainly on the outskirts.
In both cities, which are in other respects dissimilar (size, transport system, cultural background, etc.), the same geographical pattern occurs: these areas in need of intervention for women concentrate in suburban nodes that encircle the downtown core of the two cities. This implies that although in the averaged measures women have more accessibility, the geographical disaggregation shows places where women have a disadvantage in access. With respect to men’s inaccessibility, these places are rather located in low density peripheral areas.
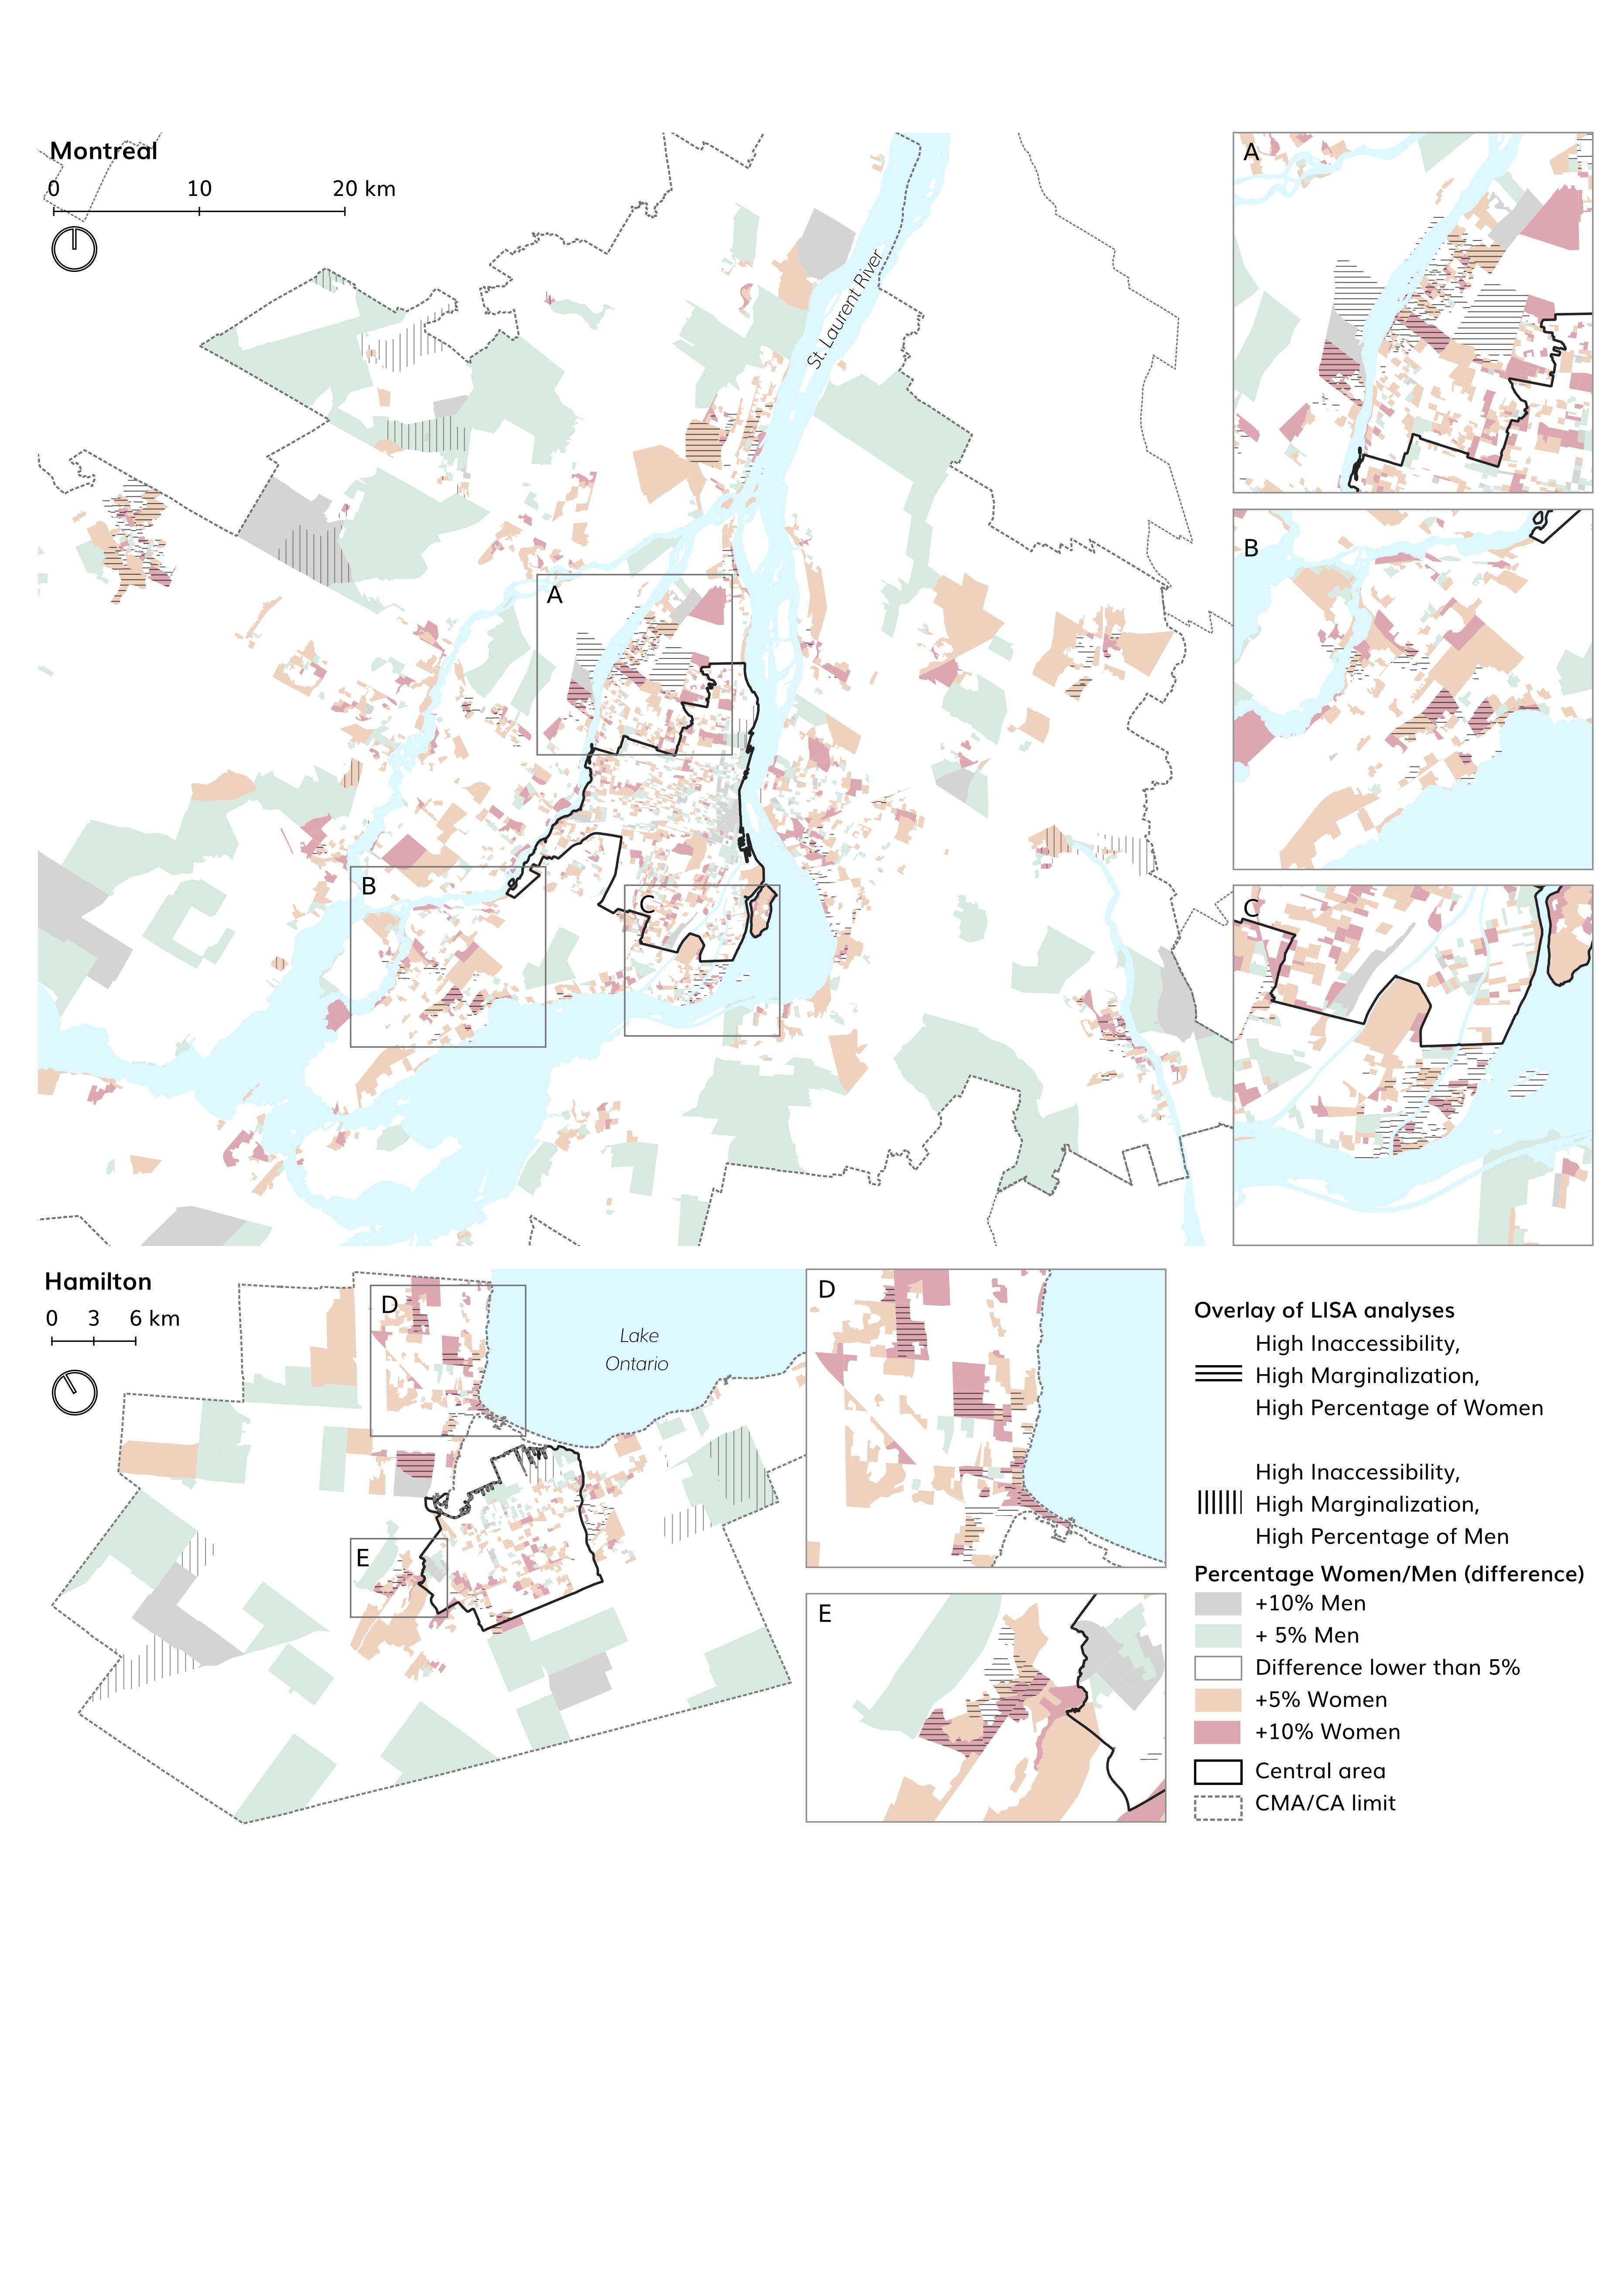
Since the LISA analyses identify clusters of high values in relative terms, Figure 3 highlights the areas with the highest proportion of women and men in absolute terms (difference between genders above 5% and 10%), alongside with the results of the LISA overlays (high inaccessibility, high marginalization, and high proportion of women/men). While not all overlays are characterized by high proportions in absolute terms, we do observe several overlaps: most overlays (for women and men) coincide, to a large extent, with high absolute proportions of women and men respectively.
The spatial analysis demonstrates the utility of this index for identifying geographical nuances in transport poverty for different population segments in Canadian cities. Combining the three measures through this spatial approach enables identifying areas that could be prioritized for transport interventions to reduce TP among targeted population segments. This approach could also be combined with absolute proportions, population density, and the number of individuals in each segment.


ACKNOWLEDGEMENTS
This work was supported by the Mobilizing Justice: towards evidence-based transportation equity policy initiative and CIRRELT.