
1. Questions
Automated speed enforcement is effective, but not widely implemented in the United States (Morain, Gielen, and Bhalla 2016; Munnich and Loveland 2011; IIHS 2025). One factor could be that Americans may not see speeding as especially dangerous and worthy of enforcement. If so, correcting this misconception could increase support for traffic cameras.
I ask two questions. First, compared to other risky driving behaviors, how do Americans rate the danger of speeding? Using a relative measure of danger addresses two problems. First, scales are arbitrary. Just how dangerous, for instance, is a score of six on a zero to ten danger scale? Second, people interpret scales differently—some give high ratings easily, while others are more conservative—making it hard to directly compare responses across individuals. Scholars address these problems using anchoring vignettes or cases (King et al. 2004). I employ this approach by assessing views about speeding relative to driving behaviors that are widely agreed to be very dangerous: driving drunk or distracted.
People may underestimate the relative harms of speeding. Unlike impairment or texting—which are often framed as reckless or immoral—speeding is frequently seen as a benign, everyday behavior. Moreover, traffic safety campaigns have historically emphasized other risky behaviors instead (Governors Highway Safety Association 2024). Yet speeding is widespread (Edmonds 2024) and contributes to nearly 12,000 deaths annually in the United States (Governors Highway Safety Association 2024). Speed is especially critical on arterials, with high traffic volumes and a disproportionate share of fatalities (Schneider et al. 2021).
If misconceptions about the dangers of speed are widespread and suppress support for enforcement, correcting them could be a powerful lever for increasing support for traffic cameras. This is the topic of question two.
2. Methods
I used the survey panel firm Prolific to recruit participants. While I used quotas based on sex, age, and race, the sample is nevertheless better educated and more urban than the U.S. population (see Table 1).
The survey opened by defining the terms “neighborhood street” and “arterial street” and speeding was defined as driving 10+ miles per hour over the limit. Respondents indicated the perceived danger of four driving behaviors on a scale of zero to ten with zero being “less dangerous” and ten being “more dangerous”:
-
driving with a Blood Alcohol Content (BAC) level above the federal legal limit (0.08%),
-
driving while texting,
-
speeding on a neighborhood street, and
-
speeding on an arterial street.
Next, I categorized respondents into three groups based on how their speeding ratings compared to their own ratings of drunk driving and texting:
-
much less dangerous (>1 point lower),
-
slightly less dangerous (1 point lower), or
-
equally dangerous.
By anchoring responses to well-understood reference points, I’m able to account for scale-use differences without requiring complex statistical adjustments.
Next, respondents were randomly assigned to read one of four messages explaining how automated speed enforcement works (see Figure 1). This paper focuses on just those respondents who were randomly assigned to read a safety or control message (n=377 for each). Additional respondents were assigned messages about racial justice (Ralph et al. 2022) or revenue generation (Ralph et al. 2024) and are not discussed here. See Delbosc et al. (2025) for further analysis of the safety message.
After reading the message, respondents were asked: “Based on the previous description, would you vote to approve traffic safety cameras in your community?” Response options were: “Yes, my community should adopt traffic safety cameras” or “No, my community should not adopt traffic safety cameras.” The random assignment of an experiment allows for simple analytical tools. I can determine the effect of the speeding message using t-tests for differences in means.

3. Results
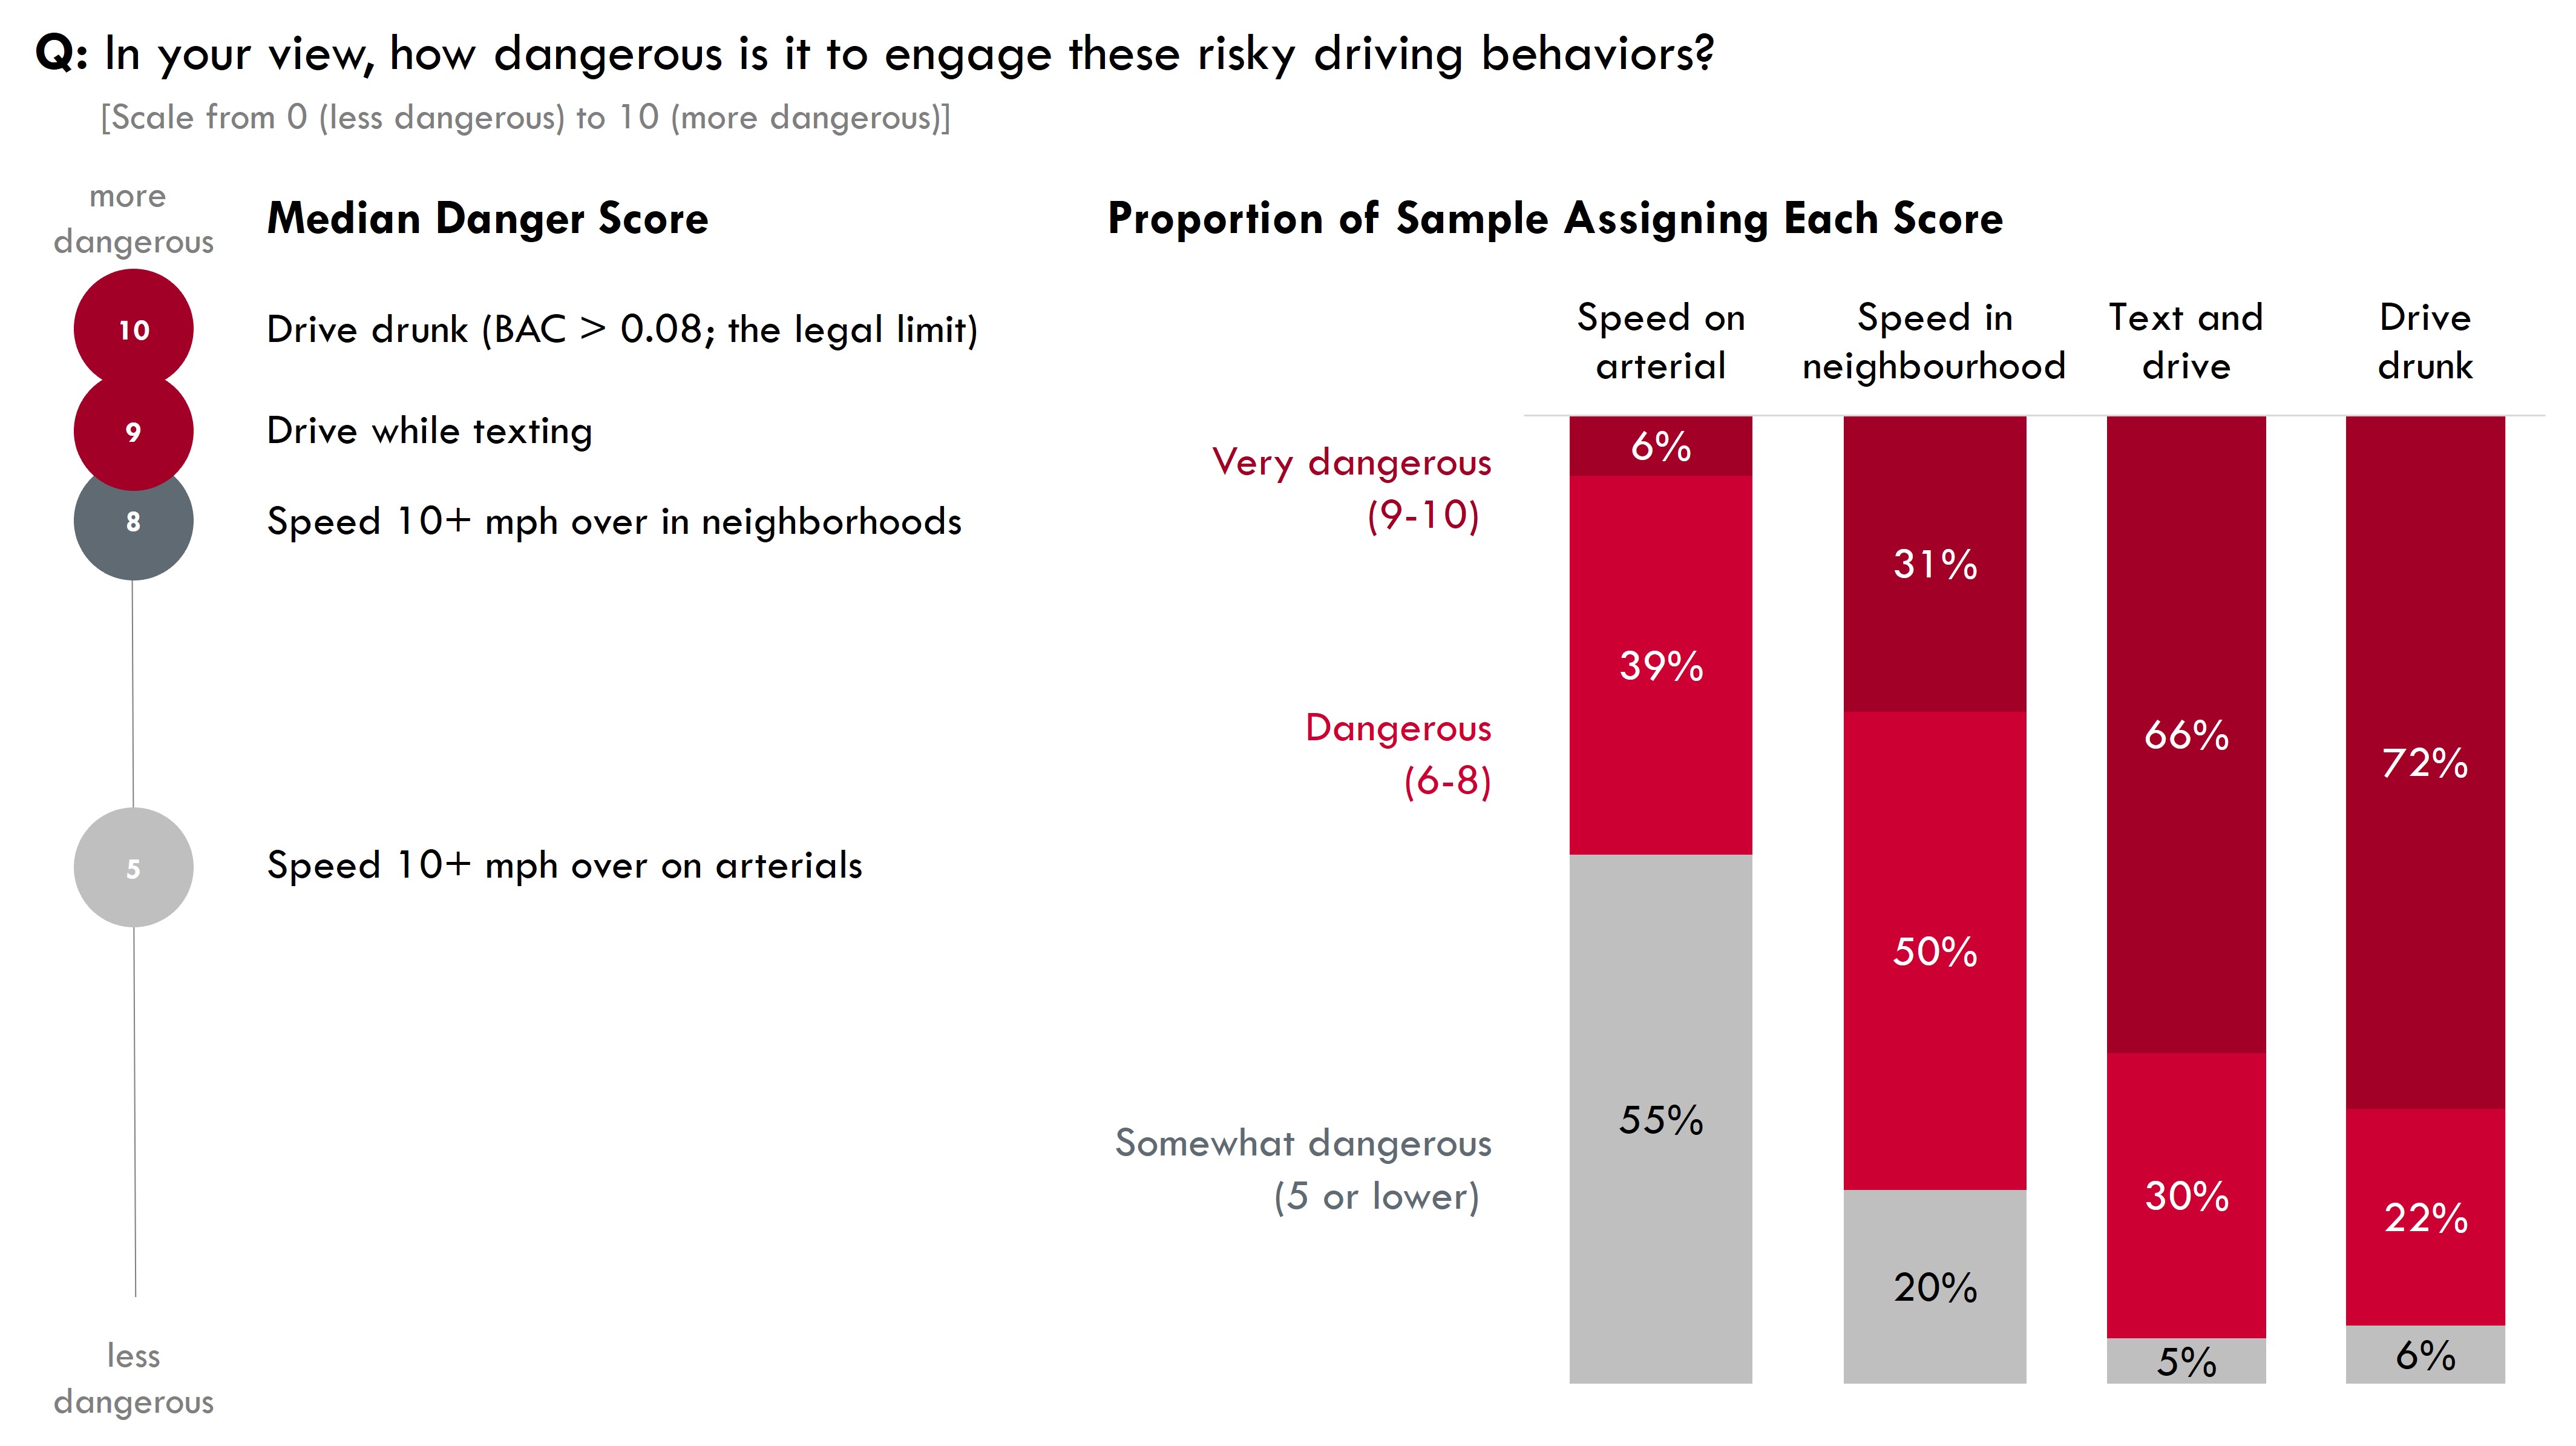
Figure 2 reveals that respondents widely agree about the dangers of drunk and distracted driving, with median danger scores of 10 and 9, respectively. By contrast, respondents see speeding as relatively less dangerous—especially on arterial streets, where the median score was five. The left-hand panel highlights that while most respondents rate drunk or distracted driving as “very dangerous,” (scores of 9 or 10), very few rate speeding similarly.
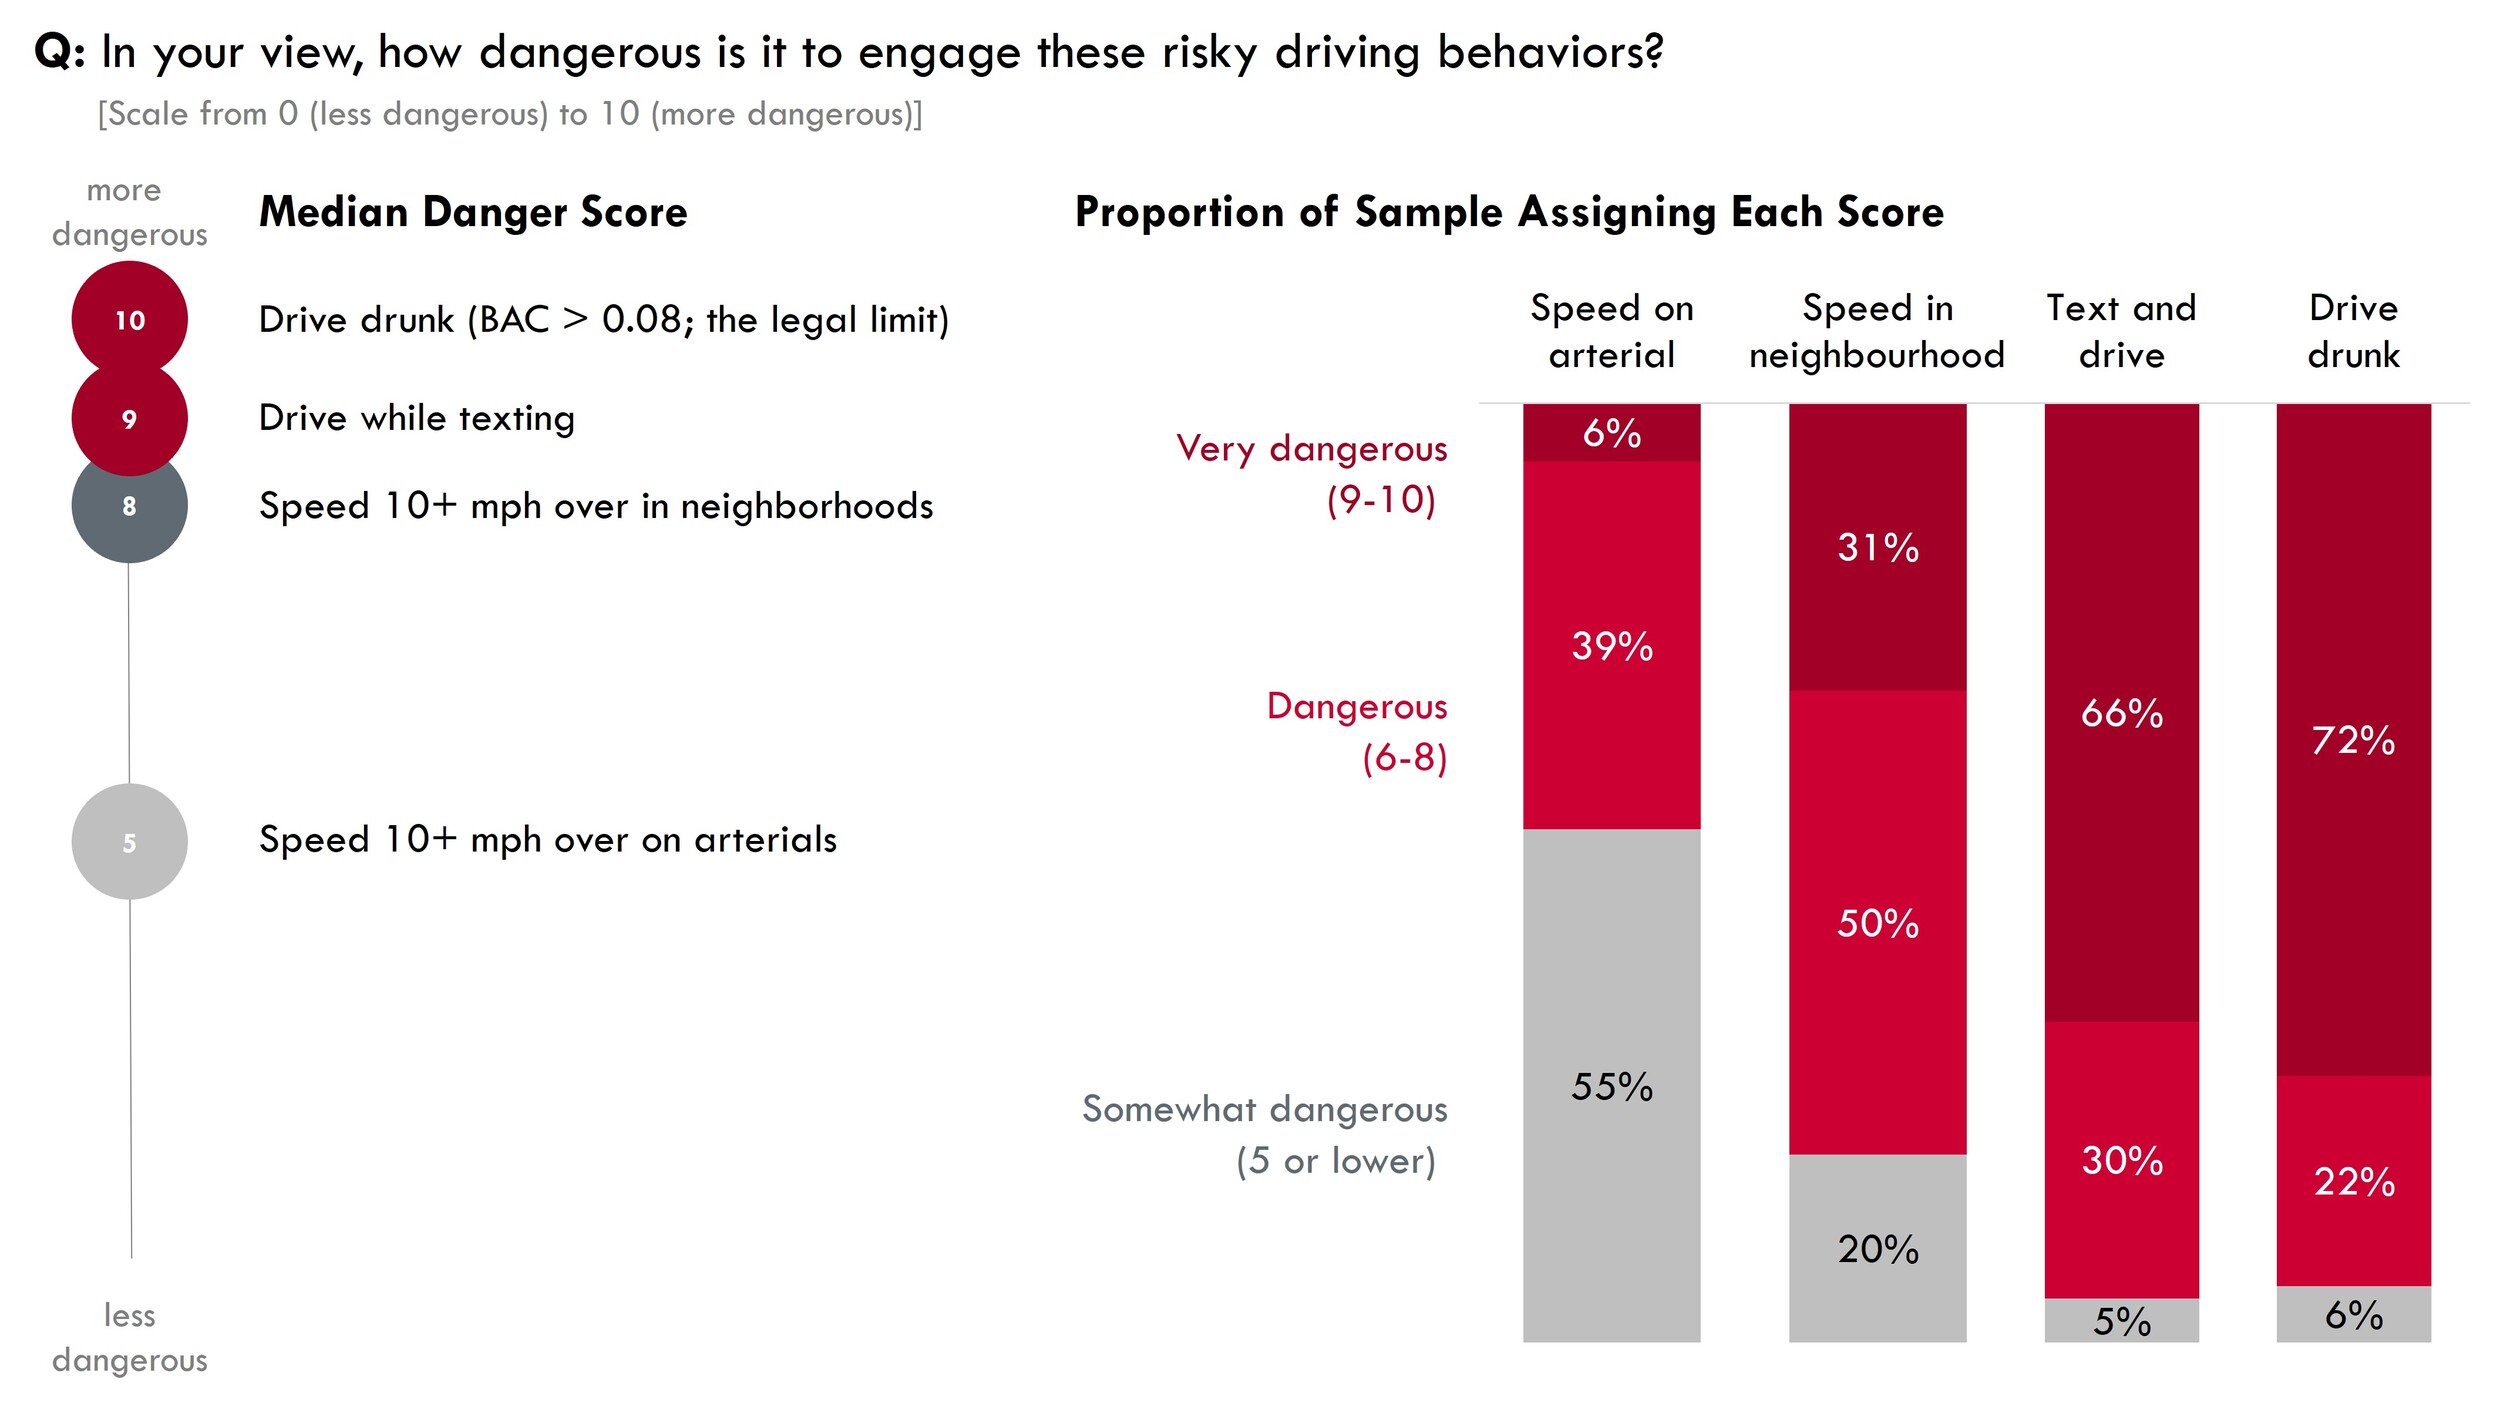
Table 2 confirms that a large majority of respondents (80%) believe speeding on arterials is “much less dangerous” than drunk or distracted driving, and a plurality (45%) say the same about neighborhood speeding. Only 9–28% (depending on location) rate speeding as “equally dangerous.”
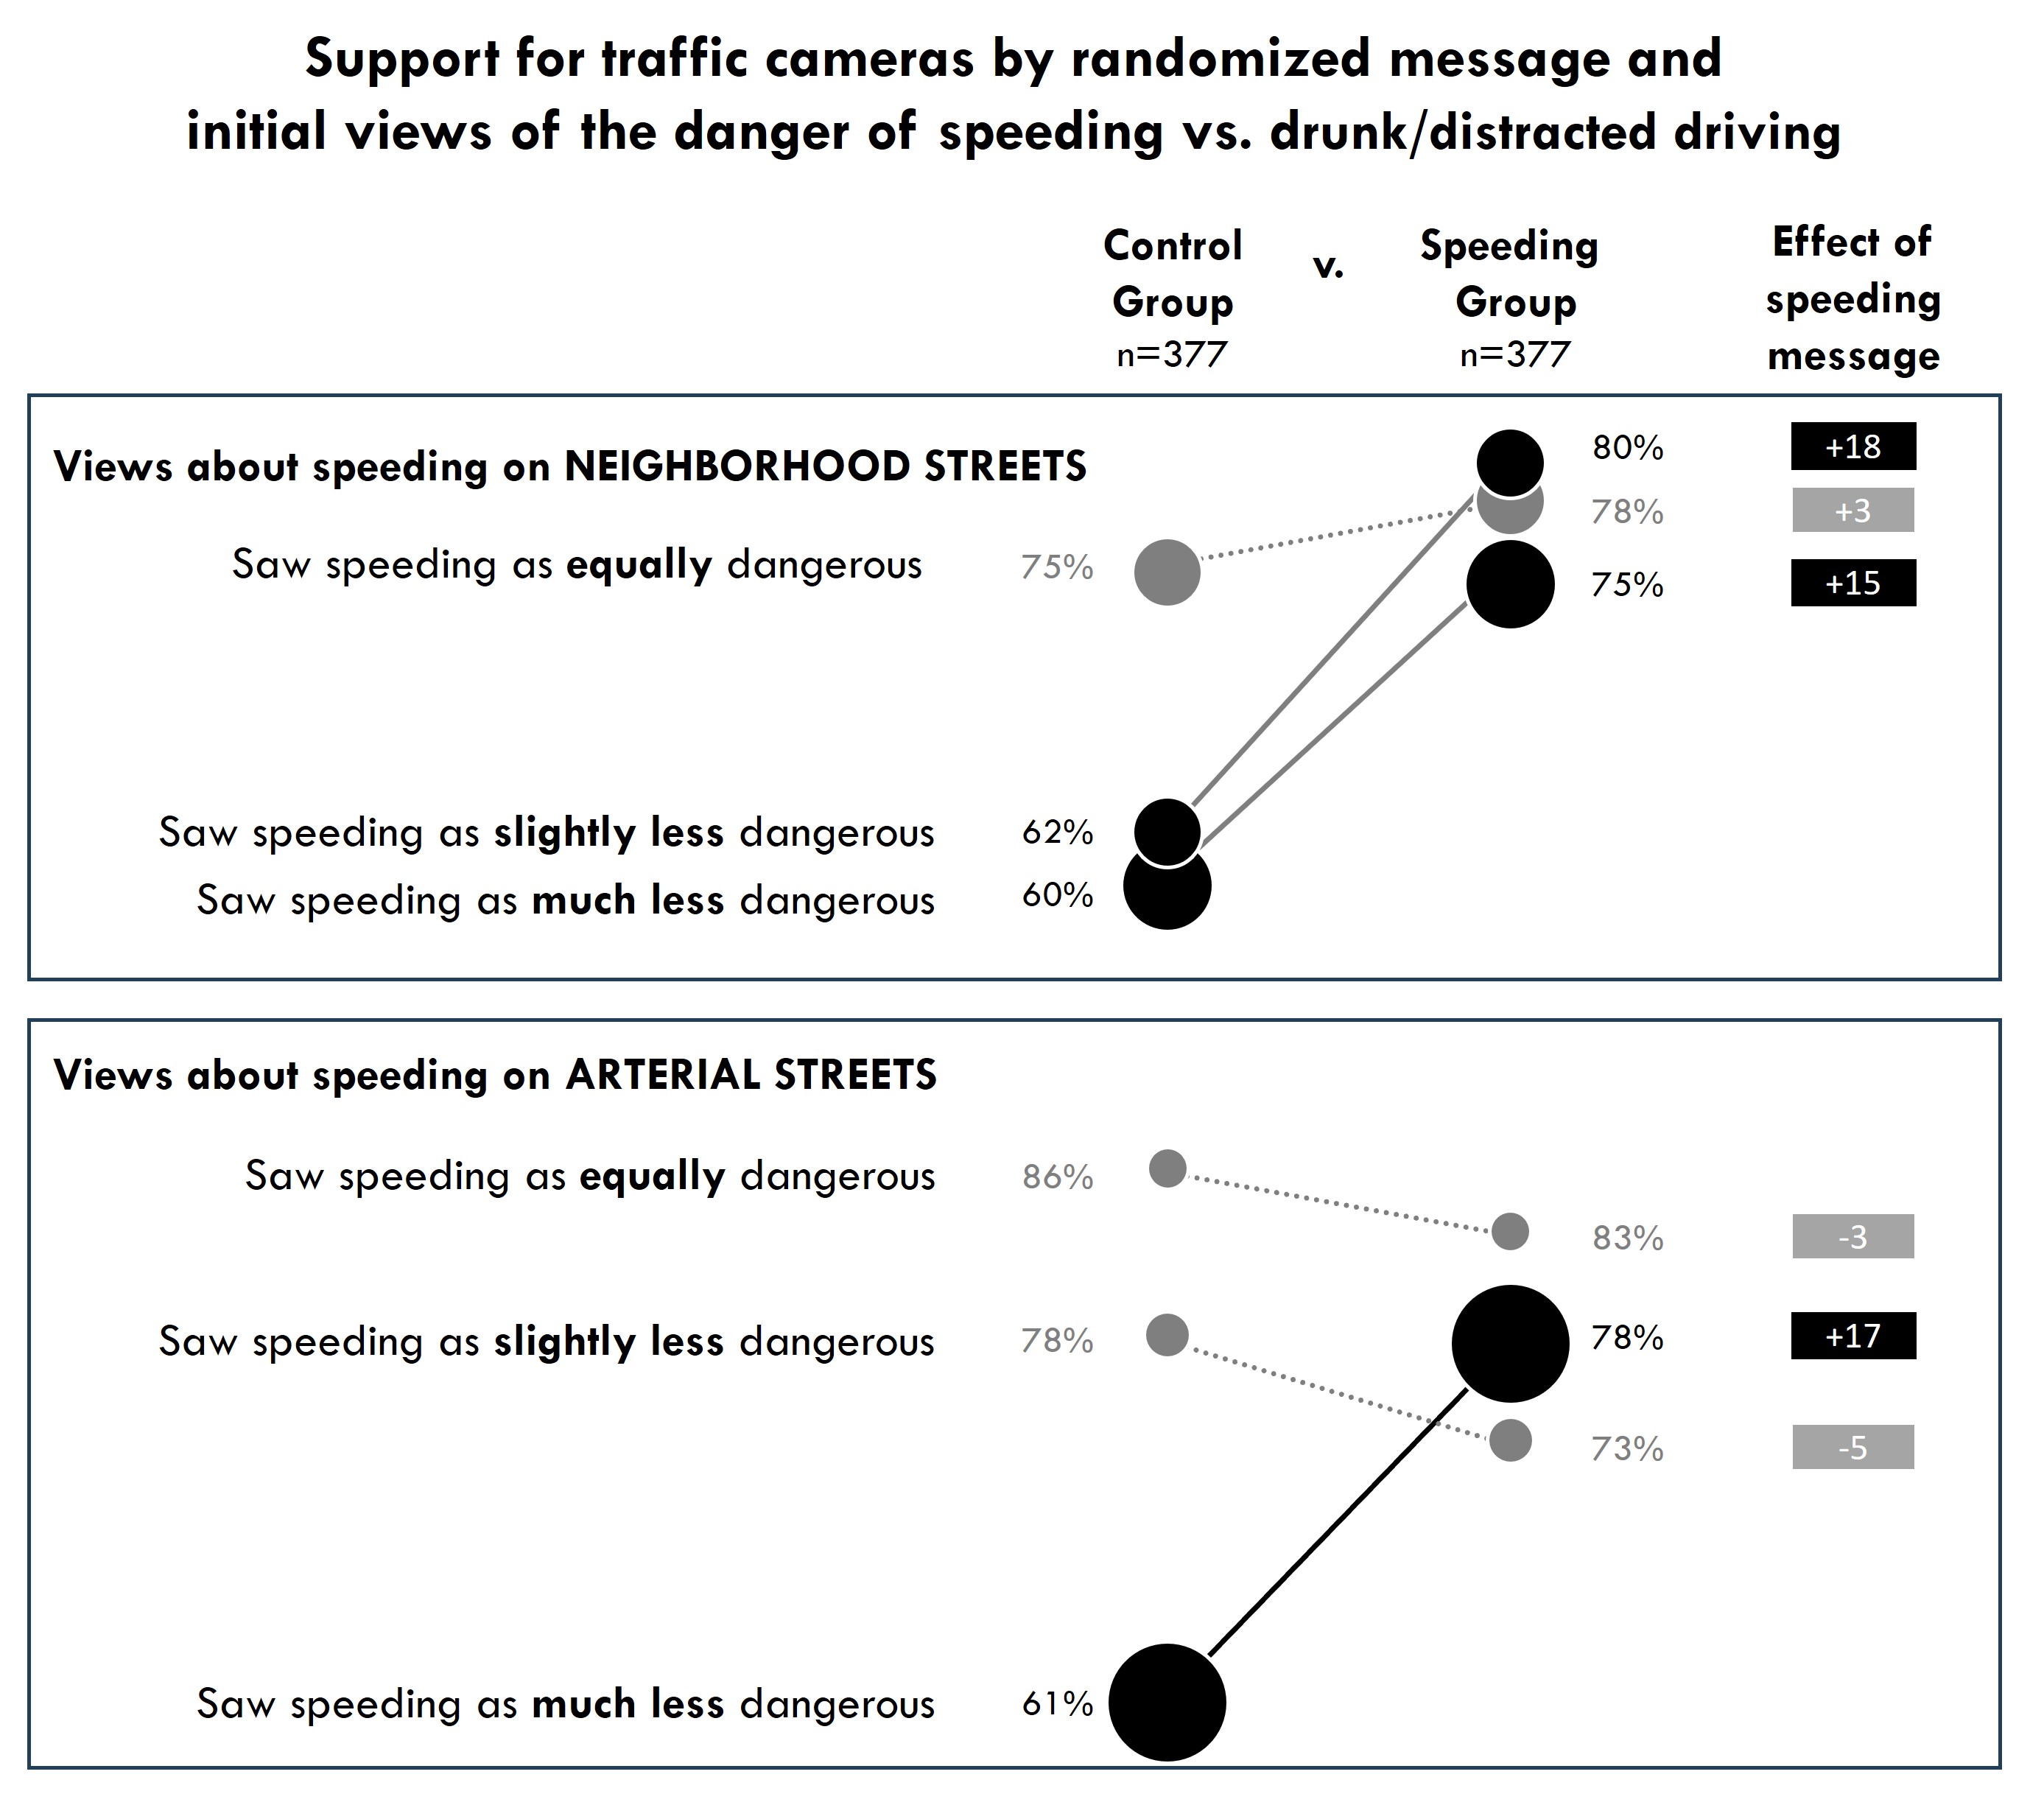
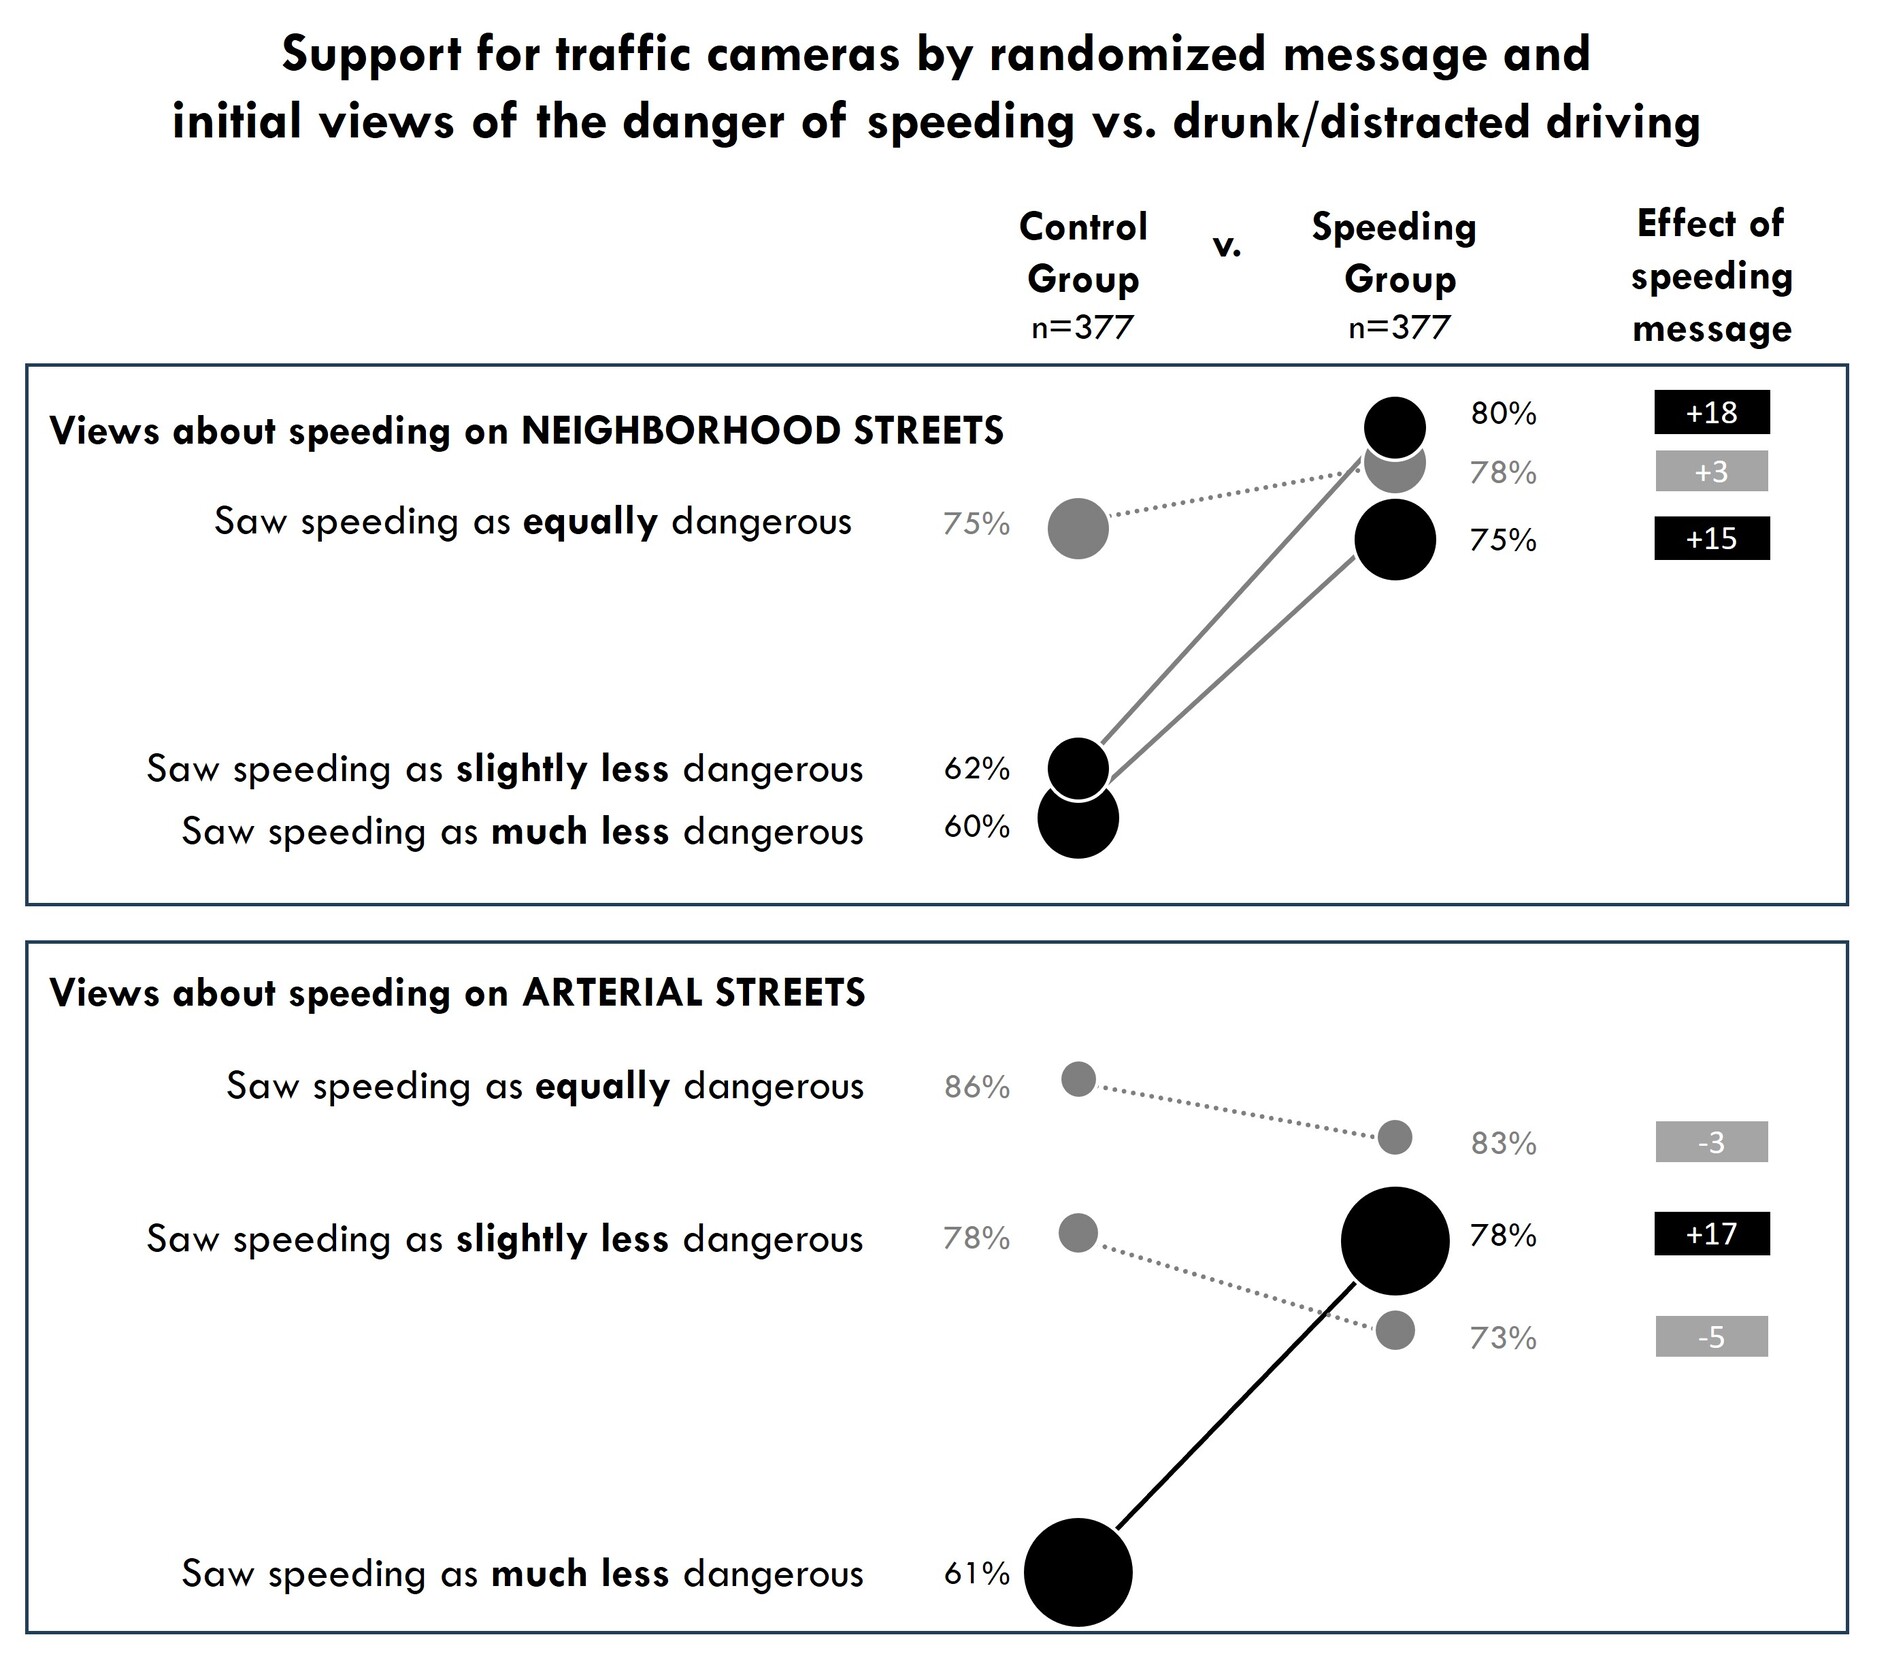
Figure 3 shows how support for cameras varies by message and initial views. Two key results emerge. First, for the control group, support for cameras is much higher among those who already believed speeding was relatively dangerous. Second, the safety message increased support—but only among respondents who initially saw speeding as less or much less dangerous. Fortunately, most respondents fall into those categories, meaning the safety message was effective for most participants. The safety message had no effect among the few respondents who already saw speeding as equally dangerous.
In sum, many Americans rate speeding as much less dangerous than other risky driving behaviors. This perception gap is troubling, given speeding’s major role in fatal crashes. Fortunately, the results suggest that emphasizing the dangers of speed can shift perceptions and increase support for automated speed enforcement—an effective but underused policy tool. Practitioners should emphasize speeding’s risks in safety messaging, particularly when advocating for traffic cameras. Methodologically, scholars should consider using anchors and/or relative measures to increase the interpretability of their scales.
Acknowledgements
Jesus Barajas, Alexa Delbosc, Carlyn Muir, and Angela Johnson Rodriguez collaborated on the design of the survey instrument and co-authored complementary analysis cited here. I thank them for their valuable insights on the broader project and for their patience while I pursued this relative measure of safety.