Loading [Contrib]/a11y/accessibility-menu.js

This website uses cookies

We use cookies to enhance your experience and support COUNTER Metrics for transparent reporting of readership statistics. Cookie data is not sold to third parties or used for marketing purposes.

Skip to main content
null
Findings
  • Menu
  • Articles
    • Energy Findings
    • Resilience Findings
    • Safety Findings
    • Transport Findings
    • Urban Findings
    • All
  • For Authors
  • Editorial Board
  • About
  • Blog
  • covid-19
  • search
  • X (formerly Twitter) (opens in a new tab)
  • LinkedIn (opens in a new tab)
  • RSS feed (opens a modal with a link to feed)

RSS Feed

Enter the URL below into your favorite RSS reader.

http://localhost:16808/feed
ISSN 2652-8800
Safety Findings
October 28, 2025 AEST

Seeing Speed Clearly: Relative Risk and Public Support for Automated Enforcement

Kelcie Ralph, Ph.D,
Traffic safetyautomated enforcementspeedingrisk perceptionpublic opinionsurvey experimentanchor vignettes
Copyright Logoccby-sa-4.0 • https://doi.org/10.32866/001c.143457
Findings
Ralph, Kelcie. 2025. “Seeing Speed Clearly:  Relative Risk and Public Support for Automated Enforcement.” Findings, October. https:/​/​doi.org/​10.32866/​001c.143457.
Download all (3)
  • Figure 1. A safety message or control message was randomly assigned to each participant
    Download
  • Figure 2. Comparing the perceived danger of speeding and other dangerous driving behaviors
    Download
  • Figure 3. Support for automated enforcement by views about speeding and experimental message
    Download

Sorry, something went wrong. Please try again.

If this problem reoccurs, please contact Scholastica Support

Error message:

undefined

View more stats

Abstract

Perceptions are often measured on unanchored scales, making it difficult to compare across individuals. I address this challenge by comparing how respondents rate speeding versus behaviors near universally regarded as dangerous. Results show that most respondents see speeding—especially on arterials—as much less dangerous than drunk or distracted driving. Correcting this misconception offers an opportunity to shift opinions on traffic cameras, which are effective but underutilized. A survey experiment reveals that a brief safety message increases support among those who initially underestimated the dangers of speed. Scholars should employ relative scales and practitioners should emphasize the risks of speed.

1. Questions

Automated speed enforcement is effective, but not widely implemented in the United States (Morain, Gielen, and Bhalla 2016; Munnich and Loveland 2011; IIHS 2025). One factor could be that Americans may not see speeding as especially dangerous and worthy of enforcement. If so, correcting this misconception could increase support for traffic cameras.

I ask two questions. First, compared to other risky driving behaviors, how do Americans rate the danger of speeding? Using a relative measure of danger addresses two problems. First, scales are arbitrary. Just how dangerous, for instance, is a score of six on a zero to ten danger scale? Second, people interpret scales differently—some give high ratings easily, while others are more conservative—making it hard to directly compare responses across individuals. Scholars address these problems using anchoring vignettes or cases (King et al. 2004). I employ this approach by assessing views about speeding relative to driving behaviors that are widely agreed to be very dangerous: driving drunk or distracted.

People may underestimate the relative harms of speeding. Unlike impairment or texting—which are often framed as reckless or immoral—speeding is frequently seen as a benign, everyday behavior. Moreover, traffic safety campaigns have historically emphasized other risky behaviors instead (Governors Highway Safety Association 2024). Yet speeding is widespread (Edmonds 2024) and contributes to nearly 12,000 deaths annually in the United States (Governors Highway Safety Association 2024). Speed is especially critical on arterials, with high traffic volumes and a disproportionate share of fatalities (Schneider et al. 2021).

If misconceptions about the dangers of speed are widespread and suppress support for enforcement, correcting them could be a powerful lever for increasing support for traffic cameras. This is the topic of question two.

2. Methods

I used the survey panel firm Prolific to recruit participants. While I used quotas based on sex, age, and race, the sample is nevertheless better educated and more urban than the U.S. population (see Table 1).

Table 1.Survey respondent demographics
Survey respondents US population
Sample size 754
Age (average) 44 42
Sex
Female 50% 51%
Male 50% 49%
Education
High school or less 11% 39%
Some college 29% 29%
Bachelor’s degree 31% 20%
Graduate degree 29% 12%
Income
Less than $25,000 15% 19%
$25,000 to $49,999 20% 21%
$50,000 to $74,999 17% 17%
$75,000 to $99,999 17% 13%
$100,000 or more 31% 30%
Home location
Rural 4% 22%
Suburban and urban 96% 78%

The survey opened by defining the terms “neighborhood street” and “arterial street” and speeding was defined as driving 10+ miles per hour over the limit. Respondents indicated the perceived danger of four driving behaviors on a scale of zero to ten with zero being “less dangerous” and ten being “more dangerous”:

  1. driving with a Blood Alcohol Content (BAC) level above the federal legal limit (0.08%),

  2. driving while texting,

  3. speeding on a neighborhood street, and

  4. speeding on an arterial street.

Next, I categorized respondents into three groups based on how their speeding ratings compared to their own ratings of drunk driving and texting:

  1. much less dangerous (>1 point lower),

  2. slightly less dangerous (1 point lower), or

  3. equally dangerous.

By anchoring responses to well-understood reference points, I’m able to account for scale-use differences without requiring complex statistical adjustments.

Next, respondents were randomly assigned to read one of four messages explaining how automated speed enforcement works (see Figure 1). This paper focuses on just those respondents who were randomly assigned to read a safety or control message (n=377 for each). Additional respondents were assigned messages about racial justice (Ralph et al. 2022) or revenue generation (Ralph et al. 2024) and are not discussed here. See Delbosc et al. (2025) for further analysis of the safety message.

After reading the message, respondents were asked: “Based on the previous description, would you vote to approve traffic safety cameras in your community?” Response options were: “Yes, my community should adopt traffic safety cameras” or “No, my community should not adopt traffic safety cameras.” The random assignment of an experiment allows for simple analytical tools. I can determine the effect of the speeding message using t-tests for differences in means.

Figure 1
Figure 1.A safety message or control message was randomly assigned to each participant

3. Results

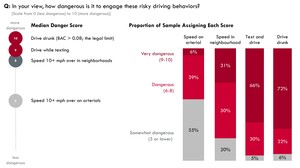
Figure 2 reveals that respondents widely agree about the dangers of drunk and distracted driving, with median danger scores of 10 and 9, respectively. By contrast, respondents see speeding as relatively less dangerous—especially on arterial streets, where the median score was five. The left-hand panel highlights that while most respondents rate drunk or distracted driving as “very dangerous,” (scores of 9 or 10), very few rate speeding similarly.

Figure 2
Figure 2.Comparing the perceived danger of speeding and other dangerous driving behaviors

Table 2 confirms that a large majority of respondents (80%) believe speeding on arterials is “much less dangerous” than drunk or distracted driving, and a plurality (45%) say the same about neighborhood speeding. Only 9–28% (depending on location) rate speeding as “equally dangerous.”

Table 2.Anchored perceptions: The relative danger of speeding
Share of respondents who see speeding 10+ mph over the limit as _____ dangerous
as driving drunk or texting and driving.
On neighborhood streets On
arterial
streets
-Equally (Equal or greater danger score) 28% 9%
-Slightly less (1 point lower danger score) 27% 11%
-Much less (>1 point lower danger score) 45% 80%
100% 100%

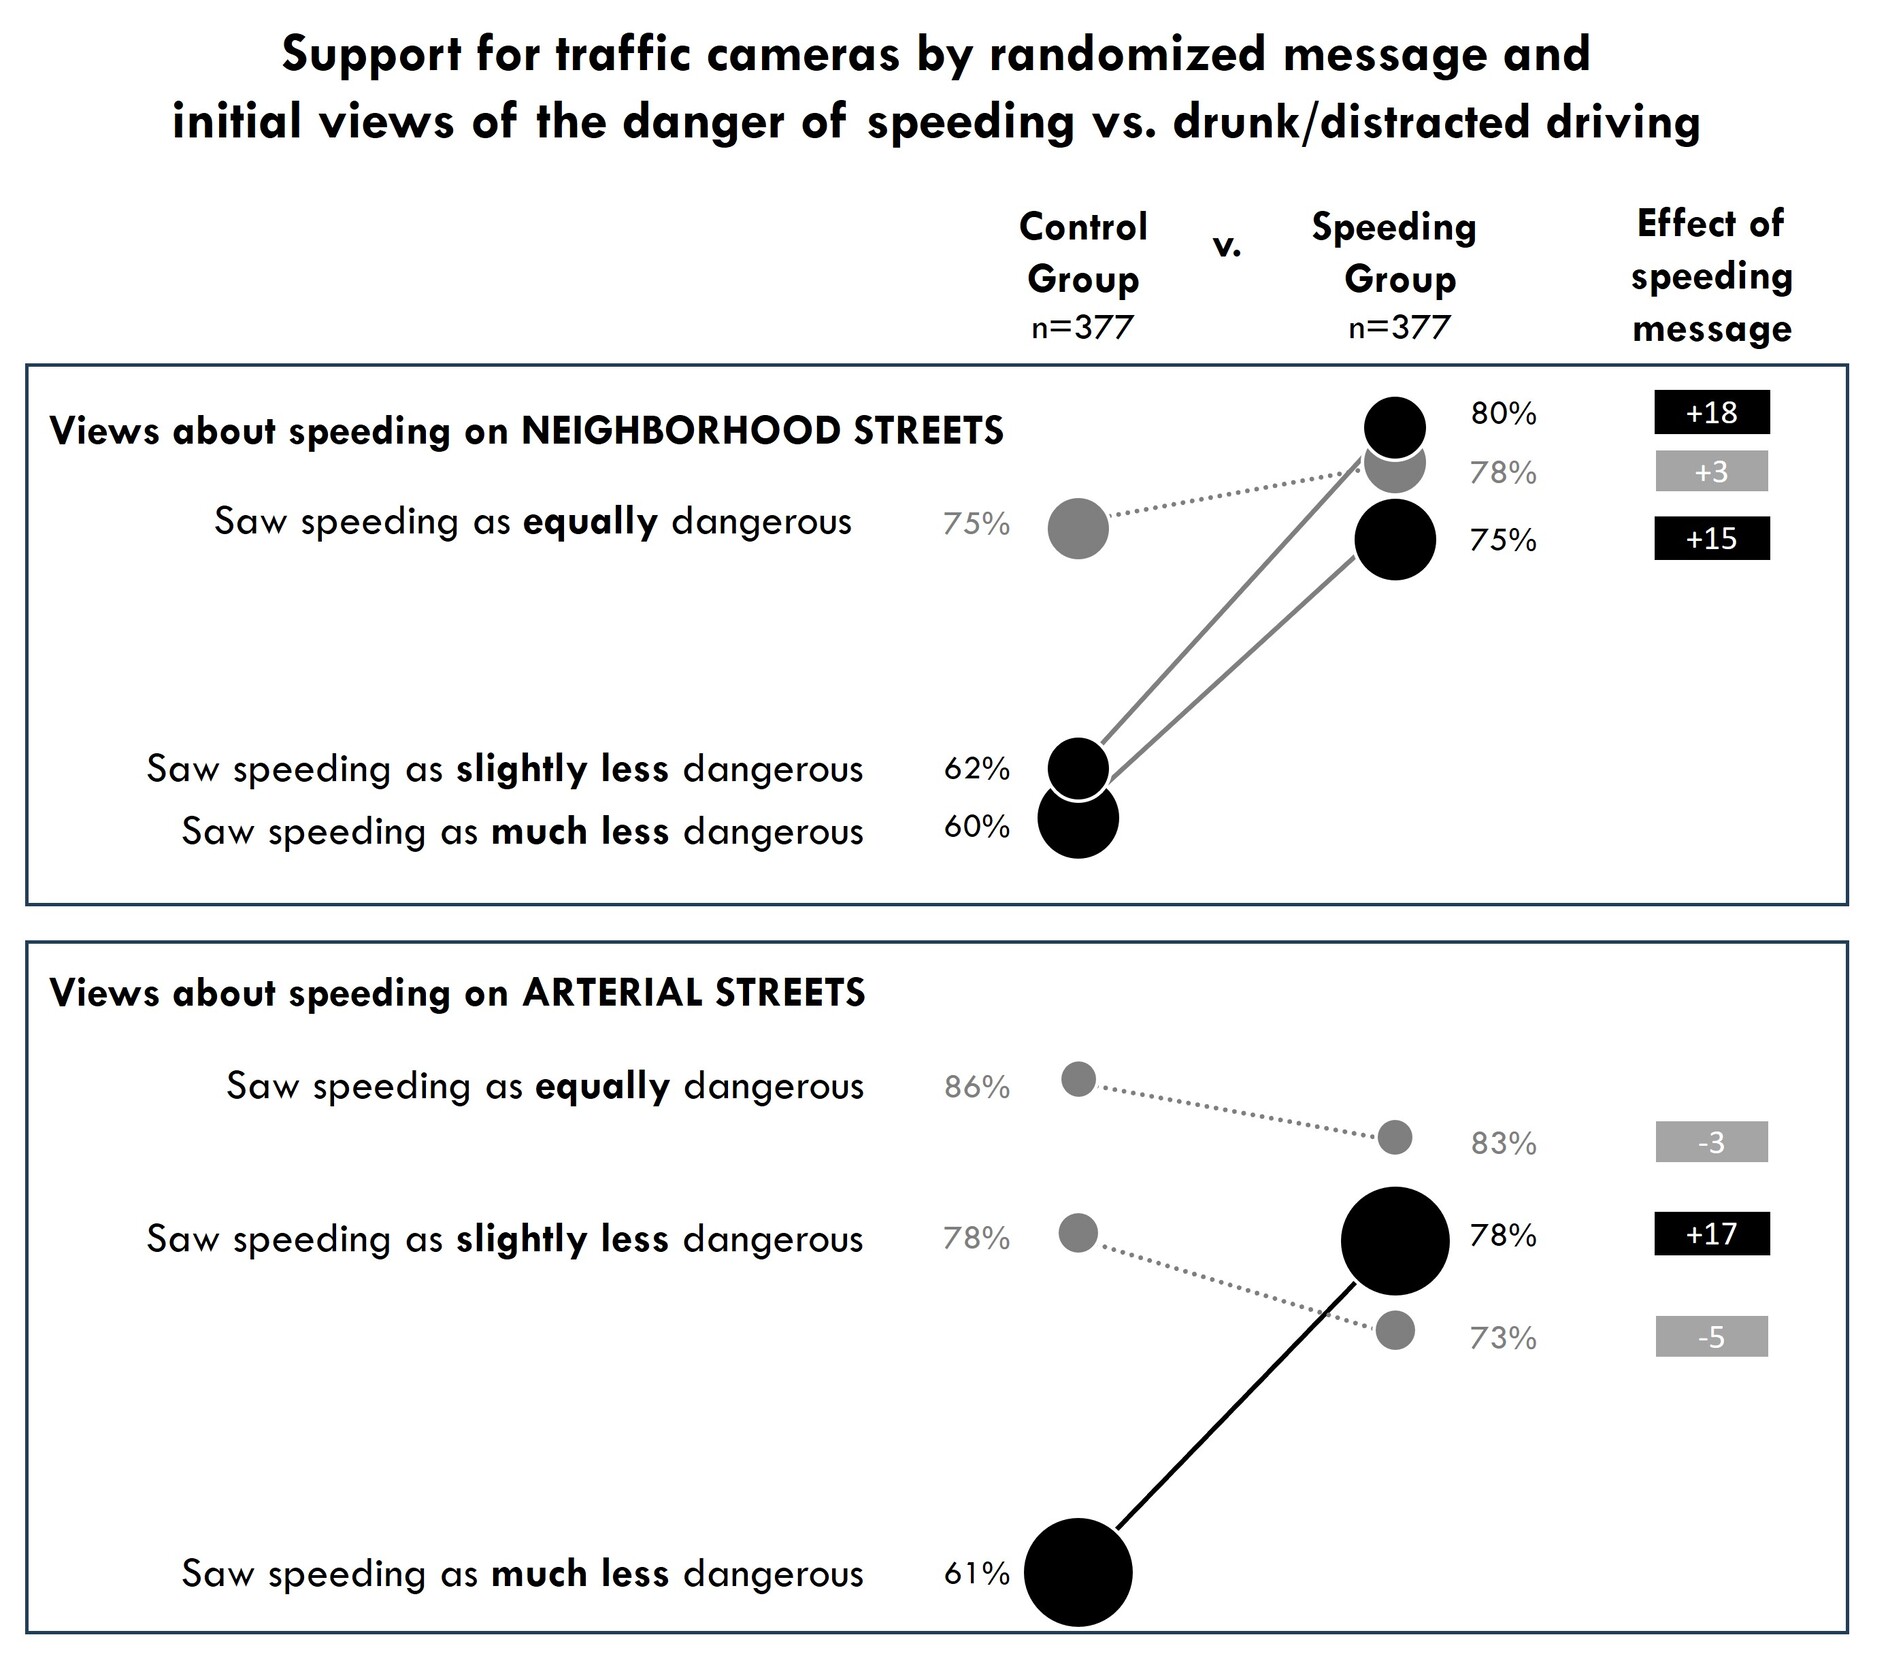
Figure 3 shows how support for cameras varies by message and initial views. Two key results emerge. First, for the control group, support for cameras is much higher among those who already believed speeding was relatively dangerous. Second, the safety message increased support—but only among respondents who initially saw speeding as less or much less dangerous. Fortunately, most respondents fall into those categories, meaning the safety message was effective for most participants. The safety message had no effect among the few respondents who already saw speeding as equally dangerous.

Figure 3
Figure 3.Support for automated enforcement by views about speeding and experimental message

Note: Colors denote statistical significance of a t-test for difference in means. Black values and solid lines indicate statistically significant treatment effect (p< 0.05). Gray dashes indicate insignificant treatment effects. The size of each dot is proportional to the prevalence of each view among respondents (see Table 2).

In sum, many Americans rate speeding as much less dangerous than other risky driving behaviors. This perception gap is troubling, given speeding’s major role in fatal crashes. Fortunately, the results suggest that emphasizing the dangers of speed can shift perceptions and increase support for automated speed enforcement—an effective but underused policy tool. Practitioners should emphasize speeding’s risks in safety messaging, particularly when advocating for traffic cameras. Methodologically, scholars should consider using anchors and/or relative measures to increase the interpretability of their scales.


Acknowledgements

Jesus Barajas, Alexa Delbosc, Carlyn Muir, and Angela Johnson Rodriguez collaborated on the design of the survey instrument and co-authored complementary analysis cited here. I thank them for their valuable insights on the broader project and for their patience while I pursued this relative measure of safety.

Submitted: July 12, 2025 AEST

Accepted: August 20, 2025 AEST

References

Delbosc, Alexa, Carlyn Muir, Kelcie Ralph, Jesus M. Barajas, and Angela Johnson-Rodriguez. 2025. “Do Perceptions of Speeding Act as a Barrier to Automated Speed Enforcement in the United States?” Transportation Research Part F: Traffic Psychology and Behaviour 114 (October): 1042–52. https:/​/​doi.org/​10.1016/​j.trf.2025.07.010.
Google Scholar
Edmonds, Ellen. 2024. “The Deadly Trio on U.S. Roads - Speeding, Distractions, and Aggression.” AAA Newsroom, December 5, 2024. https:/​/​newsroom.aaa.com/​2024/​12/​the-deadly-trio-on-u-s-roads-speeding-distractions-and-aggression/​.
Governors Highway Safety Association. 2024. “Speeding & Aggressive Driving.” https:/​/​www.ghsa.org/​state-laws-issues/​speeding-aggressive-driving.
IIHS. 2025. “Speed.” Insurance Institute for Highway Safety. July 2025. https:/​/​www.iihs.org/​research-areas/​speed.
King, Gary, Christopher J. L. Murray, Joshua A. Salomon, and Ajay Tandon. 2004. “Enhancing the Validity and Cross-Cultural Comparability of Measurement in Survey Research.” American Political Science Review 98 (1): 191–207. https:/​/​doi.org/​10.1017/​S000305540400108X.
Google Scholar
Morain, Stephanie R., Andrea C. Gielen, and Kavi Bhalla. 2016. “Automated Speed Enforcement Systems to Reduce Traffic-Related Injuries: Closing the Policy Implementation Gap.” Policy Forum. Injury Prevention 22 (1): 79–83. https:/​/​doi.org/​10.1136/​injuryprev-2014-041507.
Google Scholar
Munnich, Lee W., and Joseph D. Loveland. 2011. “Do Americans Oppose Controversial Evidence-Based Road Safety Policies?” Transportation Research Record 2213 (1): 9–12. https:/​/​doi.org/​10.3141/​2213-02.
Google Scholar
Ralph, Kelcie, Jesus M. Barajas, Angela Johnson-Rodriguez, Alexa Delbosc, and Carlyn Muir. 2022. “Can a Racial Justice Frame Help Overcome Opposition to Automated Traffic Enforcement?” Transportation Research Interdisciplinary Perspectives 14 (June): 100594. https:/​/​doi.org/​10.1016/​j.trip.2022.100594.
Google Scholar
———. 2024. “The End of Speed Traps and Ticket Quotas: Re-Framing and Reforming Traffic Cameras to Increase Support.” Journal of Planning Education and Research 44 (4): 1988–2003. https:/​/​doi.org/​10.1177/​0739456X221138073.
Google Scholar
Schneider, Robert James, Rebecca Sanders, Frank Proulx, and Hamideh Moayyed. 2021. “United States Fatal Pedestrian Crash Hot Spot Locations and Characteristics.” Journal of Transport and Land Use 14 (1): 1. https:/​/​doi.org/​10.5198/​jtlu.2021.1825.
Google Scholar

Powered by Scholastica, the modern academic journal management system