
1. QUESTIONS
Travel time is key to understanding the determinants of mode choice (Delclòs-Alió, Marquet, and Miralles-Guasch 2017; Kelly et al. 2013; Tenenboim and Shiftan 2018). Previous research has compared calculated and reported travel time for multiple modes (Bastarianto et al. 2025; Brands et al. 2022; Hillel et al. 2016), though most studies were limited geographically. Despite this, there is a lack of consensus regarding the existence, magnitude, and causes of mismatch between reported and calculated travel times (Kelly et al. 2013; Tenenboim and Shiftan 2018). This study contributes to the literature by comparing reported and calculated commute travel times for four travel modes (walking, cycling, public transit, and car) across 12 Canadian regions, analyzing and quantifying the degree of (mis)match. We aim to provide researchers and practitioners with a deeper understanding of travel time calculation reliability for various modes of transport, facilitating the examination of travel behavior.
2. METHODS
Data was obtained from the Canadian Mobility Survey (CMS), a bilingual online transport survey conducted in Fall 2024 in 12 regions, namely Toronto, Montréal, Vancouver, Ottawa-Gatineau, Calgary, Edmonton, Québec, Winnipeg, Hamilton, Halifax, Victoria, and Saskatoon. Survey responses were validated using strict exclusion criteria, including e-mail and IP address, completion time, home and work location, age, household structure, and weekly travel data. Validation resulted in 16,962 complete and valid responses, including 10,347 workers.
Our analysis focuses on workers who indicated their home and work locations, and the main mode of transport for their commute (the mode they used to travel the farthest). Commute mode was sorted into four categories: walking, cycling, public transit, and car. Participants indicated what time they left home and arrived at work during their latest commute; the time difference between these times is their reported travel time (RTT) in intervals of 5 minutes. Using the home and work location a Google Maps API was used to retrieve the best guess calculated travel time (CTT) for each commute for the same day of the week and departure time. Based on the data distribution, we excluded observations where RTT exceeded 90 minutes, CTT was under 5 minutes, or the difference between CTT and RTT exceeded 20 minutes, leaving a final sample of 7,022 valid participants.
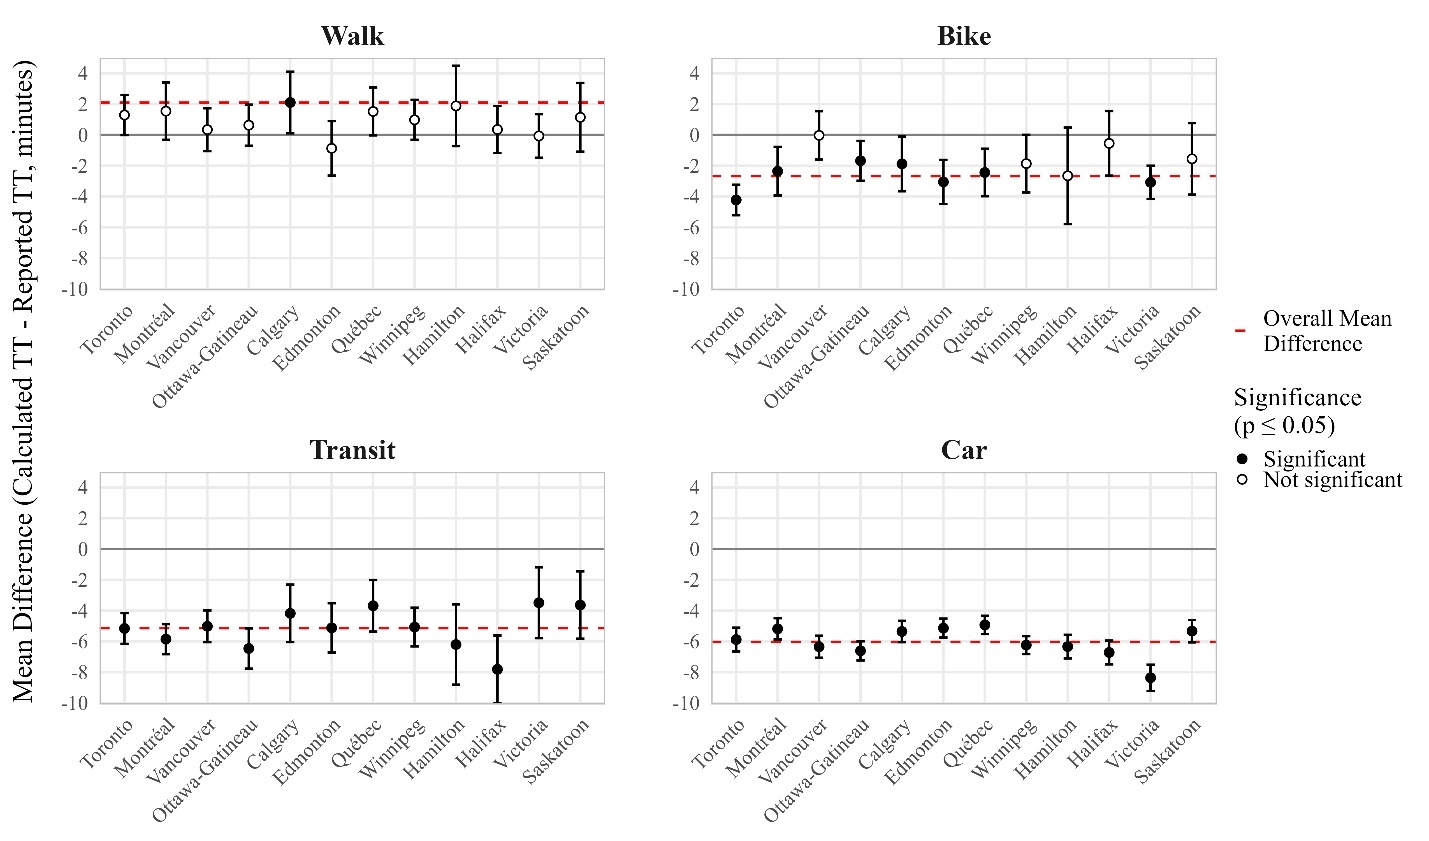
After grouping participants by their main commute mode, this sample was analyzed using two approaches. In the first approach, participants were grouped by their region and commute mode, forming 48 subgroups (Figure 1). In the second approach, we established CTT quintiles within each commute mode group, resulting in 20 subgroups based on main mode and CTT quintile (Figure 2).
_between_calculated_and_reported_travel_times_by_region_and_commute_mo.jpeg)
_between_calculated_and_reported_travel_times_by_ctt_quintile_and_comm.jpeg)
The mean difference (MD) calculated for each subgroup is the sum of travel time differences (CTT-RTT) divided by the total number of individuals in that subgroup. Practically, MD quantifies (mis)match, showing the direction and magnitude of the average difference between CTT and PTT for all individuals in a subgroup. We conducted paired t-tests using the ‘stats’ R package, pairing each subgroup’s CTTs and RTTs to determine whether the MD is statistically significant (R Core Team 2023). The red lines in Figures 1 and 2 represent the average MD of the statistically significant subgroups for each mode (the overall MD).
3. FINDINGS
Figure 1 shows that participants who use public transit (N = 1,545) or drive (N = 3,780) to work tend to overestimate their commute travel time compared to the calculated travel times. Overall MD is -5.14 minutes for public transit users and -6.04 minutes for car users. These discrepancies indicate that people add around five minutes to their calculated travel time regardless of region, suggesting mismatch for these modes. The overall MD of cyclists (N = 976)was -2.67 minutes for statically significant regions, indicating that cycling RTT more closely aligns with CTT, but may not be a perfect match. Pedestrians’ RTT and CTT (N = 721) were not statistically significant in all regions except for Calgary.
Figure 2 shows that at shorter travel times, active commuters (pedestrians and cyclists) perceive their commute travel time to be longer than calculated. However, it is the opposite case for longer travel times. Overall, for active commuters, the mismatch is generally negligible (small overall MD, 1 minute for walking and -2 for cycling).
For transit users, as CTT increases, we observe a decreased mismatch between CTT and RTT, with an overall MD of -5.26 minutes (longer RTT than CTT). Similar to transit users, drivers display a statistically significant mismatch between CTT and RTT. Drivers have an overall MD of -5.90, with minimal variation across subgroups. These findings show that transit users and drivers systematically round up RTT by five minutes, which is consistent with the first analysis.
These results suggest that the differences between RTT and CTT are negligible for pedestrians and that Google Maps API provides a reliable representation of real-world experiences of travel times for this mode. The API also reasonably approximates RTT for cycling, but there is a slight mismatch at shorter travel times. This may be due to cyclists including pre- and post-trip activities (e.g. unlocking and locking the bicycle) in their RTT. We conclude that Google Maps API estimates approximates walking and cycling travel times, but researchers should consider the length of trip times when making this approximation.
Conversely, a clear mismatch exists between reported and calculated travel times for those using public transit or driving to work, by around 5 minutes. We recommend that researchers and practitioners add 5 minutes to calculated travel times for both modes, especially when examining door-to-door travel times, to better reflect real-world commuting experiences.
ACKNOWLEDGMENT
This research is funded by the Social Sciences and Humanities Research Council of Canada (SSHRC 435-2024-0010).