
1. Questions
The use of mobile phone data for studying tourist mobility has emerged as a key tool in research on visitor tourist flows (Qian et al. 2021) and destination dynamics (Chantre-Astaiza et al. 2019). The high penetration of mobile devices and their ability to generate geolocated data enable a detailed analysis of tourist mobility patterns, overcoming the limitations of traditional methods based on surveys or administrative records.
Mobile phone data provide accurate information on the origin and destination locations of trips (Ahas et al. 2007), enabling the construction of origin-destination matrices with high spatial and temporal resolution. With these data, it is possible to generate valuable indicators on tourist mobility, such as the frequency of visits to different destinations (Nilbe, Ahas, and Silm 2014), the duration of stays (Xu et al. 2021) and the variability of flows during different periods of the year (Ahas et al. 2007).
In addition to analysing the influx and temporal patterns in tourist destinations, mobile phone data allow for the characterisation of tourists’ income profiles based on their place of residence. This enables detailed studies on the social composition of visitors, identifying differences in mobility according to variables such as income level in their places of origin. Although the demographic analysis of tourists who frequent certain destinations is not new in the literature (Monz, et al. 2021), studies with a sufficient detail on the income levels of visitors’ places of origin have not been developed until now. Previous studies have addressed this issue by considering only variables such as nationalities or origin according to large regions. To date, no analysis has been identified that examines the origin of visitors on an intra-urban scale and relates it to the income level of their residential areas. This information is especially relevant if we consider that in urban centres there is a marked tendency towards income-based segregation, which can significantly influence mobility patterns and the choice of tourist destinations. Thus, income-based spatial inequality differentiation within the city is transferred to tourist destinations.
In the present study, we pose two research questions:
Q1) To what extent do different areas of the city show a preference for certain tourist destinations? How does internal segregation in the city translate into the choice of tourist destinations?
Q2) How can we use mobile phone data and spatial analysis to measure the relationships between urban segregation and tourist destinations?
Both questions are motivated by the following hypotheses:
H1) Income residential segregation within the city is reflected in differentiation in the choice of tourist destinations.
H2) Consequently, more elitist destinations attract populations with higher income levels, who live in very specific areas in their city of origin.
Understanding the degree of specialisation of a territory in certain tourist destinations is a useful tool for improving the commercial strategies of destination places.
2. Methods
In this study, mobile phone data provided by Kido Dynamics in collaboration with one of the country’s main operators, covering over 20% of the market, have been analysed. These data have allowed us to understand how tourists travel from Madrid to the rest of Spain (Condeço-Melhorado et al. 2024). The data used comes from anonymous records generated each time a mobile phone connects to the network, whether to make a call, send a text message (CDR), or access the Internet (DDR). Although these data do not indicate the exact location of the users, they do show which telephone antenna they connected to, facilitating the study of mobility patterns.
Using this information, tourist trips made by residents of Madrid to various national destinations during the month of August 2021 have been reconstructed. August is the main holiday month in Spain. To consider a trip as touristic during this month, the criterion established was for those users who stayed a minimum of two nights in a destination other than Madrid.
After collecting the information, the data were scaled to represent the entire population of Madrid and organised into origin and destination matrices. Given that the initial location of trips is based on telephone antennas, it was necessary to reference these data to administrative units. The origins of the trips were grouped at census tracks, and these were again group to bigger regions similar to the neighbourhood level within Madrid, ensuring a minimum size to protect user privacy. In total, 179 neighbourhoods were defined within Madrid. Destinations were grouped by municipalities or sets of municipalities in less populated areas, totalling 650 destinations across Spain. International travel has not been considered in this study.
In this study, we have selected only two destination municipalities: Marbella and Torremolinos. These are two cities located on the Mediterranean (on the so-called “Costa del Sol”), relatively close to each other, and traditionally characterised as sun and beach tourist destinations. While some trips from Madrid to Marbella and Torremolinos in August may be work-related, the strong seasonality and peak visitation during this month indicate that the vast majority are leisure and tourism trips.
Marbella and Torremolinos present very different socioeconomic characteristics. Marbella exhibits significantly higher hotel pricing (average €300 per night, “Barómetro hotelero de Cushman & Wakefield y STR” 2024") and a distinctly upscale accommodation offering. In contrast, Torremolinos provides a wide range of hotels at mid-range prices (around €150–175 per night), more family-oriented, and budget-conscious tourist segment. These distinctions reflect a clear socio-economic contrast between the two destinations.
The data have been analysed based on two indicators. Firstly, the location quotient (LQ) has been calculated to assess the degree of specialisation of each of the neighbourhoods in the selected tourist destinations (Marbella and Torremolinos).
The indicator has been calculated for each neighbourhood i, as:
\[{CL}_{i} = \frac{\frac{X_{i}}{\sum_{\mathstrut}^{\mathstrut}X_{i}}}{\frac{Y_{i}}{\sum_{\mathstrut}^{\mathstrut}Y_{i}}}\]
Where:
is the total number of trips to the destination (Marbella or Torremolinos) from neighbourhood i.
is the total number of trips to the destination (Marbella or Torremolinos) from all neighbourhoods in the study area
is the total number of trips to all destinations from neighbourhood i
is the total number of trips from all neighbourhoods to all destinations.
A value of 1 indicates that the distribution of trips to the analysed destinations (Marbella and Torremolinos) is proportional to the distribution of trips to the rest of Spain, and therefore there is no specialisation in these tourist destinations. Values above 1 indicate that neighbourhoods have a higher concentration than expected according to the total number of trips made. Neighbourhoods with values of 1.5 generate 50% more trips than expected given the total number of trips made by that neighbourhood. The higher the value, the higher its degree of specialisation towards a tourist destination will be. Conversely, values below 1 would indicate a lower-than-expected specialisation towards that tourist destination.
The results of the indicator have been mapped to represent the spatial variation of its values among the neighbourhoods in the study area. Additionally, a second indicator has been estimated to analyse the degree of concentration or dispersion of these location quotients. Specifically, the Theil index has been calculated, which is an entropy measure used to evaluate inequality in the distribution of a variable. In our case, it allows us to analyse the inequality in tourism specialisation towards the destinations of Marbella and Torremolinos. This index (T) is calculated for each origin (neighbourhood) as:
\[T = \ \frac{1}{N}\sum_{i = 1}^{N}\left( \frac{x_{i}}{\overline{x}}\ ln\frac{x_{i}}{\overline{x}} \right)\]
Where
is the location quotient of neighbourhood i
N is the total number of neighbourhoods.
is the average of the location coefficient of all neighbourhoods.
In a situation of equity or equality of tourist specialization, the Theil index will have a value of 0. The higher its value, the greater the inequality in tourist specialisation among the neighbourhoods in the study area.
Furthermore, the weighted mean and standard deviation have been calculated for the location quotient values of Marbella and Torremolinos. The weighting factor has been the total number of trips from the origin neighbourhoods to each of the tourist destinations. From the mean and standard deviation, the coefficient of variation has been calculated, another indicator that allows us to analyse to what extent the degree of specialisation in the study area behaves unequally.
3. Findings
In 2021, Spain was recovering from the 2020 pandemic, and tourist flows were intensifying, returning to a situation similar to that existing in 2019 (Condeço-Melhorado et al. 2024). Residents of the municipality of Madrid made a total of 3,510,432 tourist trips to national destinations in August 2021. Marbella and Torremolinos were two of the most important destinations. Marbella received more trips than Torremolinos (Figure 1); however, its location quotient of 1.33 indicates a higher concentration of trips in some areas of Madrid city. In contrast, Torremolinos had a more balanced spatial distribution of trips made by city residents.
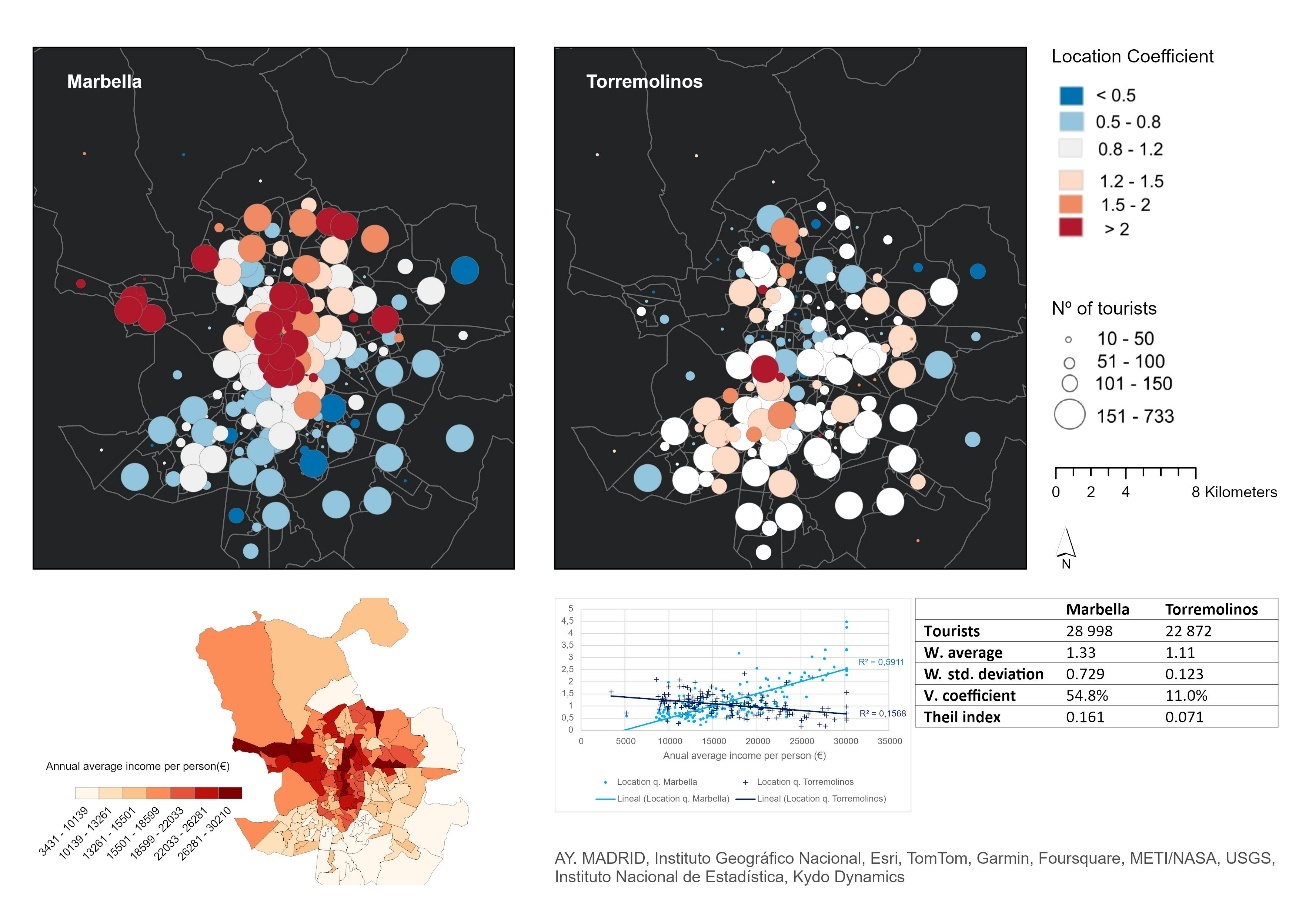
The mapping of the location quotient (Figure 1) shows the places of greater specialisation for the two chosen tourist destinations. The most specialised neighbourhoods in Marbella align with the privileged environment of Paseo de la Castellana, characterised as the residence area for the upper-middle and upper classes of the city. We also find greater specialisation among the residents of neighbourhoods like Sanchinarro or Aravaca, again affluent areas of the city. In contrast, the low specialisation in this destination is very noticeable in the south of the city, an area inhabited by middle classes and working-class population. The distribution of average income by census sections (bottom map in Figure 1) facilitates the comparison between the indicator values and the income levels we are discussing. The degree of specialisation is very different in the case of the tourist destination of Torremolinos. Madrid residents who holiday there are more evenly distributed across the city, and high values of the indicator are not observed beyond a few isolated neighbourhoods. The relationship between tourism specialization and income distribution can be quantified through the analysis of bivariate correlations (Figure 1). A stronger correlation is observed between the location quotient and income in the case of Marbella (R² = 0.59), suggesting that the economic profile of tourists significantly influences the destination’s specialization. In contrast, in Torremolinos, income only explains 15% of the variability in tourism specialization, indicating a lower dependence on this factor.
The tourist specialisation towards Marbella shows a much higher concentration in some neighbourhoods than the one observed in Torremolinos, as demonstrated by the standard deviation and the coefficient of variation. This is also confirmed when we analyse the Theil index, which registers a higher value indicating a greater inequality in the specialization of trips to Marbella, resulting from a higher concentration of trips in certain areas of the city. In contrast, trips to Torremolinos have a more homogeneous distribution, with lower values in all the indicators analysed, because they originate from a wider variety of places.
This study demonstrates the value of mobile phone data for analysing tourist mobility, identifying specialization patterns within the city of Madrid that reproduce internal segregation in their holiday destinations. These findings can guide promotion strategies and tourism management adapted to visitor profiles, optimising the distribution of resources and infrastructure for more efficient tourism development.
Acknowledgments
The authors would like to thank Kido Dynamics for the data provided and their processing. This article was supported by Grant TourMobility (PID2021-127499OB-I00) and Grant DynCity (PID2023-148339OB-I00) funded by MICIU/AEI/10.13039/501100011033/ and by “European Union FEDER and FSE+”.