

1. Questions
Active road users include cyclists, skateboarders, and scooter riders. Providing space and safety for these users requires knowing how many of them are using the roadways. Existing counting systems for non-motorized users are typically focused on bicycles, however. Data on scooter use relies on shared e-scooter companies (e.g., NACTO 2024; Dibaj et al. 2021; Weschke, Oostendorp, and Hardinghaus 2022; Wang et al. 2022), overlooking both privately-owned e-scooters and skateboards. Skateboards are rarely considered transportation modes (Fang and Handy 2019).
We advance an innovative counting technique using inexpensive wildlife cameras, allowing us to separately count bicycles, scooters, and skateboards. Camera-based counting offers versatility and large scale at a low price point. This type of data can be helpful to identify sore points where infrastructure is insufficient to support safe bicycling and micromobility use.
We demonstrate this counting technique in the Tempe, AZ context, asking: 1. What is the modal split between bicycles, e-scooters, and skateboards? 2. How do the relative volumes of these modes differ across locations and times of day?
2. Methods
Study Area
The study was conducted in Tempe, AZ, a mid-sized city in the Phoenix Metropolitan Area home to Arizona State University (ASU). Tempe’s population is 180,587 (United States Census Bureau 2020), and ASU’s Tempe campus serves more than 50,000 students (Arizona State University 2024). We counted cyclists, e-scooter users, and skateboarders for a 24-hour weekday in November 2023 at 25 locations in North Tempe, where the university is located. Tempe is a bicycle-friendly community with over 220 miles of bikeways, earning gold status from the League of American Bicyclists in 2023 (City of Tempe 2023). While there are shared e-scooters in Tempe, there are also many privately-owned e-scooters.
Counting with cameras
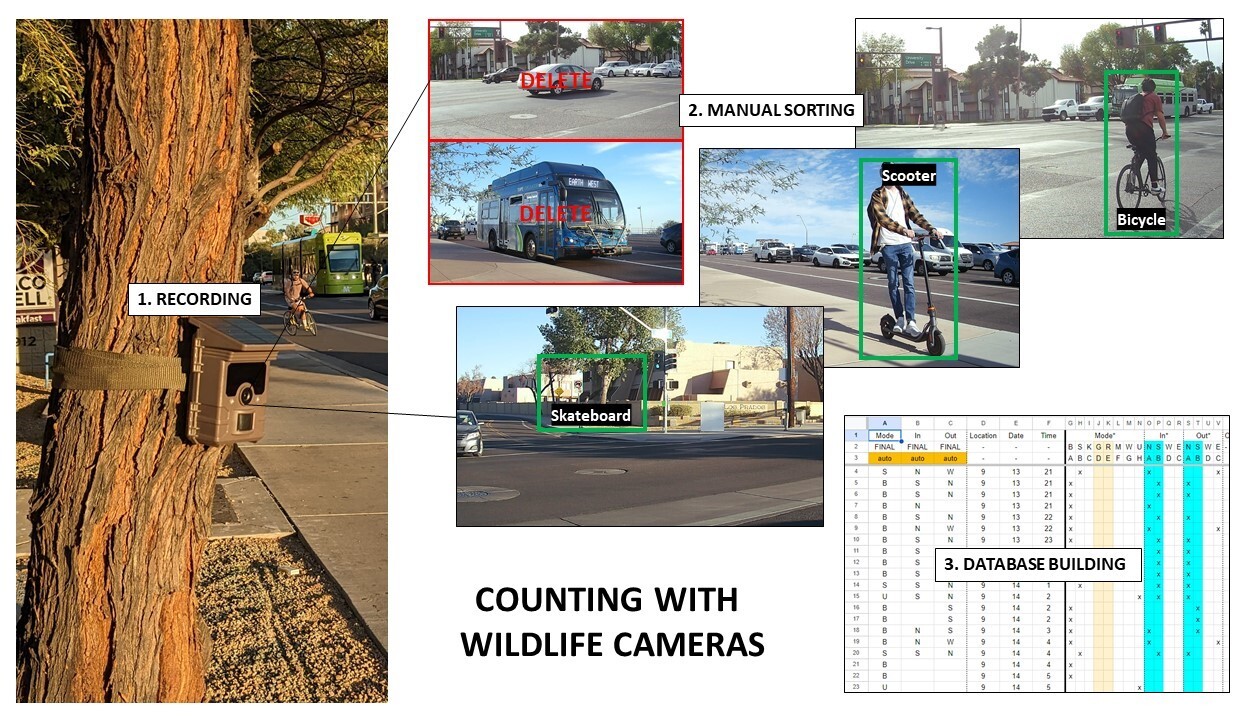
To obtain 24-hour counts of bicycle and micromobility use, we recorded street activity using inexpensive motion cameras typically used to photograph wildlife (Voopeak TC02). Similar wildlife cameras have been used successfully to count human visitors on trails (e.g. Mitterwallner et al. 2024). These cameras took time-stamped photographs of the street whenever they detected motion. They are equipped with a lithium-ion battery, auxiliary AA batteries, night vision, and a small solar panel to allow operation over a long period. The cameras were attached with simple straps to convenient poles and trees in the study locations. We transformed photos into counts by manually reviewing them (Figure 1), using photo timestamps to ensure that we were counting each person only once.
Placement
We identified 30 locations to place the cameras in three rounds of camera deployment spanning the month of November 2023, with 25 final locations (five cameras were unusable due to theft, tampering, or malfunction). Cameras were placed strategically along streets that capture a majority of citywide bicycle trips, following the “Targeted” counter placement method outlined in NCHRP Report 797 (National Academies of Sciences, Engineering, and Medicine 2014). Biking in Tempe is concentrated along a few important collector streets, making this approach useful.
Limitations
The count locations for this project have varying accuracy due to camera trigger distance, recovery time, and power loss. Some roads were too wide for cameras to be reliably triggered by bikes or micromobility traveling in the opposing direction. In almost all locations, cars and trucks were the main triggers for the cameras. Whenever motion was detected, the cameras were set to take two photos, two seconds apart. The cameras were then in “recovery mode” for 5 seconds and unable to take photos. Finally, despite multiple power sources for the cameras, some of them were not able to record a full 24 hours (see Supplemental Materials for details). In these cases, we directly extrapolated partial hour counts to the full hour (i.e. count*60/minutes), leaving uncounted hours at zero. Since the raw values are undercounts, our findings focus on the distribution of activity by mode, location, and time.
3. Findings
Modal split
Bicycles represent 65.8 percent of our traffic counts, scooters 25.2 percent, and skateboards 7.0 percent (Table 1). Almost all recorded scooters were e-scooters, evidence of their popularity in North Tempe. This may be because riders find e-scooters more comfortable than either biking or walking, especially when the weather is very hot – which happens often.
Traffic volume and modal split across locations
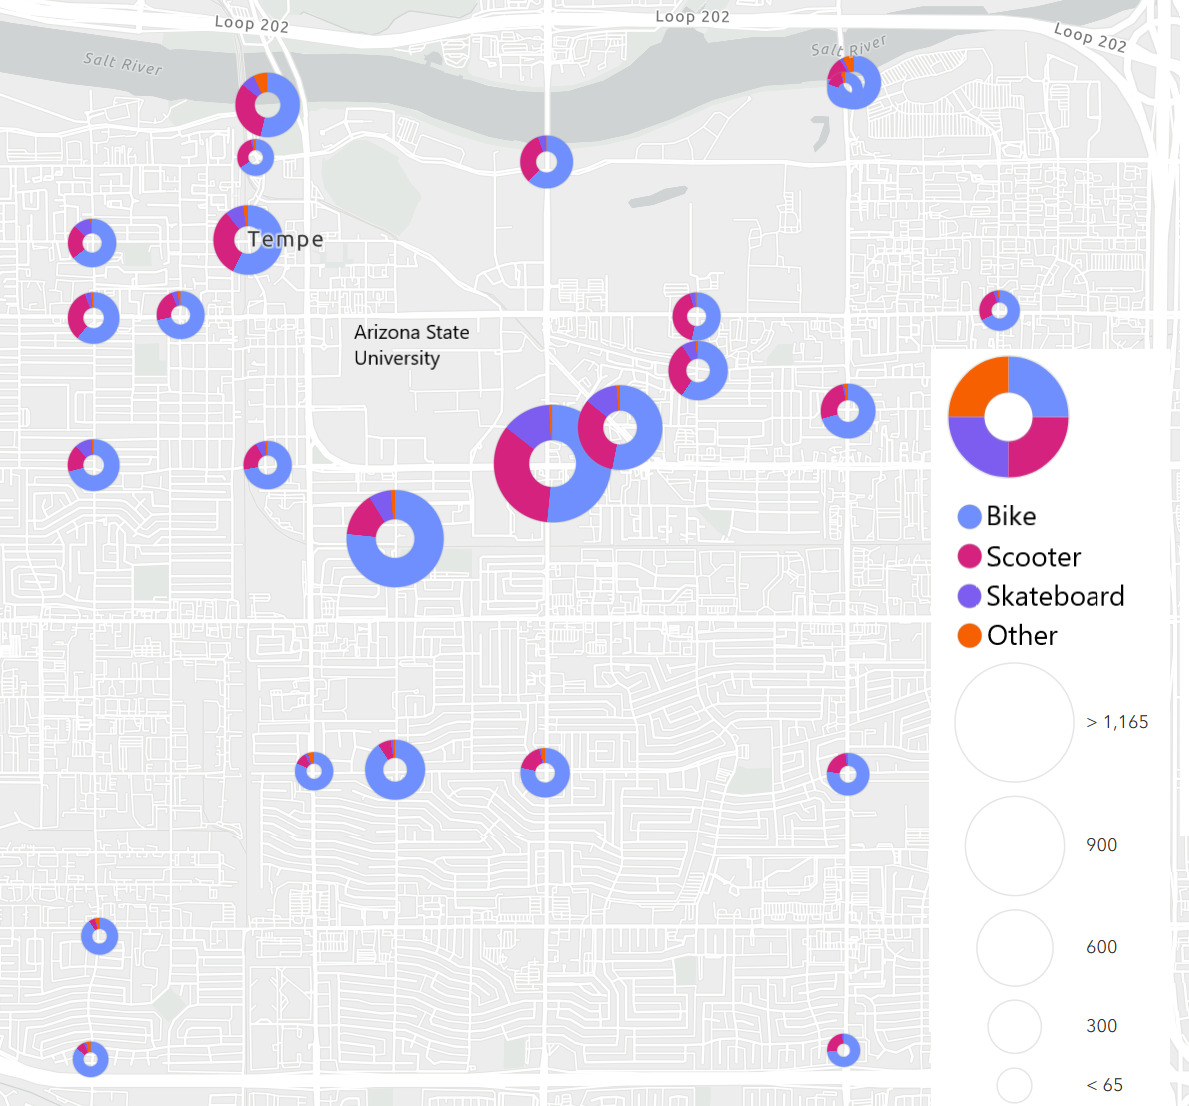
Figure 2 shows the distribution of bicycle, scooter, and skateboard traffic in the study area. The greatest total counts were at an intersection in the Southeast corner of the ASU campus area (Apache Blvd and Rural Rd). Surprisingly, we found relatively little traffic in the downtown area where amenities are concentrated, and along the river where bicycling infrastructure is high-quality.
Figure 2 also shows the modal splits recorded at different camera locations. These suggest that the use of skateboards is limited to the Downtown area where ASU is located, whereas bicycles are found across the study area. Scooters are found across the study area as well, although in larger shares near Downtown.
Modal split across time of day
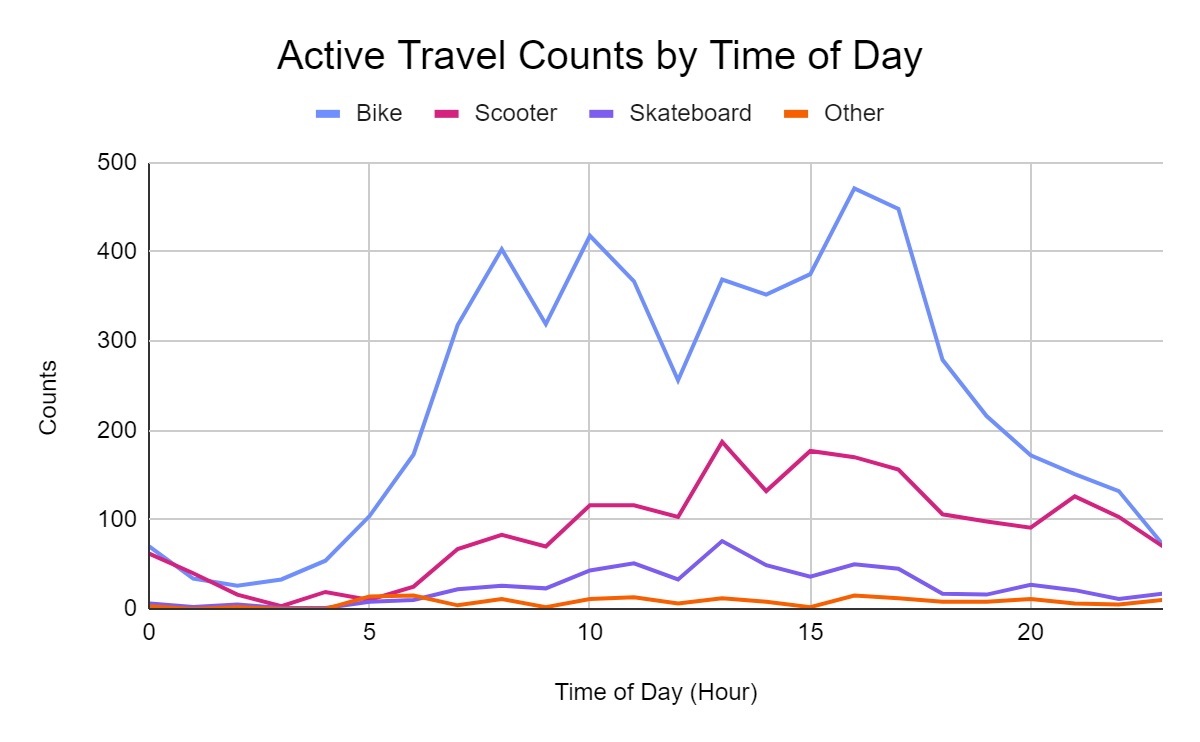
Figure 3 shows the times of use of each travel mode over the course of a day. Cycling counts start earlier and follow a bimodal distribution, suggesting that bicycles are used more for commuting. In contrast, the time use pattern for scooters is relatively flat from morning through midnight.

Understanding how existing infrastructure is being used, including where and when, can inform decision makers about needed investments. Including micromobility in active road user counting is important. For example, the location with the largest overall counts in our study is a rather dangerous intersection, where an eight-lane road (Rural Rd) crosses a five-lane boulevard (Apache Blvd) (aerial photo in supplemental materials). Only the boulevard has (unprotected) bike lanes. Counting only cyclists at this intersection does not fully capture the true level of risk.
One major limitation of our method is that it is labor intensive to sort the photos. This can be automated using artificial intelligence and computer vision to improve accuracy and efficiency (see Supplementary Materials for more information).
Acknowledgements
Thanks to the Zimin Foundation at Arizona State University for their support of this work as part of a larger project about bicycling in Tempe, Arizona.