1. QUESTIONS
Sports utility vehicles, or SUVs, have become increasingly popular in recent years: as of 2023, SUVs made up 48% of new car sales globally, up from 15% in 2010 (IEA 2024). These larger vehicles consume more resources to manufacture, take up more space when parked, and on average produce more pollution when driven. A growing number of cities across the world are therefore seeking to discourage the proliferation of larger vehicles, through measures such as parking surcharges (Goodman et al. 2025).
One potential rationale for seeking to discourage SUVs relates to road danger. A recent systematic review found that, in the case of a crash, being hit by an SUV was associated with more severe injuries to pedestrians and cyclists than being hit by a passenger car (Robinson et al. 2025). Most of this evidence came from the USA, however, where vehicle design standards are weaker than in Europe with regards to pedestrian safety. In the present study we examine for the first time whether being hit by an SUV, as opposed to a passenger car, is associated with more severe injuries for pedestrians and cyclists in Great Britain.
2. METHODS
We used police-reported Stats19 road traffic crash data for Great Britain for 2004-2023. Alongside the open access police data, we requested the data fields of vehicle make, model and registration year, which we used to look up the vehicle’s body style, kerb weight, height and length. This look-up used manufacturer-reported body style and dimension data compiled by Vehicle Data Global Ltd (https://vehicledataglobal.com).[1] Where vehicle dimensions varied within a given make/model/year, Vehicle Data Global Ltd provided us with the current average value (e.g. the mean kerb weight) amongst all vehicles registered in the UK in February 2025.[2]
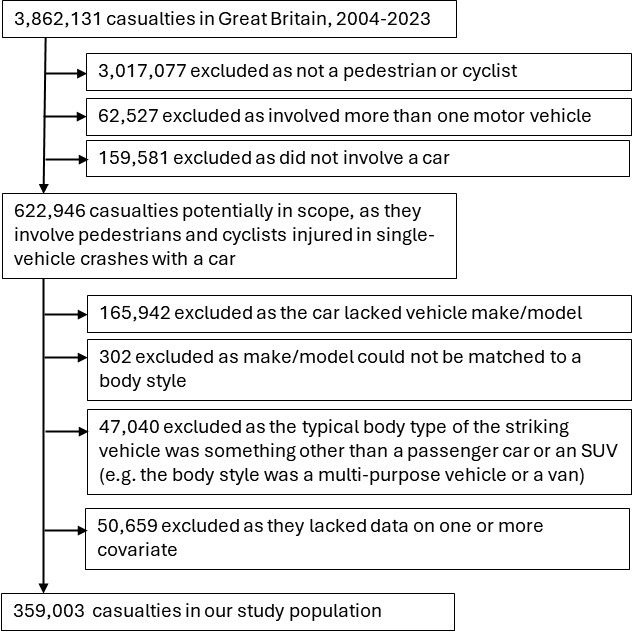
We restricted our analysis to pedestrian and cyclist casualties in crashes that involved a single car and no other motor vehicles. As shown in Figure 1, we excluded casualties where a valid make and model of the car was not recorded in Stats19, where the body style of the striking vehicle was something other than a passenger car or an SUV, or where data was missing on one or more covariates. This left a study population of 359,003 casualties, who are described in Table 1.

We used two binary outcomes: fatal vs non-fatal injury; and killed and seriously injured (KSI) vs slight injury. Our primary exposure of interest was whether the striking vehicle was a passenger car or an SUV. Additional analyses used the weight, height or length of the striking vehicle as an alternative exposure of interest. We did this to inform policy decisions around which metric to use to define ‘large cars’ (Goodman et al. 2025). We examined these alternative exposures in separate models, i.e. including either SUV status or height or weight or length, but never more than one of these.
We tested a priori for interactions between SUV status and a) casualty age (0-9 years, 10-18 years, 19+ years);[3] b) casualty travel mode (pedestrian versus cyclist); c) urban versus rural status; d) year (as a continuous variable).
We first present minimally-adjusted models that adjust only for casualty travel mode, region of Great Britain and calendar year. We then present fully adjusted models that adjust for all the covariates shown in Table 1. All analyses used Stata/SE 18.5.
3. FINDINGS
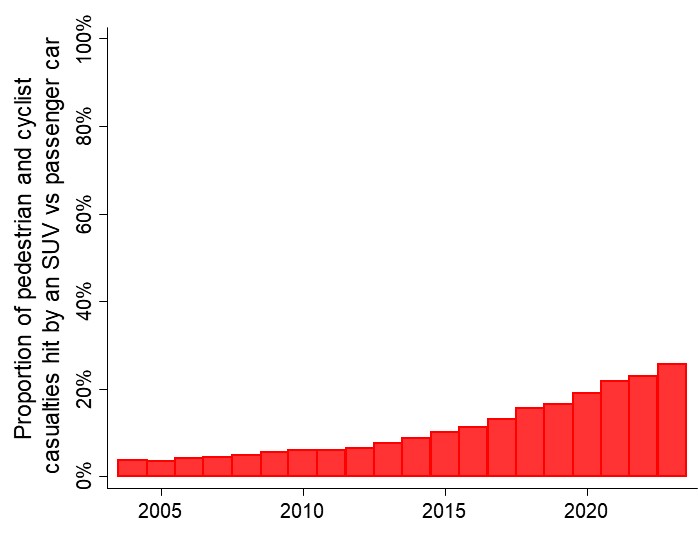
From 2004-2023 in Great Britain, the proportion of pedestrian and cyclist car crash casualties that involved an SUV increased from 4% to 26% (Figure 2). Across that period, there was likewise an increase in the mean kerb weight (+20%), height (+6%) and length (+3%) of the cars involved in these collisions.
__for_pedestrian_and_cycl.jpeg)
There was strong evidence for an interaction between SUV status and casualty age category (p<0.001 for interaction in adjusted models in relation to both KSI/slight and fatal/non-fatal outcomes). We therefore present all our analyses stratified by age, choosing the overlapping age strata 0-9 years; 0-18 years; and 19+ years, to facilitate comparisons with a recent systematic review (Robinson et al. 2025). There was also an interaction between casualty travel mode and SUV status in relation to KSI injuries (p<0.001 overall; p<0.001 in adults; but p=0.94 in children), and we therefore additionally stratify our adult KSI results by mode. There was no evidence of an interaction with urban/rural status or year (p>0.05).
As shown in Table 2, the effect estimates for the impact of being hit by an SUV versus a passenger car increased upon adjustment for the variables in Table 1. This increase in the effect estimates was primarily driven by adjustment for vehicle’s age and driver’s age. On average, SUVs have a more recent date of manufacture than passenger cars, and SUVs are also currently more likely to be driven by middle-aged drivers rather than very young or very old drivers. Both factors are associated with reduced injury risk, meaning they act as ‘negative confounders’ in the minimally-adjusted analyses.
After adjusting for covariates, there was evidence of a modest increase in the odds of fatality for adult pedestrians and cyclists, if hit by an SUV versus a passenger car (odds ratio 1.14, p=0.02). There was also evidence of a modest increase in the odds of a KSI injury for adult cyclists (odds ratio 1.11, p<0.001), but no evidence of an effect for adult pedestrians (odds ratio 0.97, p=0.25). These effect sizes were all smaller than those obtained in a recent systematic review, which drew mainly on data from the USA (Robinson et al. 2025).
For child pedestrians and cyclists, being hit by an SUV versus a passenger car was associated with a larger increase in the odds of fatality and KSI in adjusted analyses (odds ratio 1.77, p<0.001, for fatality; odds ratio 1.18, p<0.001, for KSI). These effects were particularly large in young children (odds ratio 3.09, p<0.001, for fatality; odds ratio 1.35, p<0.001, for KSI), and were similar to those documented in the two comparable studies from the USA in the recent systematic review.
As of 2023, these effect sizes translated into population attributable fractions ranging from 3% to 35% (Table 2). These fractions capture the proportion of car crash fatalities/injuries that one would be expected to be averted in Great Britain if all SUVs were replaced with passenger cars.
Finally, we examined injury severity in relation to the dimensions of weight, height and length (Table 3). We found a strong, dose-response associations with weight and height, but at most a weak association with length.
We conclude that in Great Britain, being hit by an SUV as opposed to a passenger car increases injury severity among pedestrians and cyclists, with the strongest effect in children. This effect is well-captured by the dimensions of weight and height, but not by length.
ACKNOWLEDGEMENTS
This study received ethical approval from the London School of Hygiene and Tropical Medicine (ref 31606). We are grateful to Tony Percival and colleagues at Vehicle Data Global Ltd for performing look-ups of body styles and dimensions based on vehicle make, model and registration year. The researcher time on this work was unfunded, but we are grateful to Clean Cities and to the Rees Jeffreys Road fund for contributing towards the cost of data matching by Vehicle Data Global Ltd, and to Ruth Carlson in helping to arrange the Rees Jeffreys Road contribution.
Vehicle Data Global Ltd also compiles manufacturer-reported information on vehicle width. We did not use this data in the present study, however, as we identified that the Vehicle Data Global Ltd width data was not of a consistent type. Instead, Vehicle Data Global Ltd typically recorded the width including wing-mirrors but sometimes recorded the width excluding wing-mirrors.
The Stats19 dataset includes weight data on some vehicles, obtained via a look-up of their numberplate to the information held on the vehicle’s log book. The proportion of missing data is, however, very high: 63% missing for unladen weight in our sample, and 82% missing for gross weight. In addition, the weight data held in Stats19 included some clear errors (e.g. unladen weights ranging from 100kg to 44,000kg). We therefore instead examine the impacts of weight using the kerb weight data returned by Vehicle Data Global Ltd, which is only missing for 2% of vehicles. We established that these two datasets were highly correlated (r=0.92 for gross weight, the metric available in both datasets).
We stratified into these three non-overlapping age groups when testing for interactions. In our main analysis, however, we present the overlapping age groups of 0-9 years and 0-18 years, to facilitate comparisons with a recent systematic review.