

1. Questions
Safety concerns limit the amount of walking in urban transport (Carlson et al. 2019; Frank et al. 2006; Giles-Corti et al. 2016; Tzouras et al. 2025; Paraskevopoulos, Tsigdinos, and Andrakakou 2020). Previous research has focused on the “Safety in Numbers” (SIN) phenomenon, suggesting that higher pedestrian numbers enhance the safety conditions of a street or intersection, in part due to increased visibility of pedestrians to motorists (Murphy, Levinson, and Owen 2017; Leden 2002; Jacobsen 2003; Bhatia and Wier 2011; Elvik 2009).
This contrasts with our proposed “Numbers in Safety” (NIS) concept, which focuses on the inverse relationship, also shown in Figure 1, examining how pedestrians respond to changes in safety. It is based on the hypothesis that people are more likely to walk when streets are believed to be safer, and when walking, people prefer safer streets or intersections while avoiding those perceived as unsafe, often highlighted through media coverage or visible cues (Zhuang and Wu 2011). Some recent studies have noted how suppressed active transport trips reflect a proactive response to perceived safety risks embedded in street design and infrastructure (Ferenchak and Marshall 2020, 2025).

This study tests the NIS hypothesis by investigating how pedestrians respond to changes in safety at urban intersections in Melbourne. The key research questions are as follows:
-
What is the correlation between changes in safety and pedestrian numbers?
-
What is the elasticity of this relationship?
2. Methods
We first test the Safety in Numbers (SIN) effect using a log–log linear regression model, to evaluate the changes in safety in response to changes in pedestrian numbers (Murphy, Levinson, and Owen 2017). We next examine the Numbers in Safety (NIS) effect using a linear regression, where pedestrian numbers are estimated based on lagged changes in safety, capturing delayed behavioural responses. The analysis uses open-source data from the City of Melbourne (DataVic 2024; City of Melbourne 2024), covering 21 intersections and 210 observations across six years (2014–2019), as shown in Figure 2.

2.1. Data preparation
2.1.1. Changes in safety
To track changes in safety, this study uses road crash statistics from the Victorian government (DataVic 2024). Crashes involving at least one injured pedestrian within the study area are assigned to the nearest intersection if they occur within a 50 m radius, as shown in Figure 3. The year-on-year change in safety with a lagged effect at an intersection is calculated as:
ΔCi,t−l=Ci,t−l−Ci,t−l−1
where;
-
is the change in crashes for intersection during year measured in years),
-
is the number of crashes for intersection during year
-
is the number of crashes for intersection during year
-
represents the lag in years

2.1.2. Pedestrian numbers
Pedestrian counts reported from the City of Melbourne’s Pedestrian Counting System (City of Melbourne 2024) track the pedestrian numbers across intersections. This dataset is checked for outliers and inconsistencies before analysis, revealing the following issues:
-
Missing data from newly installed sensors.
-
Unusual pedestrian count variations due to sensor malfunctions.
-
Irregularities from temporary road closures (e.g. for the Metro tunnel project).
To correct these discrepancies (affecting 21% of records), a recursive time-series model is used to estimate missing or inconsistent data. The model uses fully operational sensors to establish a trend equation with strong statistical significance = 0.80, MAPE = 2.59%). The trend equation is as follows:
Sr,(t+Δt)=Sr,t+(151161.33)Δt
where;
-
is the number of pedestrians at sensor during year
-
is the number of pedestrians at sensor during year
-
is the sensor location of the observation.
Pedestrian numbers at each intersection are then determined by aggregating the average directional pedestrian counts from sensors in all connected road segments, as shown in Figure 3, using the following equation:
Ni,t=∑j∈Ji,d∈D(∑r∈Rj,dSr,t|Rj,d|)
where;
-
is the number of pedestrians at intersection during year
-
is the number of pedestrians at sensor during year
-
is the set of roads connected to intersection
-
is the set of directions being considered.
-
is the set of sensors in direction on road
-
is the number of sensors in direction
Across the panel, per intersection, pedestrian numbers had a mean of 20.1 million (SD = 6.8 million), while the changes in pedestrian crashes ranged from –2 to 1, with a mean of –0.22 (SD = 0.81).
2.2. Model development
For the SIN model, a log–log linear regression model estimates per-pedestrian crash risk (Per-pedestrian crash risk = as a function of pedestrian numbers To investigate the NIS relationship, a separate linear regression model estimates pedestrian numbers based on lagged changes in safety and previous-year pedestrian numbers as illustrated in Figure 4.

Given the structure of the data set, where the data span multiple intersections and years a Panel Regression (PR) approach is selected over traditional cross-sectional regression to develop the NIS model. PR models effectively account for entity-specific and time-specific variations, reducing bias from any unobserved heterogeneity (Wooldridge 2010; Baltagi 2021).
A Hausman test guides the model specification, comparing fixed versus random effects based on whether unobserved effects correlate with model variables. The test supports a random-effects model, adopted here with equation 4:
Ni,t=β1⋅ΔCi,t−l+β2⋅Ni,t−1+ε+Z
where;
-
is the year-on-year change in crash occurrences for intersection during year
-
represents the random or fixed effects,
-
and represent the coefficients,
-
is the error term.
3. Findings
Figure 5 illustrates a clear cross-sectional inverse relationship between pedestrian numbers and per-pedestrian crash risk, indicating that higher pedestrian numbers are associated with lower per-pedestrian crash risk, supporting the Safety in Numbers (SIN) hypothesis. The step-like appearance of the plot reflects the discrete nature of crash counts (typically ranging from 0 to 4) divided by comparatively continuous pedestrian numbers (averaging around 20.1 million). The visible alignment of points is likely driven by the temporal trend of increasing pedestrian numbers over time.

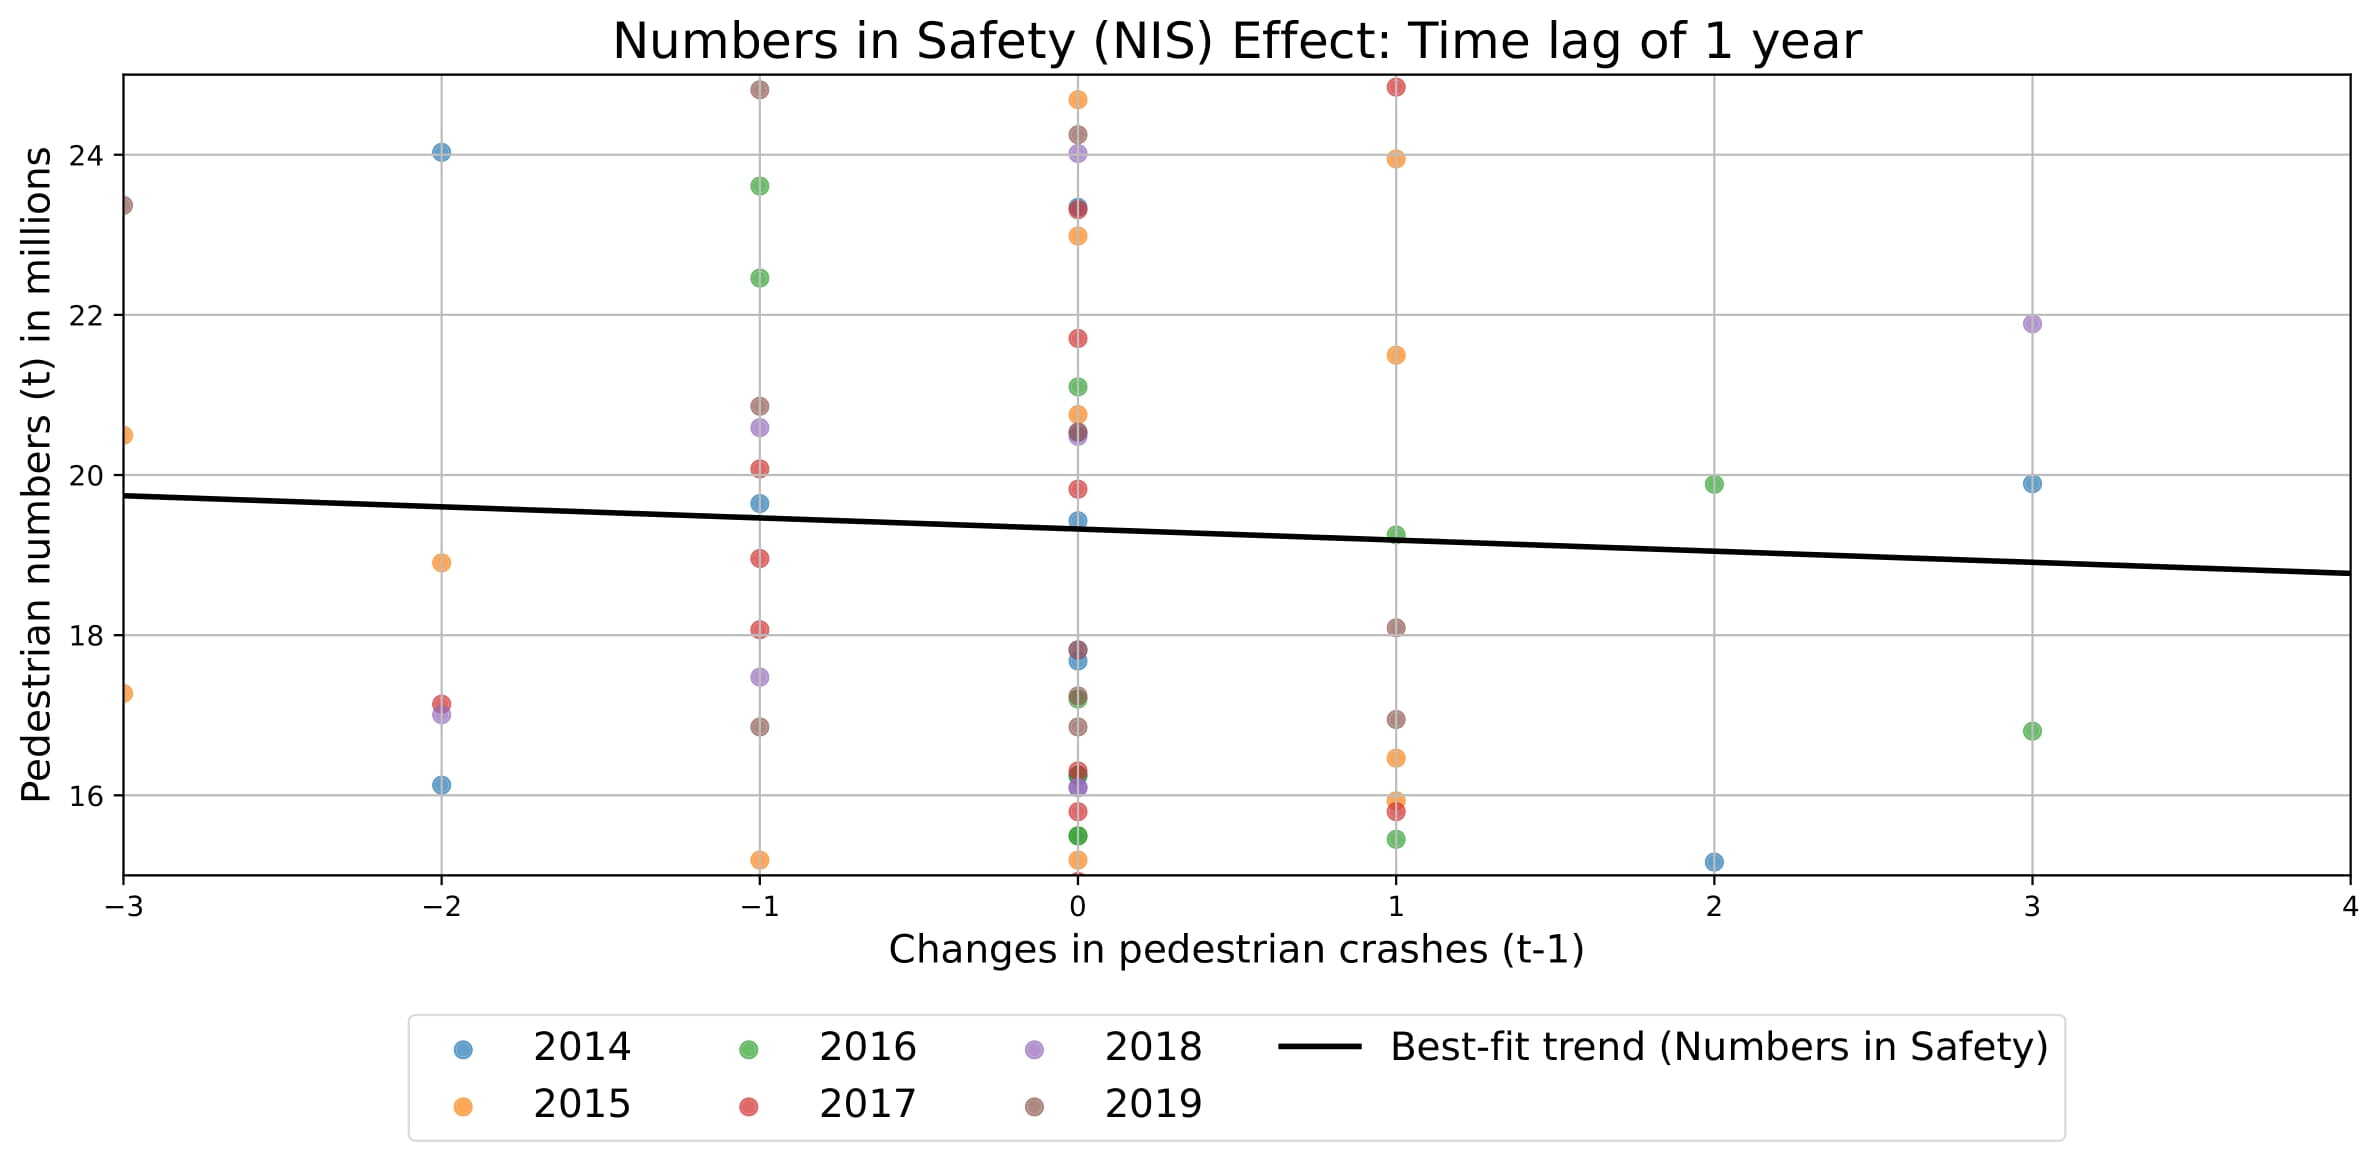
Figure 6 and Table 1 summarise the panel regression results for the Numbers in Safety (NIS) model using a one-year lag (Results for alternative lags were tested, but insignificant.) The model yields statistically significant coefficients An increase of one pedestrian fatal or serious injury crash at an intersection from the previous year leads to an estimated decrease of nearly 139,000 pedestrians in the following year. This is equivalent to a 0.69% drop relative to average foot traffic, indicating a small but measurable behavioural response to perceived changes in safety.
This negative and statistically significant correlation supports the NIS hypothesis, suggesting that pedestrians notice when streets are safer or less safe, and that pedestrians prefer safer streets and are averse to those perceived as unsafe due to safety changes influencing their route choices (Aceves-González et al. 2020; Basu et al. 2022).
The small elasticity could be attributed to the presence of major urban activity centres (employment hubs, educational institutions, transit stations, and shopping centres), along with limited alternative transport options (Kerr et al. 2016). This study area includes Melbourne Town Hall, Flinders Street Station, and La Trobe University, all of which attract significant pedestrian numbers.
The simultaneous validation of both NIS and SIN effects suggests a mutual relationship between safety conditions and pedestrian numbers, where higher pedestrian numbers contribute to lower crash risk, which improves safety conditions and attracts more pedestrians. Future work could explore these relationships using models that account for complex control factors such as intersection geometry, speed limits, or changes in traffic flows over time.
Acknowledgements
Partial funding has been provided by Tom Yim and the Summer Research Scholarship Program of the Faculty of Engineering at the University of Sydney.