


1. QUESTIONS
The COVID-19 pandemic is associated with dramatic falls in public transit (PT) ridership in North American cities (Liu, Miller, and Scheff 2020; Parker et al. 2021; Shamshiripour et al. 2020; Ziedan, Brakewood, and Watkins 2023). In Toronto, the total weekday average ridership among all the surface routes (buses and streetcars) for Toronto Transit Commission (TTC) was still 21% below 2019 levels in 2023[1].
This study explores how transit use shifts during system-wide shocks, highlighting essential workers as a vulnerable group whose needs must be prioritized in crisis planning and service design. Previous research has found differences in the rate of ridership declines for transit lines that serve essential workers, low-income households, people of color, and women (He et al. 2022; Hu and Chen 2021; Liu, Miller, and Scheff 2020). Despite evidence linking socioeconomic variables to ridership variations within the US context, little is known about these relations within Canada, giving rise to the following questions:
-
How sensitive is ridership loss to socioeconomic factors? What is the magnitude of this ridership loss?
-
How much of ridership retention is associated with essential workers?
2. METHODS
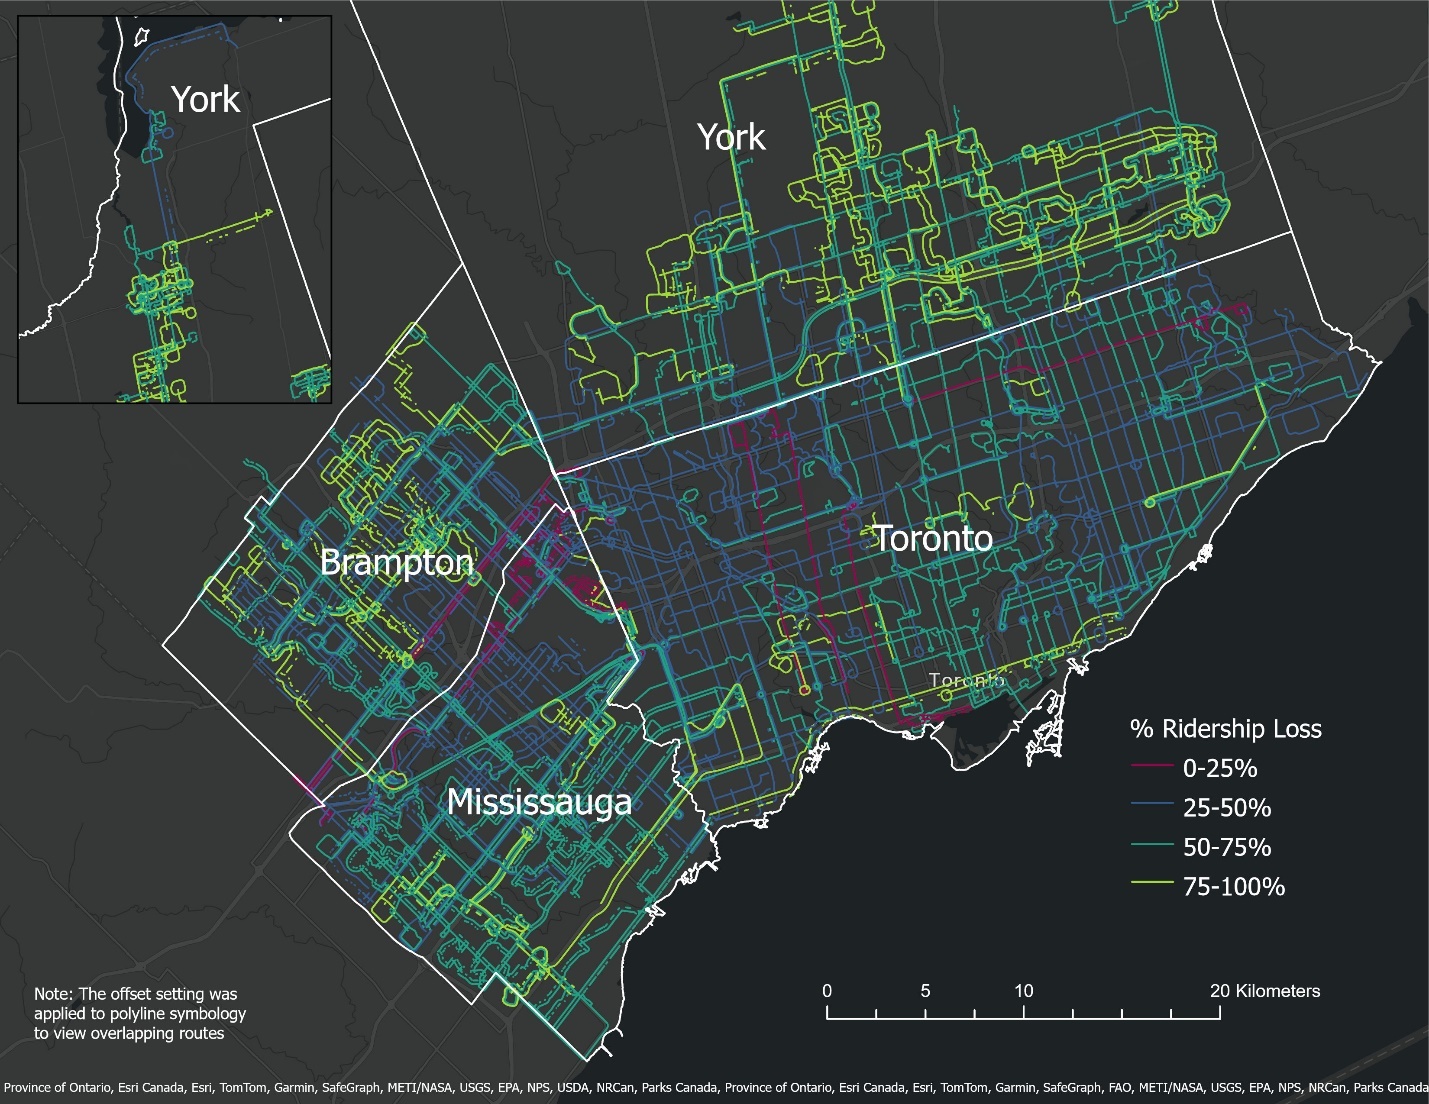
Our dataset consists of surface routes operated by TTC, York Region Transit (YRT), Mississauga Transit (MiWay), and Brampton Transit (BT) between 2019 and 2020.
The initial dataset of 393 observations was reduced to 333 comparable routes after applying the following exclusion criteria. First, routes that did not exist in both 2019 and 2020 were dropped (e.g. many express service routes were paused in 2020). Second, since the study focuses on factors driving ridership losses—by far the dominant trend during the pandemic—11 routes with ridership gains were excluded to maintain analytical consistency.
The final database was fused with data from the 2021 Census, General Transit Feed Specification (GTFS) feeds, and the transit operators. The 2021 Census data was spatially aggregated and summarized within a 400-meter buffer along the routes to capture their local socioeconomic context. The 2021 Census data was used because it was temporally proximate to the rest of the data, possibly introducing lag-related bias due to potential shifts socioeconomic conditions during the intervening period. The GTFS data was used to extract the geospatial lines for the respective routes. The transit operators provided route-level ridership estimates, which were unavailable at the stop-level.
Ridership loss is the diminished usage of public transit i.e., the percentage decrease in ridership between 2019-2020. We selected ridership loss as the dependent variable in our Beta regression model. Beta regression was deemed appropriate because ridership loss is continuous and bounded between 0 and 100%. The independent variables selected for our final model are represented in Table 1 with the regression results.
To calculate the count and percentage of essential workers in each transit line buffer, we borrowed the definition and methodology used by Transit Center (2021) for New York State. This methodology assigns an essential worker percentage for each NAICS (North American Industry Classification System) code. These percentages are then applied to employment counts by NAICS code, a variable in the Canadian Census.
3. FINDINGS
In the study area, there are 43% of essential workers, 76% people using a car as their main mode of travel, and 56% population identified as visible minority on average (Figure 1). There was an overall 61% average loss in ridership from 2019 to 2020 for the 4 transit operators mentioned above: 74% for YRT, 61% for BT, 54% for TTC, and 53% for MiWay (Figure 2).

The analysis reveals that several key socioeconomic factors were associated with transit ridership decline as shown in the regression results (Table 1). We assume that a higher ridership loss indicates that transit riders either suppressed their travel demand or switched to other modes of transportation, and a lower ridership loss indicates that transit users kept taking public transit even during the COVID-19 shocks. We recognize that route-level analysis obscures the large socioeconomic variability across the longer lengths of the routes that run through different neighborhoods, diluting neighborhood specific effects and resulting in possible biases. This is a source of error in the current analysis that could be rectified in future research that relies on individual survey data or stop-level ridership counts.
The percentage of essential workers and the population using car as the main mode of transport are highly statistically significant predictors for loss in ridership. Routes passing through areas with higher rates of essential workers experienced lower ridership loss or had a retention of ridership. Moreover, routes where the car was used as the main mode of transportation were associated with higher loss in ridership.
As per the marginal effects plot in Figure 3, the bus and streetcar catchment area’s demographic composition of 35% of essential workers is associated with about a 76% loss in ridership while 55% percentage of essential workers had a loss of about 43% in ridership.

The findings point to the fact that many essential workers are captive riders as opposed to choice riders. Choice riders may use transit but have access to other viable travel options or are “teleworkers” (Qi et al. 2023) while transit is essential for captive riders as a “critical lifeline” to access livelihoods (He et al. 2022; Taylor and Morris 2015), even during the pandemic with risky circumstances. The authors refer to this phenomenon as “dual essentiality”, individuals who are both essential workers and essential transit users. With fewer or no alternative travel options, reducing or ceasing public transit use is not a possibility (He et al. 2022), for people with dual essentiality.
This concept captures the compounded vulnerability experienced by individuals who must physically report to work in critical sectors and are simultaneously dependent on public transit as their only feasible travel mode. Dual essentiality emphasizes the intersection of occupational and mobility-based precarity.
Authors’ own calculations with data from the TTC website: https://www.ttc.ca/transparency-and-accountability/transit-planning