1. Questions
To promote sustainable mobility, it is crucial to develop cycling infrastructure in a targeted, evidence-based manner, particularly in urban areas. While cycling speed is undoubtedly influenced by individual factors such as bicycle type, travel purpose, physical ability, and personal attitudes, the question remains: To what extent do different types of infrastructure and their design parameters influence cycling speeds? This study addresses this question by analyzing open aggregated tracking data from the city of Hamburg (Germany), providing a data-driven approach to support informed decision-making in bicycle network planning and modeling.
2. Methods
Multiple open data sources are combined to estimate a gamma regression model, with infrastructure specific attributes as explanatory variables and the obtained cycling speed as dependent variable. A gamma model was used to account for skewness and non-negativity of speeds (McCullagh and Nelder 1989).
The first data source is a routable bicycle network with differentiated cycling infrastructure created by the city of Hamburg (BVM 2021). Each segment contains information on infrastructure type (e.g., bicycle path or shared roadway), surface conditions, length and width, and the direction of travel. If dedicated cycling infrastructure exists, shared roadway segments on the same road are omitted.
The second data source originates from DB Rad+ (DB InfraGO AG 2024), which collects cycling trajectory data from app users. These can exchange their kilometers traveled by bicycle for small rewards from local businesses, providing an incentive to participate. Since 2021, 4 million kilometers have been recorded in Hamburg. Based on this data, Hamburg provides aggregated data, including average speeds and bicycle volumes in route segments on an annual basis (BVM 2025). We used data for three consecutive years from 2022 to 2024. This aggregation of a large number of trips allows smoothing out individual measurement errors and outliers, and thus helps to reduce the impact of GPS noise and ensures robust average speed estimates.
Open land use (EEA 2021) and topographic data (LGV 2006) are used to account for land use and slope.
Spatial matching was required to link the bicycle network with the route segments of the speed data. To achieve this, only speed segments within a 5 meter buffer of the bicycle network were considered, and segments shorter than 10 meters were excluded to reduce areas of intersections and to eliminate potential buffer-induced artifacts. A nearest-neighbor spatial join was used to transfer attributes from the bicycle network to the speed data. Further, each segment was assigned the predominant land use by length. Since the speed data is not direction specific, the influence of slope was mitigated by excluding segments with an average slope greater than percent. Leading to a final data set of 91,083 speed segments for subsequent analysis. To ensure that the data is not distorted by segment length, but reflects the characteristics of the actual road network, all subsequent analyzes are weighted by the length of each network segment.
The entire analysis was conducted in R. The source code is available in the supplementary material.
3. Findings
Before presenting the findings of the gamma model in Table 2, descriptive results are shown. For both infrastructure and surface types, Table 1 shows the weighted median speed by segment length and provides information about the share per surface type for each type of infrastructure. A Cramér’s V of 0.39 indicates a strong relationship between the two variables. While shared roadways and dedicated cycling infrastructure are mainly made of bituminous surface, infrastructure also designed for pedestrians has mainly paving stones. The greatest variety of surface types is observed on bicycle paths, showing a broad mix of surfaces.
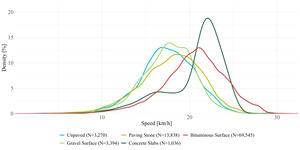
Figure 1 shows density plots of the observed speeds per surface type. Unpaved, Gravel Surface, and Paving Stone have fairly similar distributions with weighted median speeds ranging from 17.6 to 18.2 km/h (see Table 1). Concrete Slabs shows a distinct peak and the highest median speed, while Bituminous Surface has a wide distribution and the highest peak speeds.
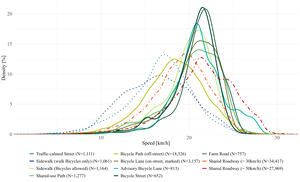
Figure 2 shows weighted density plots of observed speeds for different types of infrastructure, which vary considerably. Infrastructure designated for pedestrians (dotted blue) shows the lowest speeds. Interestingly, even in areas where cyclists are expected to walk their bicycles, a median speed of 16.6 km/h is observed. Compared to shared roadways (dot-dashed red), dedicated bicycle infrastructure (solid green) shows narrower speed distributions. The median speeds are between those for Shared Roadway km/h), and Shared Roadway km/h). The only exception is Bicycle Path (off-street), which could be explained by their variety of surface types, contributing to lower speeds compared to bituminous surface.
Looking at the results of the gamma model in Table 1, Bituminous Surface leads to the highest speeds. In terms of infrastructure types, results are more dispersed. Shared-use Path, Advisory Bicycle Lane, and Bicycle Street facilitate the highest speeds and thus outperform shared roadways, bicycle paths, and bicycle lanes. However, to correctly interpret the coefficients of infrastructure types, one must consider their interaction effects with oncoming traffic and width. Where applicable, the presence of oncoming bicycle traffic is considered and leads to consistently negative coefficients. Infrastructure width shows mixed effects, likely because it facilitates both overtaking and parallel driving.
Dedicated cycling routes are associated with higher speeds. The same accounts for longer network segments, as acceleration and braking sequences are less pronounced.
Finally, tracks through forests, fields, and discontinuous urban fabric facilitate higher speeds. In contrast, speeds tend to be lower in continuous urban fabric and industrial areas.
Table 3 shows obtained speeds for different combinations of infrastructure.
Considering that only infrastructure-specific attributes were included, a MAPE of 17 % indicates a reasonable fit. Further analysis shows that traffic volumes increase with speed, suggesting that cyclists tend to prefer faster infrastructure. Although speed influences travel times, it only explains route choice partially. Other factors like comfort must also be considered.
The incentive-driven and competitive nature of DB Rad+ may slightly overestimate cycling speeds despite its non-sport focus. In addition, spatial matching may have inaccuracies. However, the results provide valuable information for planning and modeling of evidence-based bicycle networks.
Acknowledgements
This study is part of the project #transmove at the DigiLab of the State Agency for Roads, Bridges, and Waterways (LSBG) for the Free and Hanseatic City of Hamburg. It is funded under the “Digitalization of Municipal Transport Systems” grant program by the Federal Ministry for Digital and Transport (BMDV) (Grant Reference Number: 16DKV41086).


