Loading [Contrib]/a11y/accessibility-menu.js
Skip to main content
null
Findings
  • Menu
  • Articles
    • Energy Findings
    • Resilience Findings
    • Safety Findings
    • Transport Findings
    • Urban Findings
    • All
  • For Authors
  • Editorial Board
  • About
  • Blog
  • covid-19
  • search

RSS Feed

Enter the URL below into your favorite RSS reader.

https://findingspress.org/feed
Urban Findings
May 20, 2025 AEST

Measuring the Shade Coverage of Trees and Buildings in Cambridge, Massachusetts

Amirhosein Shabrang, M.Sc. in Urban Planning, Mehdi Pourpeikari Heris, PhD, Travis Flohr, PhD,
Urban Heat MitigationShade DistributionTree ShadesBuilding ShadesShade CoverWalkabilityBikeability
Copyright Logoccby-sa-4.0 • https://doi.org/10.32866/001c.137963
Findings
Shabrang, Amirhosein, Mehdi Pourpeikari Heris, and Travis Flohr. 2025. “Measuring the Shade Coverage of Trees and Buildings in Cambridge, Massachusetts.” Findings, May. https:/​/​doi.org/​10.32866/​001c.137963.
Save article as...▾
Download all (3)
  • Figure 1. Shaded and Unshaded Sidewalks in the City of Cambridge
    Download
  • Figure 2. Shade coverage of trees and buildings from 12 to 5 pm
    Download
  • Figure 3. Shade coverage of buildings and trees in Cambridge, MA
    Download

Sorry, something went wrong. Please try again.

If this problem reoccurs, please contact Scholastica Support

Error message:

undefined

View more stats

Abstract

We investigated the spatial shade patterns of trees and buildings on sidewalks and bike lanes in Cambridge, Massachusetts. We used Lidar data and 3D modeling to analyze the spatial and temporal shade distribution across the City. Our analysis shows significant shade variations throughout the City. Western city areas receive more shade from trees, and the eastern regions receive more shade from buildings. The City’s northern areas lack shade, but natural and built sources of shade can improve shade coverage integration. This study’s findings help identify shade coverage gaps, which have implications for urban planning and design for more heat-resilient cities.

1. Questions

Climate change is getting worse across North America and amplifying the urban heat island effect in cities. This intensification has long-term consequences, which affect public health, energy consumption, and life quality in urban areas (Iungman et al. 2023; Park et al. 2023; Ren et al. 2022). Urban planners are increasingly concentrating on designing cities that can effectively manage heat stress while exploring green strategies to tackle these challenges (Flohr et al. 2023; Heris, Muller, and Wilson 2019; Marando et al. 2022; Yang and Yoon 2020). In this context, Cambridge is investigating ways to enhance shade along public transit routes, sidewalks, and bike lanes to create cooler environments during the summer.

Trees and buildings create dynamic shadows in urban areas. Trees reduce direct sunlight exposure and lower surface temperature (Dadashpoor, Khaleghinia, and Shabrang 2024; Rahman et al. 2020; Zhao, Wentz, and Murray 2017). Buildings with proper design can give us essential shade and limit heat absorption, which leads to increased pedestrian comfort (Lu et al. 2022). Strategic placement and design of trees and buildings can create a cooling effect that saves energy and enhances resident comfort (Lu et al. 2022). For example, the ‘Cool Corridors’ program in Phoenix, Arizona, is designed to enhance thermal comfort and make walking more comfortable by adding shade to main pedestrian routes. It shows how shade studies can be used in extreme climates (City of Phoenix 2016).

Shading dynamics in cities are complicated because they depend on how micro-level elements like buildings interact with macro-level environmental factors (Lu et al. 2022). Measuring shade becomes even more complex when urban canopies, like trees, interact with buildings at multiple scales. Few studies have explored the combined shade cover provided by trees and buildings in cities, and this is often because of high costs and logistical challenges (Berry, Livesley, and Aye 2013; Lu et al. 2022; Park, Guldmann, and Liu 2021). Most studies concentrate on individual trees or buildings, which neglect the larger urban environment (Armson, Stringer, and Ennos 2012; Zhao, Wentz, and Murray 2017; Zheng et al. 2020). Consistent methods are necessary to see how shade coverage changes over time in the environment (Lu et al. 2022; Yu et al. 2020). These changes are essential to inform urban planning and design policies for heat mitigation and outdoor thermal comfort (OTC). This study measures how shade coverage of trees and buildings is distributed in Cambridge, Massachusetts. We used Lidar [1]data and 3D modeling to provide a comprehensive methodology that covers both temporal and spatial analysis for practical urban planning goals.

2. Methods

We adopted a detailed, multi-phase approach to evaluate the shade coverage from trees and buildings in ArcGIS Pro. First, we acquired LiDAR data from the USGS and created a Digital Elevation Model (DEM) from the LAS data format, concentrating exclusively on ground classification points with “Last of Many” and “Single” return values.

Next, we processed the LAS data into distinct layers of trees and buildings. We used mid- and high-vegetation classification codes with “First of Many” and “1” return values for trees. For buildings, we applied the building classification codes. We then made trees and buildings models by using the LAS Building Multipatch[2] tool, where we included tree canopy polygons as well as the adjusted DEM raster for trees and building footprint polygons and DEM raster for buildings with 1-meter simplification tolerance to enhance precision and performance of the model.

We used the Sun Shadow Frequency [3]tool to measure how much shade trees and buildings provided on June 30th from 12 to 5 pm. To get highly detailed and reliable results, we ran a high-resolution analysis with a 1-foot cell size for each output. The raster outputs of shadow frequency were converted into polygons, and areas without shadow were excluded to generate meaningful shadow polygons for each hour.

Additionally, we computed the shade coverage of buildings and trees along the City’s major corridor for sidewalks and bike lanes. We measured the extent of shaded sidewalks and bike paths throughout every hourly interval (12 to 5 pm).

3. Findings

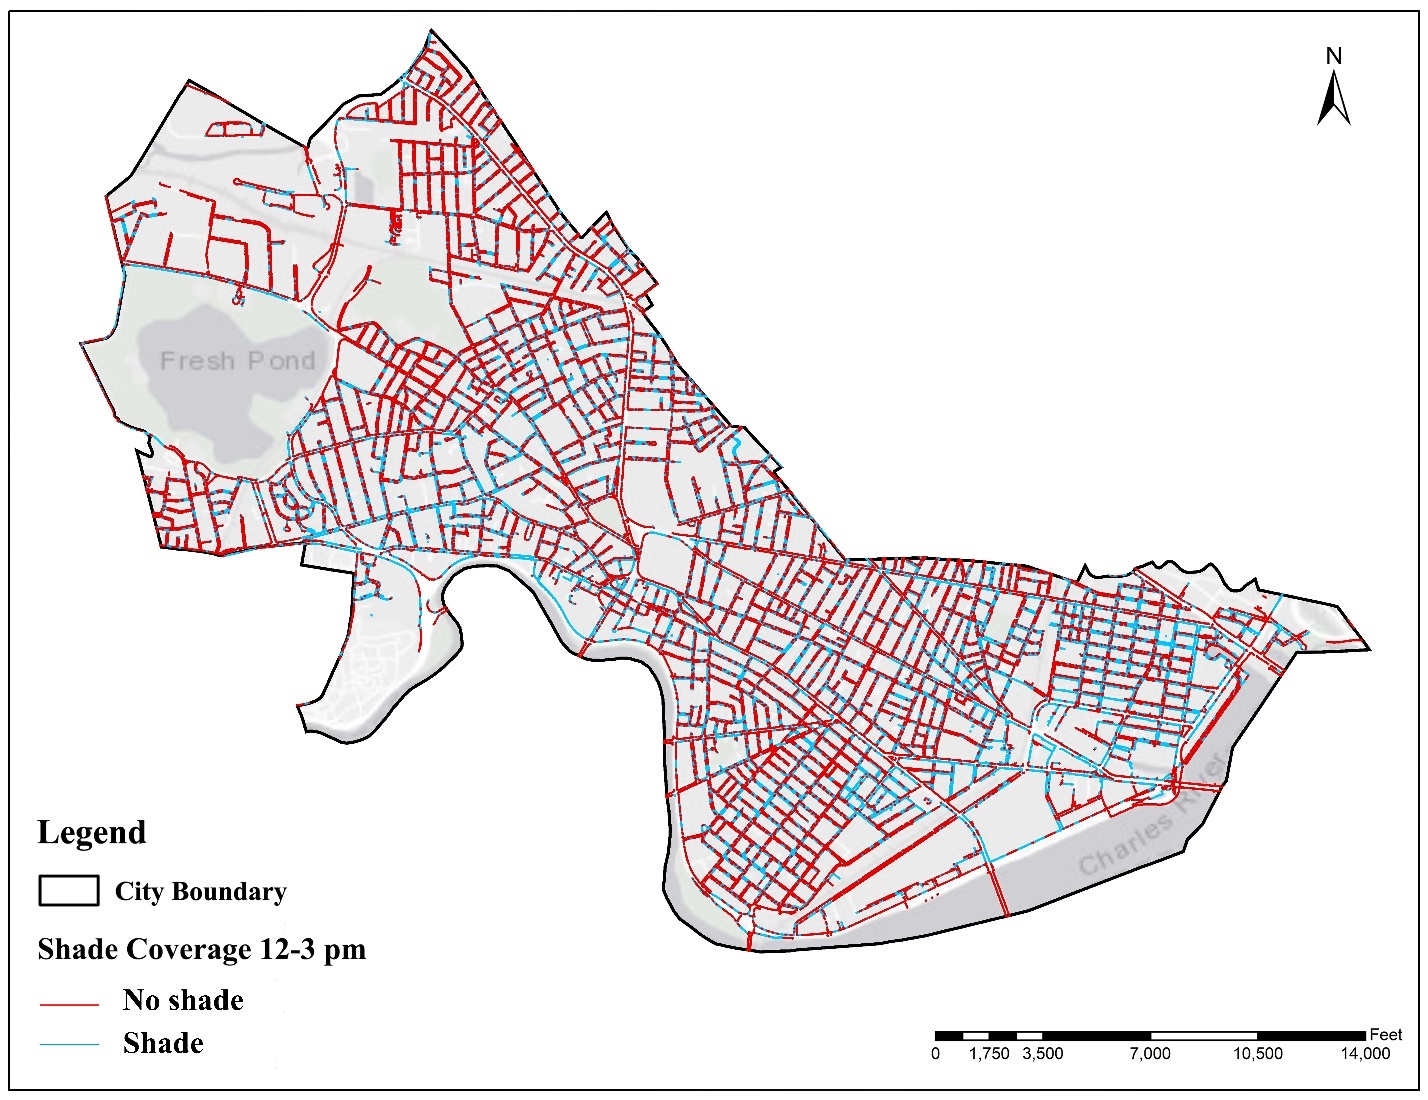
Our analysis of shade coverage in Cambridge revealed significant spatial variations provided by buildings and tree canopies. We focused on sidewalks and bike lanes during peak sun hours (12–3 pm and 12–5 pm).

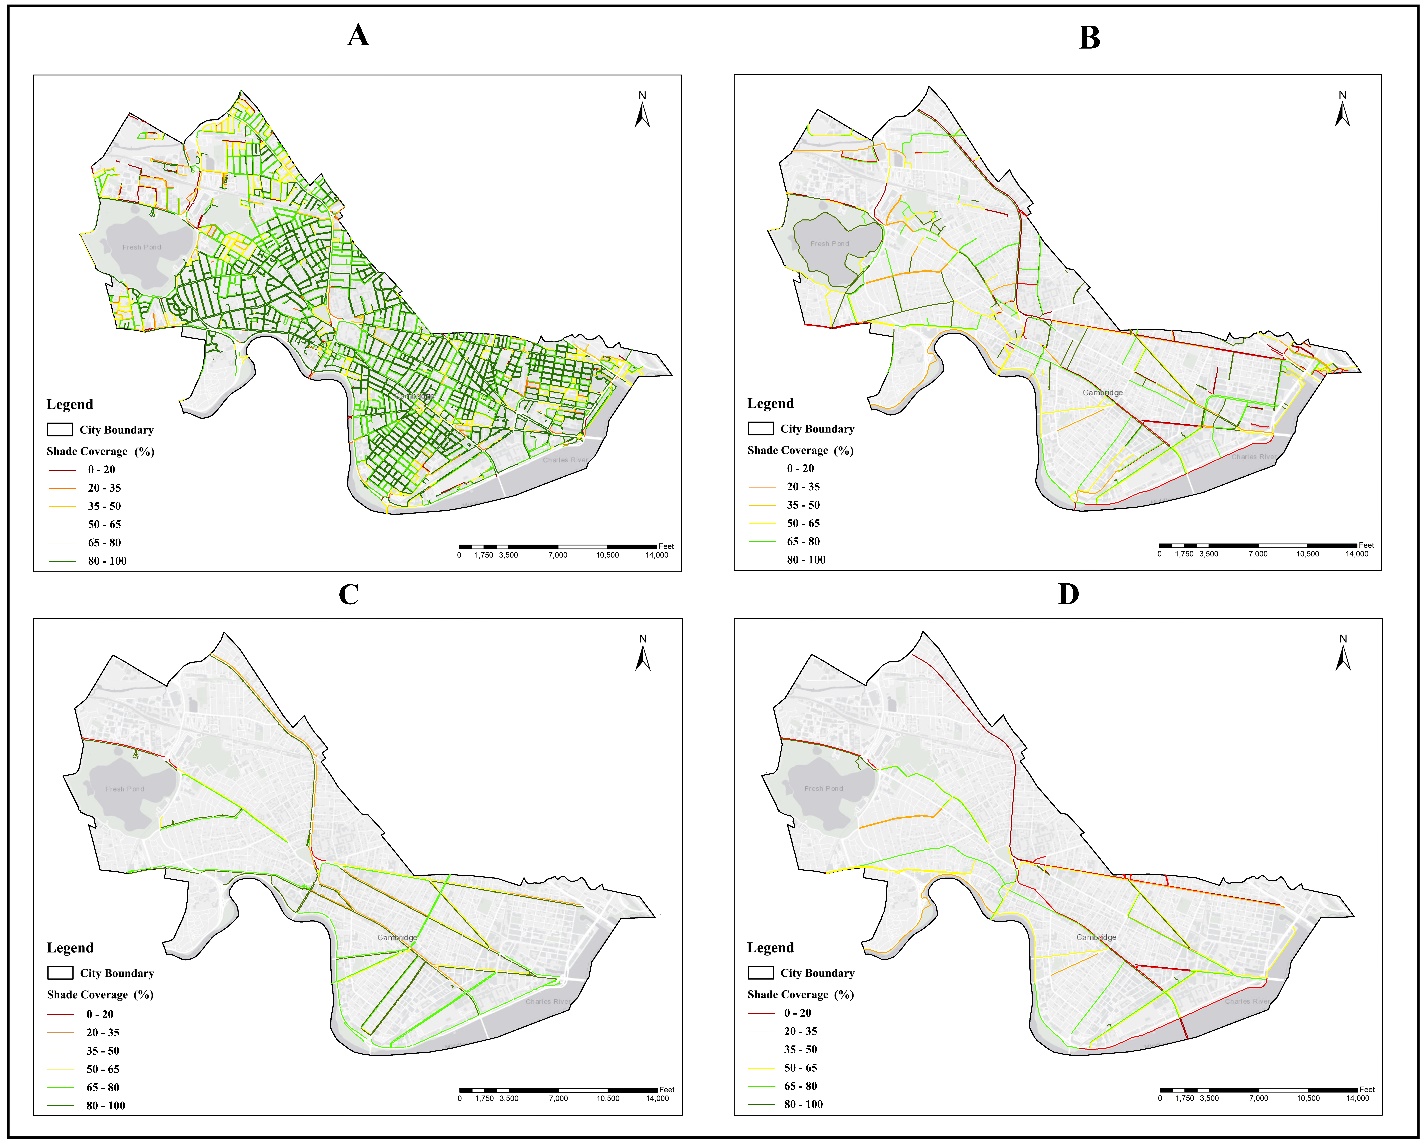
Sidewalks in the eastern and western parts of Cambridge receive more shade than other areas of the city during peak sunlight hours (Figure 1). Tree canopy coverage in the City’s western areas reaches over 65% between 12 pm and 5 pm, which is significantly higher than the 35% coverage found in the eastern and northern parts (Figure 2A). Building shade coverage was generally less than 35%, except in the eastern region, where it was higher (Figure 2B). Sidewalks in the eastern and western areas of the City have an average shade coverage of more than 80%, while northern routes have less than 80% (Figure 3A).

Figure 1
Figure 1.Shaded and Unshaded Sidewalks in the City of Cambridge
Figure 2
Figure 2.Shade coverage of trees and buildings from 12 to 5 pm

A: Shade coverage of trees on sidewalks B: Shade coverage of buildings on sidewalks C: Shade coverage of trees in bike lanes D: Shade coverage of buildings in bike lanes

Figure 3
Figure 3.Shade coverage of buildings and trees in Cambridge, MA

A: Six Hours of Shade Coverage on Sidewalks B: Six Hours of Shade Coverage in Bike Lanes C: Six Hours of Shade Coverage on Sidewalks of Major Corridors D: Six Hours of Shade Coverage in Bike lanes of Major Corridors.

Bike lanes in the western part of the City receive more than 65% shade from trees, while those in the central and eastern parts receive less (Figure 2C). Building shade coverage in bike lanes is typically less than 35% throughout the City (Figure 2D). Central bike lanes have more than 35% shade coverage, outperforming border areas with less than 35% (Figure 3B). The south and west sides of bike lanes generally have better shade coverage than the north and east sides.

Major sidewalk and bike lane corridors often exceed 50% shade coverage. The south side of these corridors tends to have more shade than the north, and the west side more than the east (Figures 3C and 3D). Major bike lane corridors typically have shade coverage ranging from 65% to 80%, southern corridors between 50% and 80%, and northern and eastern corridors often below 50% (Figure 3D).

During peak sun hours, tree canopy coverage in the western and eastern regions mitigates urban heat island effects and enhances thermal comfort for pedestrians. The contrast between the east and west-shaded areas by trees and buildings and the sun-exposed streets elsewhere, especially north of the City, highlights the need for a balance between natural and built environments. There is a pressing need for coordinated efforts to green the area. Evaluations of bike lanes reveal that certain routes in the western and eastern parts of the City benefit from more tree shade, creating a more comfortable environment for cyclists and encouraging sustainable transportation. However, shade coverage in bike lanes is limited in the central and eastern areas. To mitigate heat stress, we require more shade resources to develop integrated routes that effectively combine the shade from trees and buildings. The city can address shade disparities by prioritizing initiatives like tree planting, green roofs through planning tools like zoning, land use regulation, design guidelines, and building codes. These nature-based solutions will help ensure equitable shade distribution across the City. They also enhance resilience to climate change and provide long-term socioeconomic and health benefits. While this study focuses on peak summer shade, future research analyzing seasonal variations or diurnal patterns would better inform year-round heat mitigation strategies. Additionally, Combining LiDAR data with field thermal validation improves accuracy and ensures reliable urban heat management.


  1. Light Detection and Ranging method that uses light to measure ranges to the earth.

  2. A tool that converts LiDAR points into 3D shapes.

  3. An ArcGIS Pro tool to simulate solar angles and object heights for hourly shade calculations.

Submitted: October 31, 2024 AEST

Accepted: May 12, 2025 AEST

References

Armson, D., P. Stringer, and A. R. Ennos. 2012. “The Effect of Tree Shade and Grass on Surface and Globe Temperatures in an Urban Area.” Urban Forestry & Urban Greening 11 (3): 245–55. https:/​/​doi.org/​10.1016/​J.UFUG.2012.05.002.
Google Scholar
Berry, R., S. J. Livesley, and L. Aye. 2013. “Tree Canopy Shade Impacts on Solar Irradiance Received by Building Walls and Their Surface Temperature.” Building and Environment 69:91–100. https:/​/​doi.org/​10.1016/​J.BUILDENV.2013.07.009.
Google Scholar
City of Phoenix. 2016. “Walkable Urban (WU) Code Approval Overview.” https:/​/​www.phoenix.gov/​pddsite/​Documents/​PZ/​pdd_pz_pdf_00406.pdf.
Dadashpoor, H., A. Khaleghinia, and A. Shabrang. 2024. “Explaining the Role of Land Use Changes on Land Surface Temperature in an Arid and Semi-Arid Metropolitan Area with Multi-Scale Spatial Regression Analysis.” Environmental Monitoring and Assessment 196 (2): 1–28. https:/​/​doi.org/​10.1007/​S10661-023-12241-2.
Google Scholar
Flohr, T., M. Heris, R. George, and A. Avila. 2023. “Investigating New York City’s Cool Roof Program Implementation Using Remote Sensing Through an Environmental Justice Lens.” Journal of Digital Landscape Architecture 2023 (8): 65–74. https:/​/​doi.org/​10.14627/​537740008.
Google Scholar
Heris, M. P., B. Muller, and A. M. Wilson. 2019. “Why Does Planning Matter in Microclimate Management and Urban Heat Mitigation?” 43 (2): 371–87. https:/​/​doi.org/​10.1177/​0739456X19883000.
Google Scholar
Iungman, T., M. Cirach, F. Marando, E. Pereira Barboza, S. Khomenko, P. Masselot, M. Quijal-Zamorano, et al. 2023. “Cooling Cities through Urban Green Infrastructure: A Health Impact Assessment of European Cities.” The Lancet 401 (10376): 577–89. https:/​/​doi.org/​10.1016/​S0140-6736(22)02585-5.
Google Scholar
Lu, Y., J. McCarty, J. Sezto, Z. Cheng, N. Martino, C. Girling, A. Rysanek, S. Barron, and G. Matasci. 2022. “Modeling the Shading Effect of Vancouver’s Urban Tree Canopy in Relation to Neighborhood Variations.” Arboriculture & Urban Forestry (AUF) 48 (2): 95–112. https:/​/​doi.org/​10.48044/​JAUF.2022.008.
Google Scholar
Marando, F., M. P. Heris, G. Zulian, A. Udías, L. Mentaschi, N. Chrysoulakis, D. Parastatidis, and J. Maes. 2022. “Urban Heat Island Mitigation by Green Infrastructure in European Functional Urban Areas.” Sustainable Cities and Society 77:103564. https:/​/​doi.org/​10.1016/​J.SCS.2021.103564.
Google Scholar
Park, Y., J. M. Guldmann, and D. Liu. 2021. “Impacts of Tree and Building Shades on the Urban Heat Island: Combining Remote Sensing, 3D Digital City and Spatial Regression Approaches.” Computers, Environment and Urban Systems 88:101655. https:/​/​doi.org/​10.1016/​J.COMPENVURBSYS.2021.101655.
Google Scholar
Park, Y., Q. Zhao, J. M. Guldmann, and E. A. Wentz. 2023. “Quantifying the Cumulative Cooling Effects of 3D Building and Tree Shade with High Resolution Thermal Imagery in a Hot Arid Urban Climate.” Landscape and Urban Planning 240:104874. https:/​/​doi.org/​10.1016/​J.LANDURBPLAN.2023.104874.
Google Scholar
Rahman, M. A., C. Hartmann, A. Moser-Reischl, M. F. von Strachwitz, H. Paeth, H. Pretzsch, S. Pauleit, and T. Rötzer. 2020. “Tree Cooling Effects and Human Thermal Comfort under Contrasting Species and Sites.” Agricultural and Forest Meteorology 287:107947. https:/​/​doi.org/​10.1016/​J.AGRFORMET.2020.107947.
Google Scholar
Ren, Z., Y. Fu, Y. Dong, P. Zhang, and X. He. 2022. “Rapid Urbanization and Climate Change Significantly Contribute to Worsening Urban Human Thermal Comfort: A National 183-City, 26-Year Study in China.” Urban Climate 43:101154. https:/​/​doi.org/​10.1016/​J.UCLIM.2022.101154.
Google Scholar
Yang, H. J., and H. Yoon. 2020. “Evaluating the Effectiveness of Heat-Wave Adaptation Policies against Climate Risk: Application of Local-Level Health Impact Assessment.” Journal of Korea Planning Association 55 (2): 101–10. https:/​/​doi.org/​10.17208/​JKPA.2020.04.55.2.101.
Google Scholar
Yu, Q., W. Ji, R. Pu, S. Landry, M. Acheampong, J. O’ neil-Dunne, Z. Ren, and S. H. Tanim. 2020. “A Preliminary Exploration of the Cooling Effect of Tree Shade in Urban Landscapes.” International Journal of Applied Earth Observation and Geoinformation 92:102161. https:/​/​doi.org/​10.1016/​J.JAG.2020.102161.
Google Scholar
Zhao, Q., E. A. Wentz, and A. T. Murray. 2017. “Tree Shade Coverage Optimization in an Urban Residential Environment.” Building and Environment 115:269–80. https:/​/​doi.org/​10.1016/​J.BUILDENV.2017.01.036.
Google Scholar
Zheng, S., J. M. Guldmann, Z. Liu, L. Zhao, J. Wang, and X. Pan. 2020. “Modeling of Shade Creation and Radiation Modification by Four Tree Species in Hot and Humid Areas: Case Study of Guangzhou, China.” Urban Forestry & Urban Greening 47:126545. https:/​/​doi.org/​10.1016/​J.UFUG.2019.126545.
Google Scholar

This website uses cookies

We use cookies to enhance your experience and support COUNTER Metrics for transparent reporting of readership statistics. Cookie data is not sold to third parties or used for marketing purposes.

Powered by Scholastica, the modern academic journal management system