
1. Questions
In Japan, key policy measures to control the spread of COVID-19 were to request (i) voluntary restraints from unnecessary travel, (ii) telecommuting when possible, (iii) shortening of commercial establishments’ operation hours, and in very rare instances to (iv) stop operations. These were non-binding, non-enforceable requests, even when States of Emergency (SoE) were declared. However, citizens and businesses seemed to have complied to a large extent. Although a number of studies have modeled mobility changes under COVID-19 and have reported on the effectiveness of mobility restriction policies on travel behavior (Parady, Taniguchi, and Takami 2020; Hara and Yamaguchi 2021; Nakao, Sun, and Schmöcker 2022; Sun, Schmöcker, and Nakao 2022; Dantsuji, Sugishita, and Fukuda 2023; Dai et al. 2025) and on infection spread (Liu and Yamamoto 2022), studies have largely focused on early periods of the infection spread, going as far as September 2021. With the pandemic over and COVID-19 categorized a class-5 disease under the Act on the Prevention of Infectious Diseases and Medical Care for Patients with Infectious Diseases (the same as influenza) we want to quantify the impact of mobility-restriction-based infection prevention measures on travel behavior across the whole pandemic. We focus on leisure activities due to (i) its “non-essential” nature (in the short-term); (ii) its social nature (Han et al. 2023), which increases risk of infection, and (iii) its discretionary nature, which means decisions are made by individuals/households rather than employers, an important distinction in the context of non-binding policies. Ultimately, we seek to answer the following questions:
-
What was the effect of the stringency of mobility-restricting policies on leisure outings in the Greater Tokyo Area?
-
Did SoE and Quasi-SoE declarations have additional effects on compliance with self-restraint requests, irrespective of policy stringency?
2. Methods
A time-series model of the form was estimated for each prefecture in Greater Tokyo Area (The Tokyo Metropolis and the prefectures of Saitama, Chiba and Kanagawa). The models are specified following equation (1) where the prefecture subscript is dropped for simplicity:
\[\begin{aligned} \mathrm{y}_{\mathrm{t}}-\mathrm{y}_{\mathrm{t}-1}-\mathrm{y}_{\mathrm{t}-7}+\mathrm{y}_{\mathrm{t}-8}&=\boldsymbol{\beta}_{\mathbf{k}} \mathbf{x}_{\mathbf{k}, \mathbf{t}}+\varepsilon_{\mathrm{t}}+\sum_{\mathrm{i}=1}^3 \theta_{\mathrm{i}} \varepsilon_{\mathrm{t}-\mathrm{i}}\\ & \quad +\sum_{\mathrm{j}=1}^2 \Theta_{\mathrm{j}} \varepsilon_{\mathrm{t}-7 \mathrm{j}}+\sum_{\mathrm{i}=1}^3 \sum_{j=1}^2 \Theta_{\mathrm{j}} \theta_{\mathrm{i}} \varepsilon_{\mathrm{t}-7 \mathrm{j}-\mathrm{i}} \end{aligned}\tag{1}\]
where is a vector of explanatory variables, and a vector of unknown parameters. On the left-hand side, captures the non-seasonal first difference (where the lag unit is one day) and the seasonal first difference (where the seasonal period is seven days). The arises from the interaction of the non-seasonal and seasonal differencing operators. On the right-hand side, the first summation represents the three non-seasonal moving average terms, while the second and third summations capture the two seasonal moving average terms and the associated cross terms. A total of five moving-average parameters are estimated. These terms were defined using a data-driven iterative approach based on AIC and BIC with Portmanteau tests used to verify there was no statistically significant residual autocorrelation in the chosen model (see supplementary document).
We used the following data in the final model:
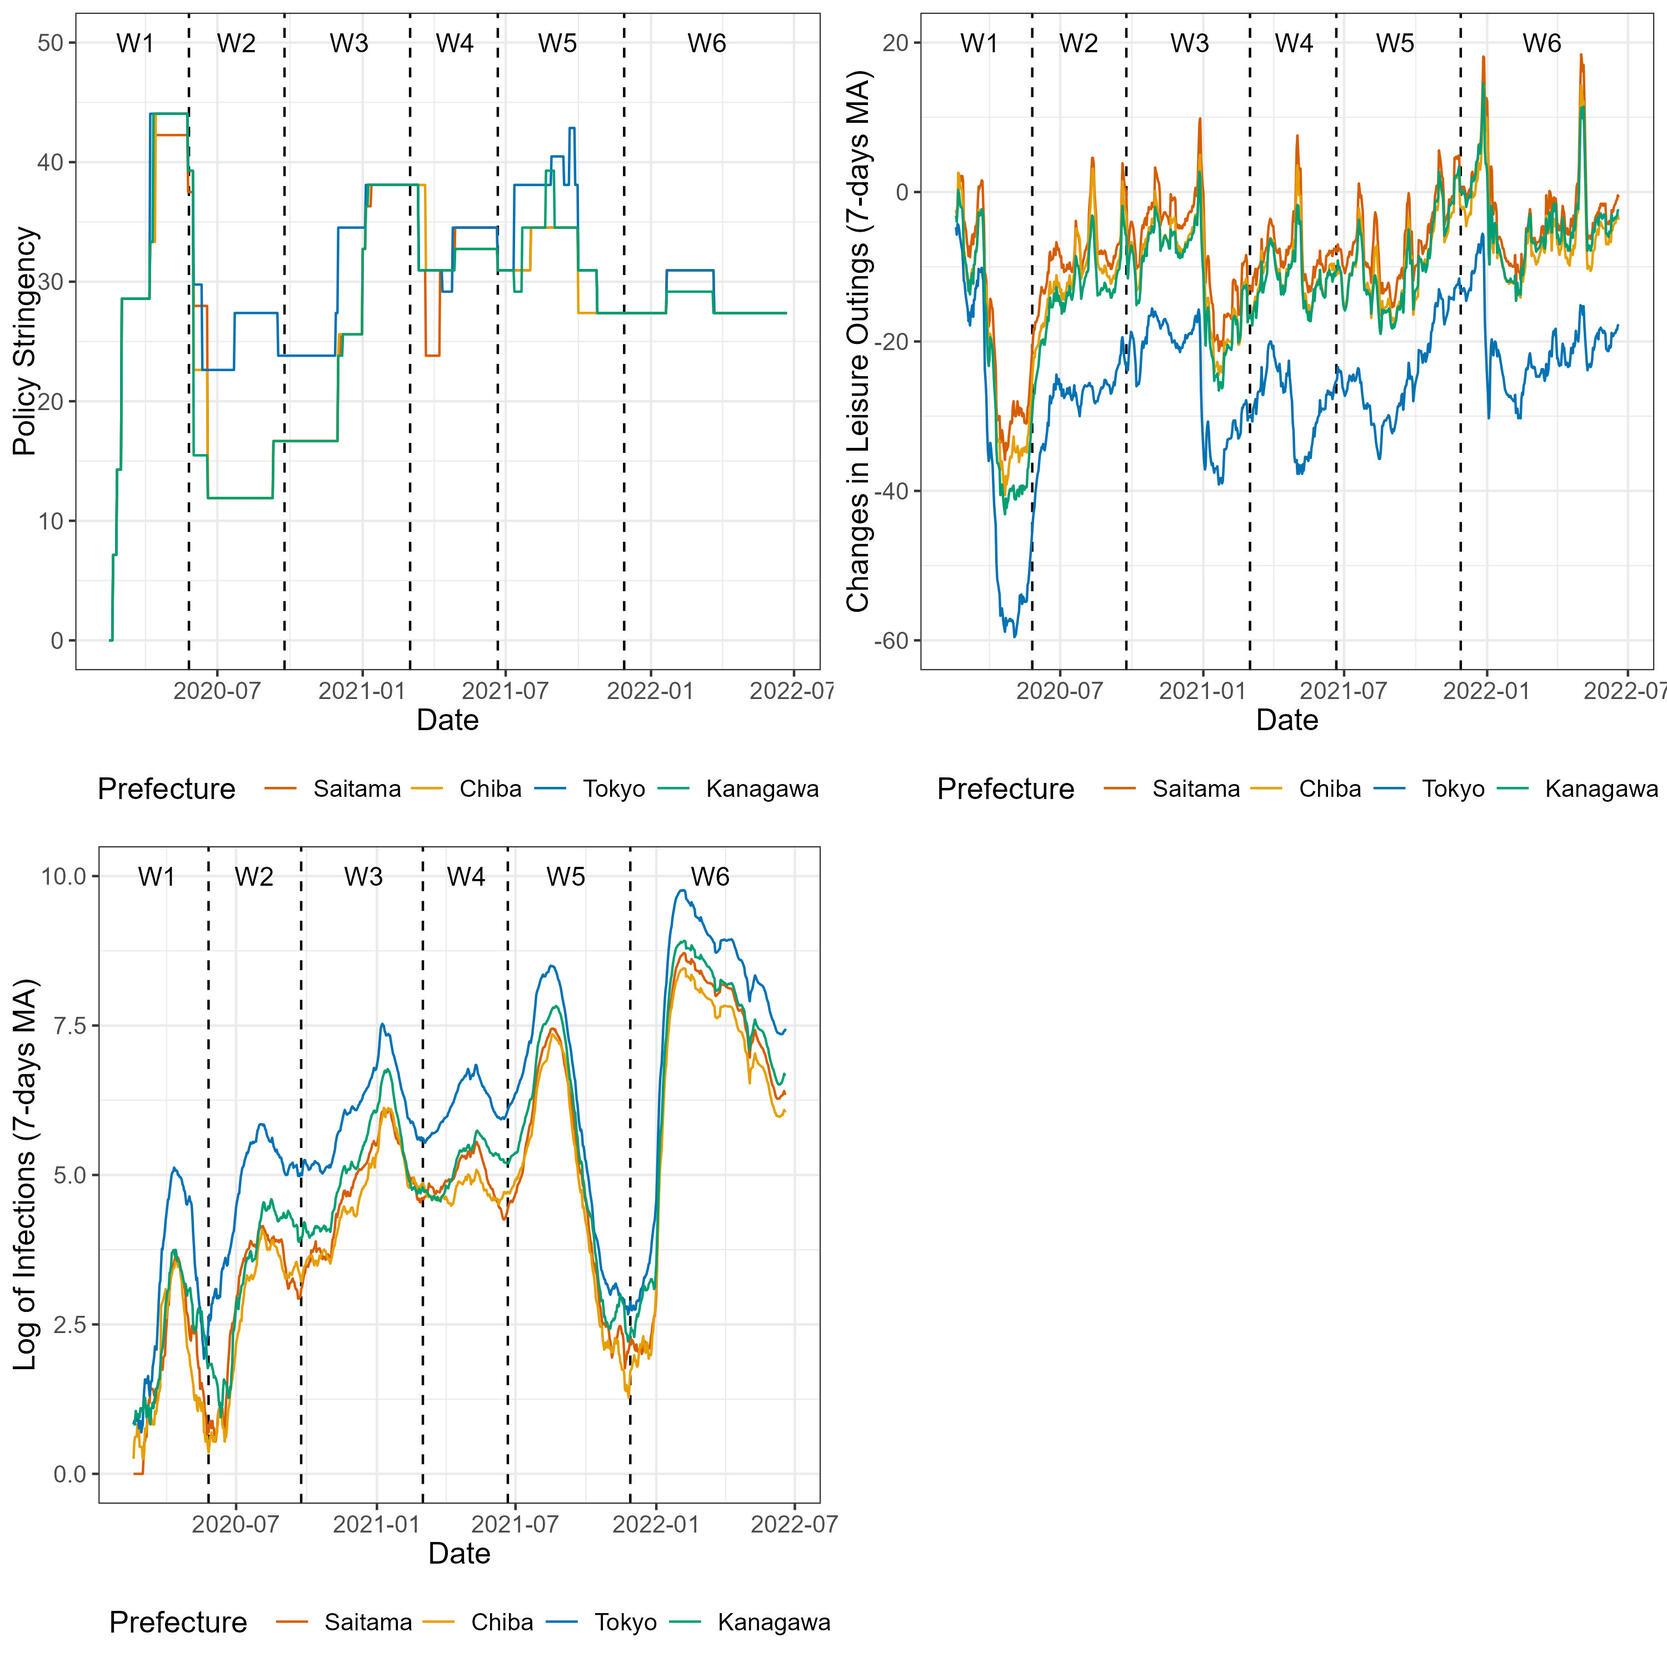
Leisure outing data from Google’s Community Mobility Report Data. More specifically, the number of visitors for Retail & Recreation facilities for each day compared against a baseline value before the spread of COVID-19 (see supplementary document for details). Commuting and grocery shopping were not considered, since these are more influenced by decisions made at the workplace/school or are essential during epidemics.
Policy Stringency data: Departing from the Oxford Government Response Tracker Stringency Indicator (Hale et al. 2021) we developed an indicator that (i) better reflects the Japanese context and (ii) is calculated at the prefecture level instead of the national level. The index ranges from 0 to 100 (see supplementary document).
SoE declaration dummy that takes value one during SoE periods, zero otherwise (see supplementary document). We hypothesize SoE declarations would have an additional effect on compliance with self-restraint requests even if policy stringency is the same.
Quasi-SoE declaration dummy that takes value one during Quasi-SoE periods, zero otherwise. A Quasi-SoE is more limited in terms of coverage and stringency than an SoE.
Travel demand stimulation policy dummy that takes value one for periods where travel stimulation policy called “Go To Travel” was implemented, zero otherwise. The policy offered travel and accommodation discounts as well as eating-out coupons.
Natural logarithm of the number of infected persons on the previous week per 100,000 inhabitants.
The following variables were tested but not included in the final specification as they did not yield model improvements: temperature, precipitation, snowfall, weekend and holiday dummy variables and population density.
3. Findings
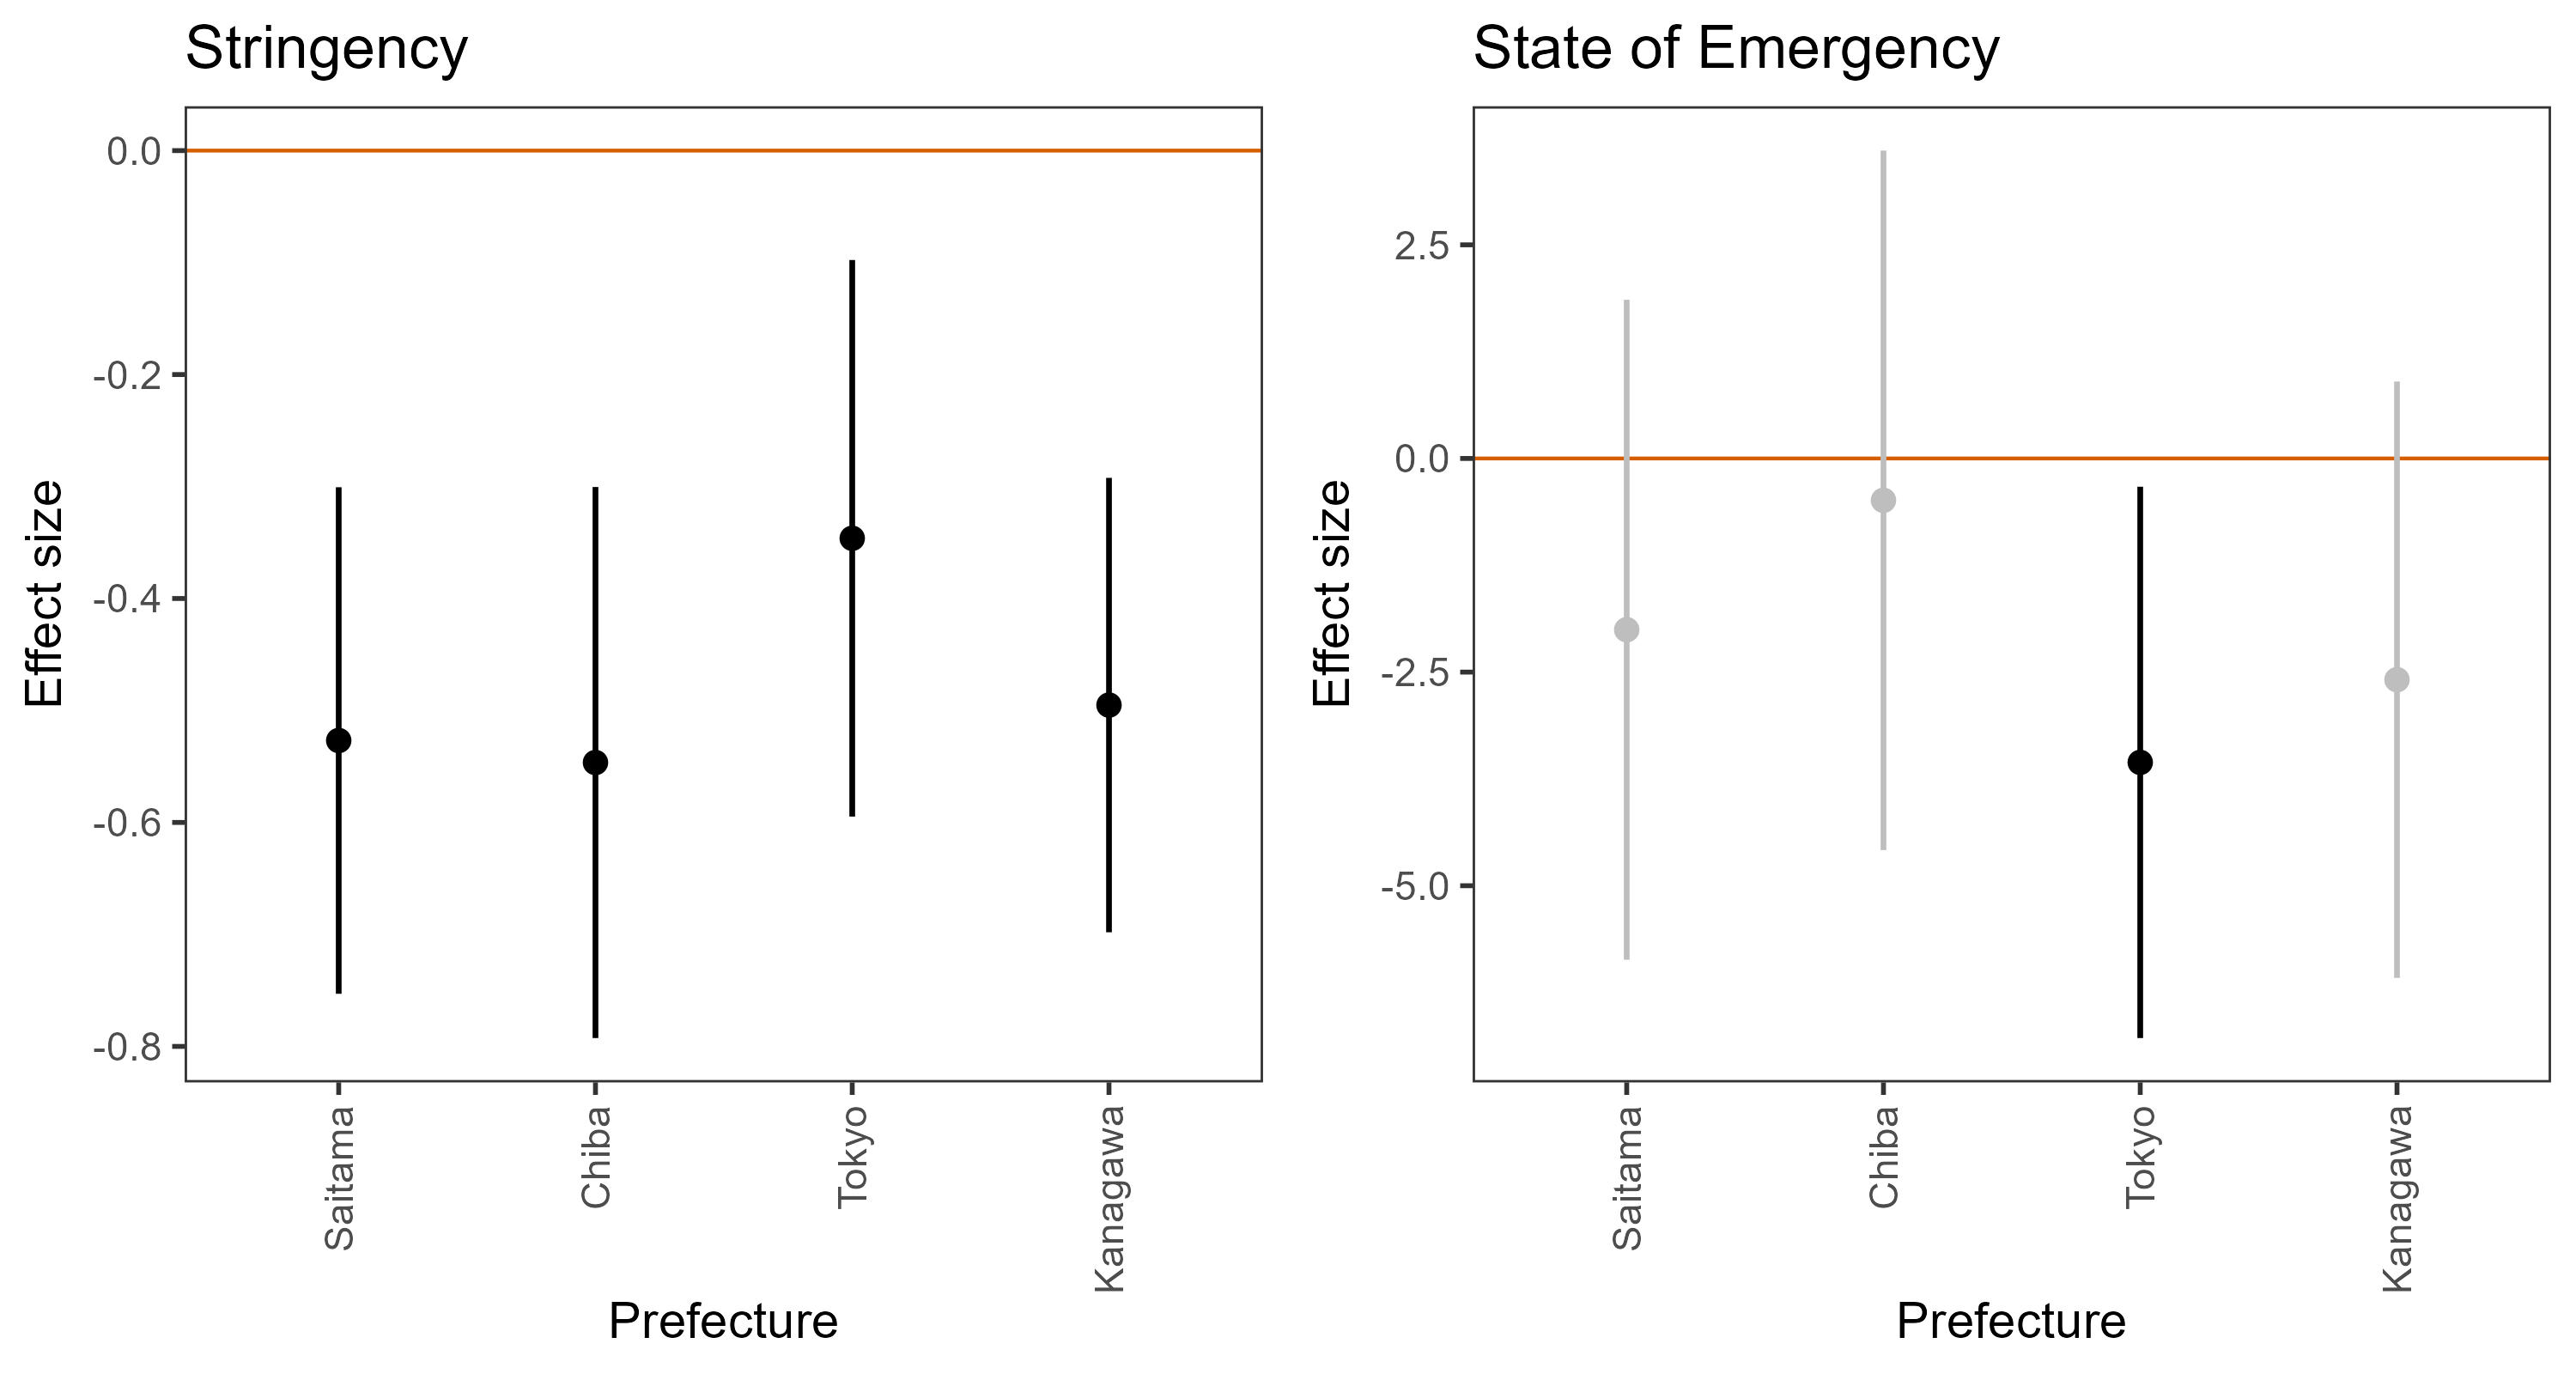
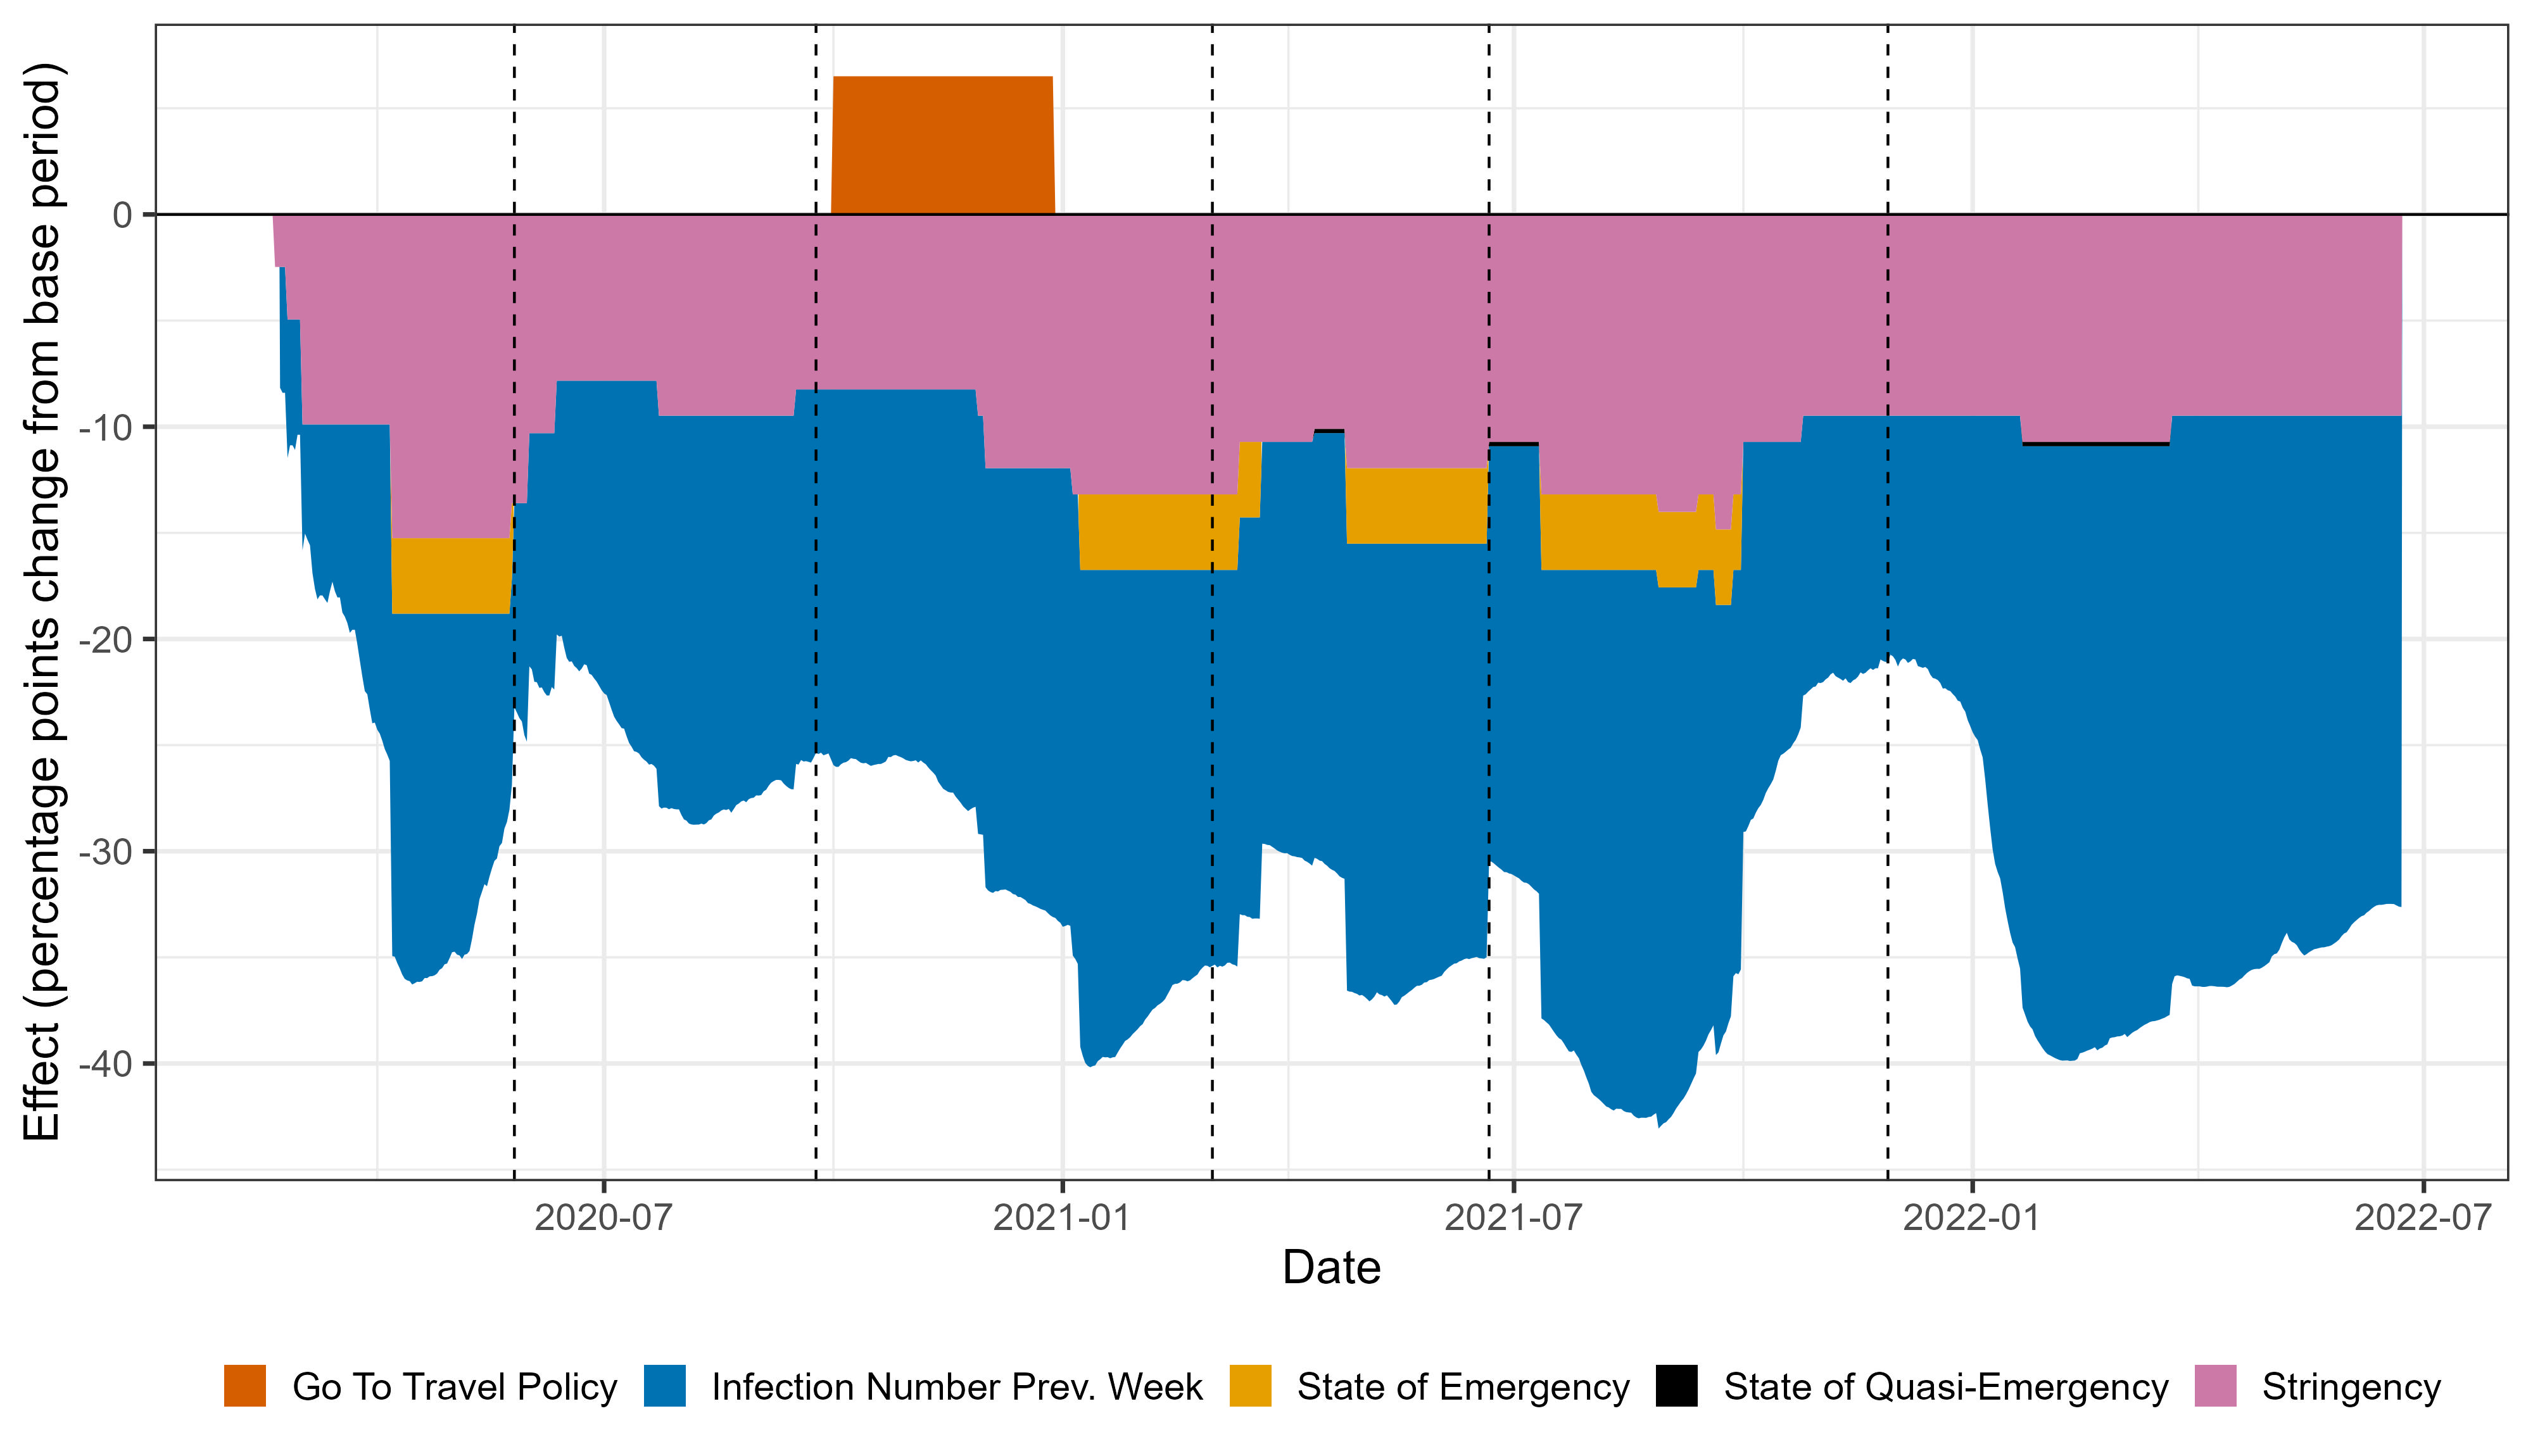
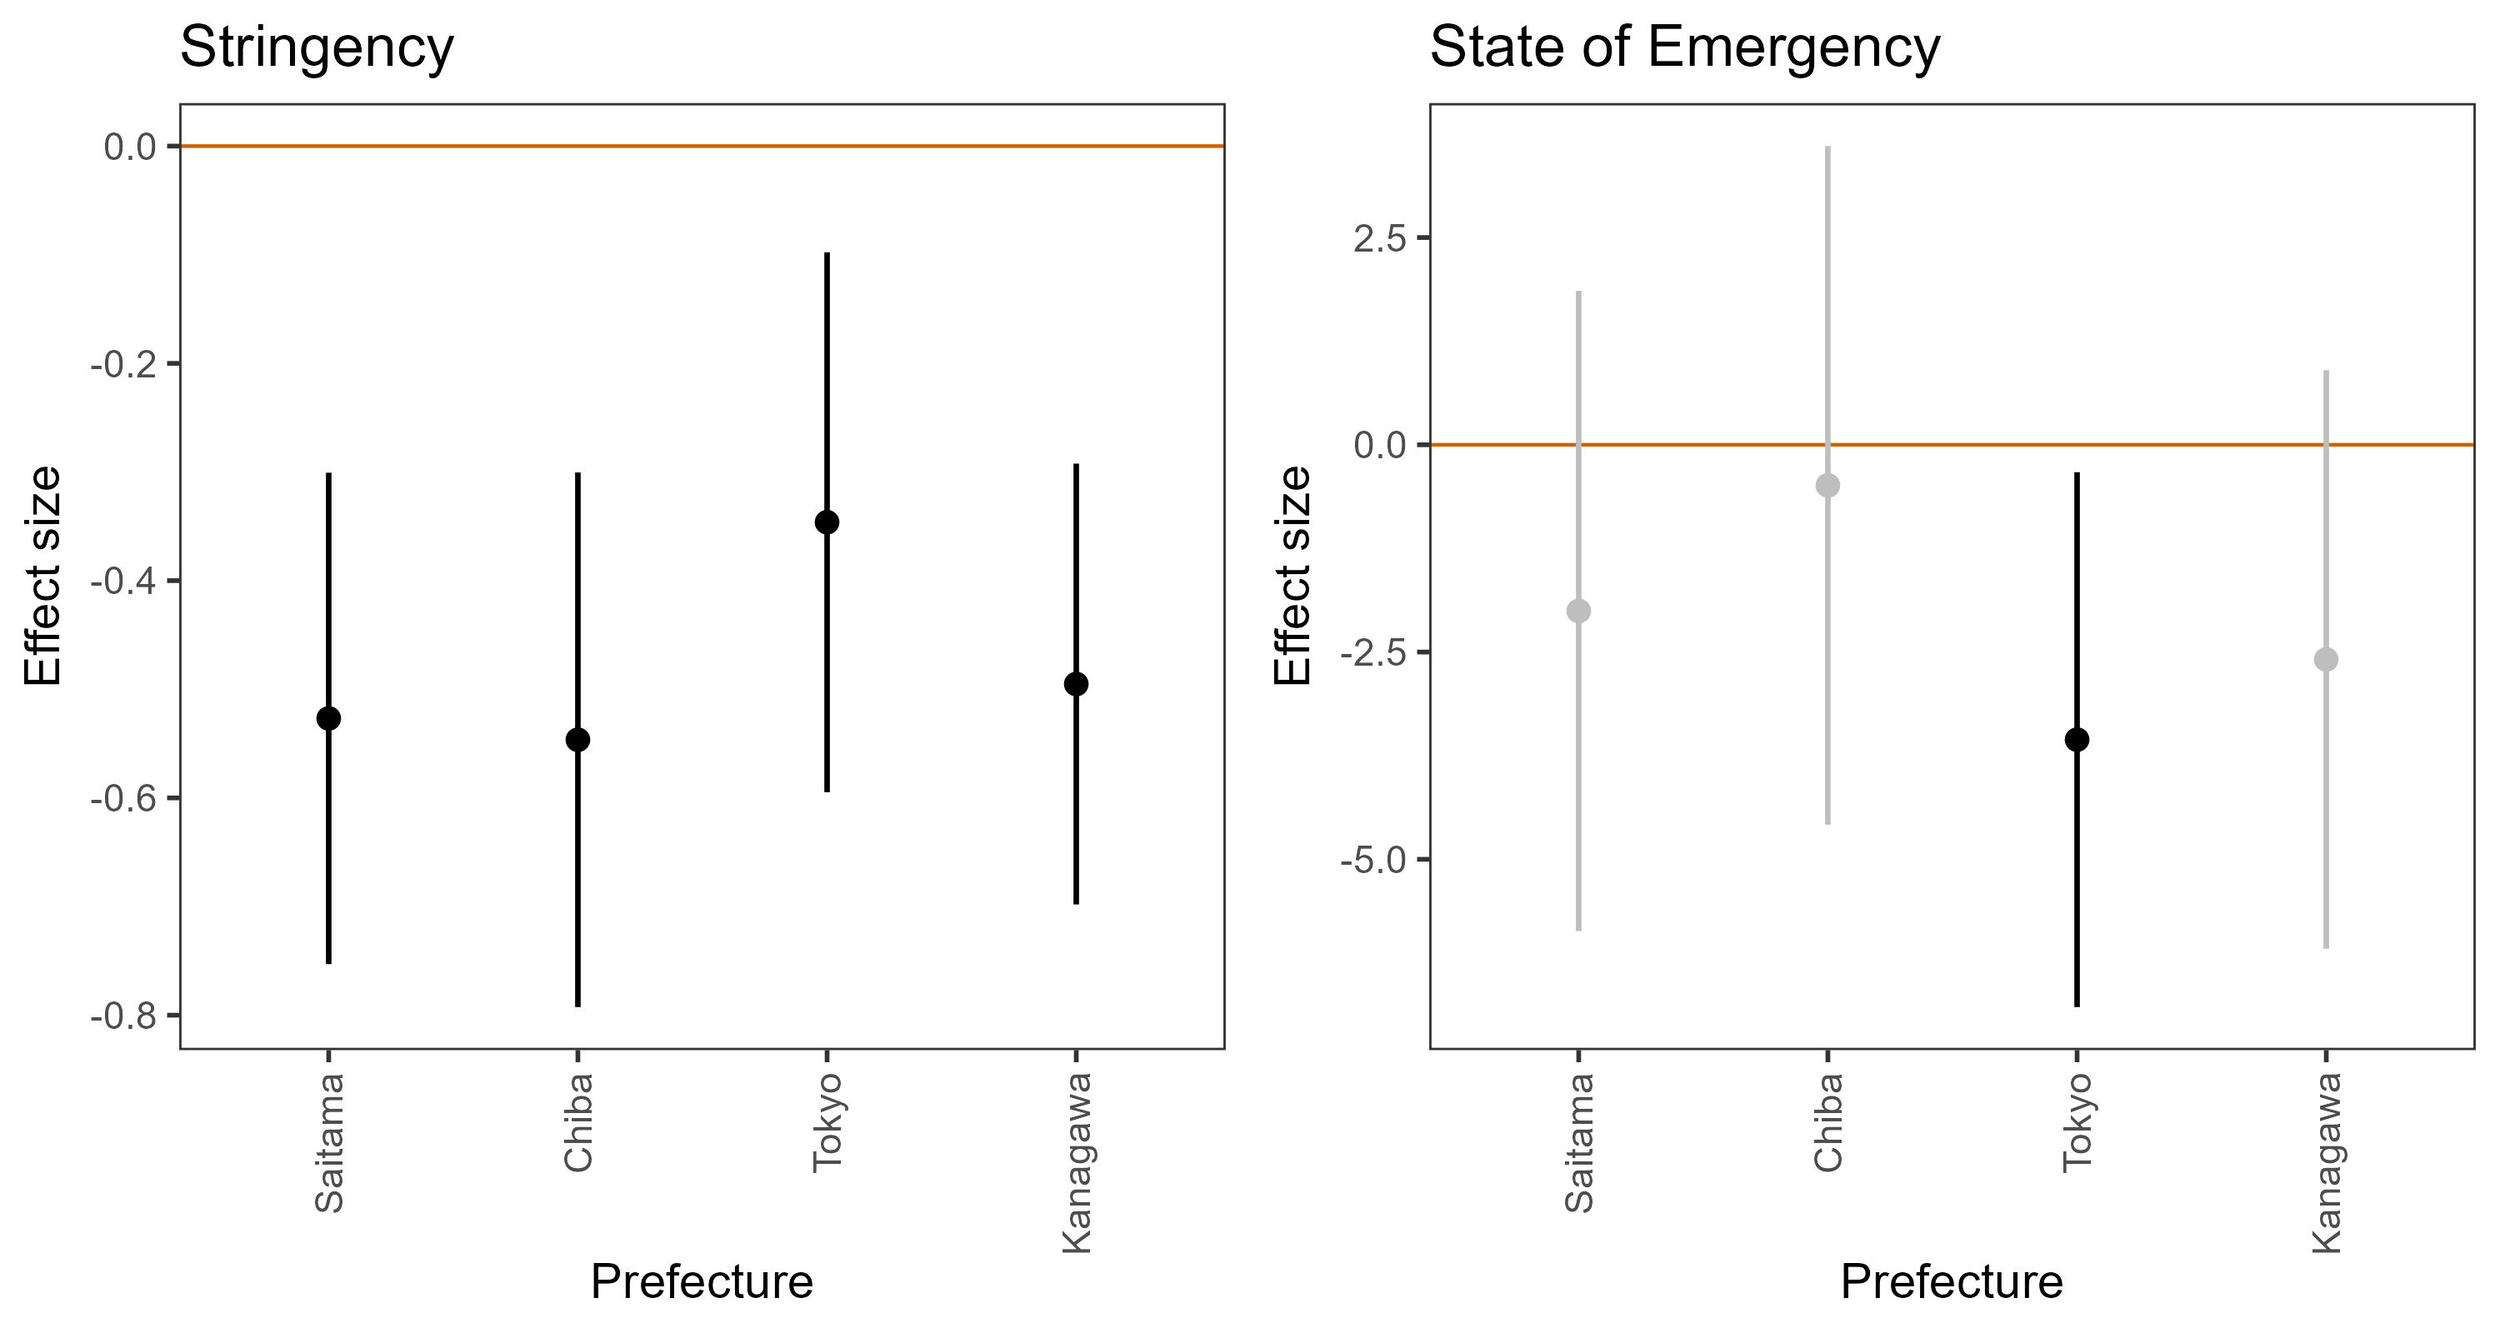
Policy stringency was negatively associated with the number of leisure outings, a finding generally consistent with existing literature. Stringency effect was smallest for Tokyo and largest for Saitama and Chiba prefectures. One-point increase in policy stringency index results in a 0.35 percentage points reduction in the amount of leisure outings in Tokyo, and a 0.55 percentage points reduction in Chiba prefecture. Results suggest that while non-binding, measures introduced in the Greater Tokyo Area were effective in reducing mobility levels. SoE declarations had an additional effect on leisure outings of – 3.56 percentage points on average in Tokyo. This effect was irrespective of stringency, so it can be interpreted as an additional effect stemming from the declaration itself. For other prefectures, while an additional effect was observed, 95% confidence intervals include zero in all cases, suggesting high levels of uncertainty in these estimates (See Fig. 2). During SoE, residents were requested to avoid out-of-prefecture travel, so a plausible explanation is that Tokyo, which has a disproportionately high influx of people from other prefectures, experienced a particularly strong impact. No evidence was found supporting the hypothesis that declaration of a Quasi-SoE had any effect on leisure outings. Fig 3 shows predicted values for each variable over time for each variable for the Tokyo metropolis. Policy stringency impact on leisure outings, the additional impact of SoE declarations can be observed, as well as the “Go To Travel” effect and the large impact of the number of infections on the previous week.

Regarding limitations, this study did not consider the interaction effects between different types of activities due to the aggregate nature of the data. In addition, the data reflects the movement of users who enabled location history on their phones. While the vast number of users that use Google services might suggest representativeness, validating this remains a future task.