Research questions and hypotheses
Public transport (PT) takes passengers from a point where they are not, to a point they are not going – that is, from one stop/station to another instead of from people’s actual origin and to their final destination. Access and egress are integral parts of PT trips. By reducing this famous first/last mile problem, the geographical coverage of PT services will increase. In turn, the competitiveness of PT versus the car, in terms of travel time and convenience, will increase.
Shared electric scooters, hereafter referred to as e-scooters, hold some promise in reducing the burden of access and egress trips (ITDP 2018; ITF 2020; Agora 2019; Hollingsworth, Copeland, and Johnson 2019; Reed 2019). In 2019, seven e-scooter companies entered the streets of Oslo, Norway (Fearnley, 2020 forthcoming; Fearnley, Berge, and Johnsson 2020): Tier, VOI, Circ, Zvipp, Ryde, Lime, and Libo. This opened an opportunity to investigate the following research questions:
-
To what extent are shared e-scooters used in combination with PT?
-
What pattern of first/last mile usage of e-scooters can be explored?
Methods and data
Our data consists of the following elements.
Web survey: We performed a web survey on e-scooter usage among adults (over 18 years old) in Oslo. These were recruited from registered members of one e-scooter company (whose name cannot be disclosed for commercial reasons) and from various Facebook groups. Data collection took place between November 8th and December 1st, 2019 (i.e. prior to the Covid-19 outbreak in early 2020). A section of the questionnaire investigated the degree to which e-scooters are used as substitutes for, or complements to, other transport modes including PT.
The sample consists of 675 respondents, of which 549 stated that they have used an e-scooter. Results presented here refers to those 549 respondents. Our sample differs from Oslo’s adult population (provided in parenthesis and taken from Oslo 2020) in that it consists of 70 percent men (49.66 percent); 69 percent are under the age of 40 (47.7 percent); 76 percent were employed (67 percent); and another 19 percent were students (14.5 percent).
Case studies with real time e-scooter data: Large amounts of data was collected from two of the larger e-scooter companies (who cannot be named for commercial reasons) via the National travel information provider Entur’s (entur.org) API. Time-stamped data was collected every 15 second and shows vacant e-scooters in Oslo, their battery level and geographical location. The data enables us to map the incidence of e-scooter trips which start close to major PT hubs and intersections. The analysis presented here relies on 173,098,602 data points gathered during three weeks from June 17th to July 7th, 2019, which is one week prior to and two weeks into the public school holidays. Data observations which met the following criteria were identified as e-scooter trips:
-
Duration 1-120 minutes
-
Distance 100 meters - 10 kilometers
-
Battery level unchanged or reduced
-
Speed (as the crow flies) maximum 20 km/h (the legal limit in Norway)
With these criteria we identified 348,910 trips over the three-week period, or just under 17,000 trips per day on average. A modest estimate is that the total market (all seven operators) exceeded 30,000 daily trips during this period. As a comparison, the approximate daily number of PT trips in Oslo are 145,000 for trams, 12,000 for ferries, 115,000 for local train, and 315,000 for city buses.
We selected two central locations in Oslo, which stand out as busy, but despite their central location are poorly connected with the rest of the city by means of PT. With the real time data, we investigate how e-scooter usage to and from these locations relate to PT. For one of the cases, we used the DBSCAN clustering algorithm in Qgis 3.14 to identify the important areas of trip origins. Minimum cluster size was set to 5 and maximum distance to 25 meters.
Findings
Survey participants were asked whether their last trip replaced another mode of transport. Table 1 summarises their responses.
The majority of e-scooter trips replace walking. Almost one quarter replace PT. E‑scooters in Oslo do not appear to replace car or taxi to any significant degree, as opposed to what is reported in many U.S. locations (where typically one-third of e-scooter trips replace car or taxi, see PBOT 2018; SFMTA 2019; Denver Public Works 2019), but in line with recent European evidence (van der Flier et al. 2020). Oslo municipal government’s promotion of ‘car-free city living’ policies, which include reduced (and high cost) parking, road pricing and other car restrictions means that there are not that many CBD car trips to be replaced. The responses are remarkably stable across respondent segments.
Respondents were asked whether their last e-scooter trip was made in combination with other modes. A majority, 57 percent, confirmed this. Table 2 presents what transport modes they combined their e-scooter trip with and how this differs between respondent segments.
A considerable share of co-modal e-scooter trips are in fact made in combination with different PT modes (metro, bus, train and tram). Males and students do so slightly more than females and employees.
The large share of replaced walk trips in city center (table 1) and the evidence that a majority of co-modal trips are in combination with PT (table 2) confirms a picture of people relying on PT for travel into the city center and, once there, using e-scooters.
To investigate these findings further, we have studied e-scooter movements in two typical last mile situations.
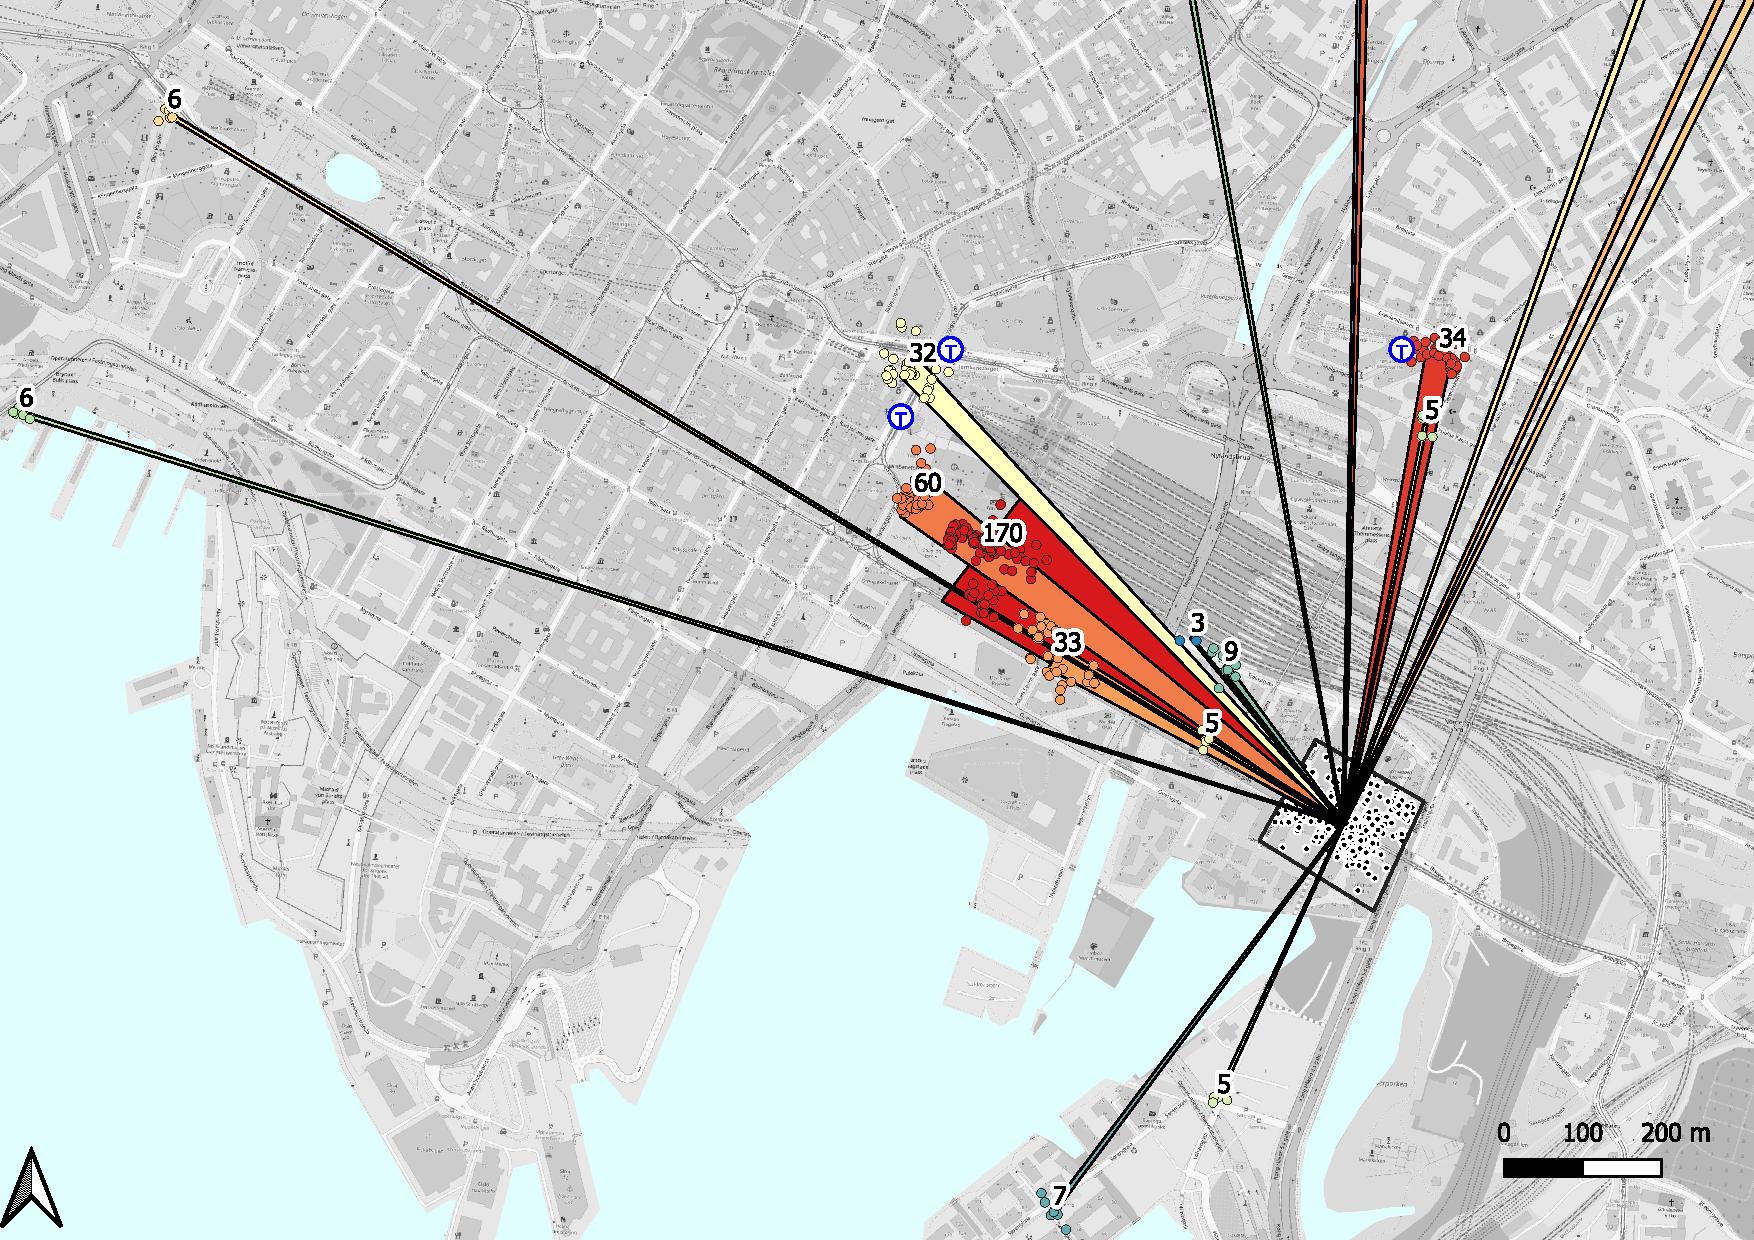
The first case is a newly developed area for high-end workplaces located a little less than 1km away from Oslo Central Station (Oslo S), a major PT hub for train, metro, tram and local bus. To identify last mile usage patterns, we chose a destination area of approximately 170 by 140 meters. In total we identified 725 trips that had their destination in the selected area between 6am and 10am on weekdays in the three weeks covered by the dataset. The mean trip distance (in straight line) was 1000 meters (median: 662 meters). Of these 725 trips, 420 (or 58 percent) originated in the immediate surrounding of Oslo S and other bus, tram or subway stops.
Figure 1 plots the result of the DBSCAN clustering procedure. We see that all major clusters are placed very close to Oslo S exits or subway or bus/tram stops.

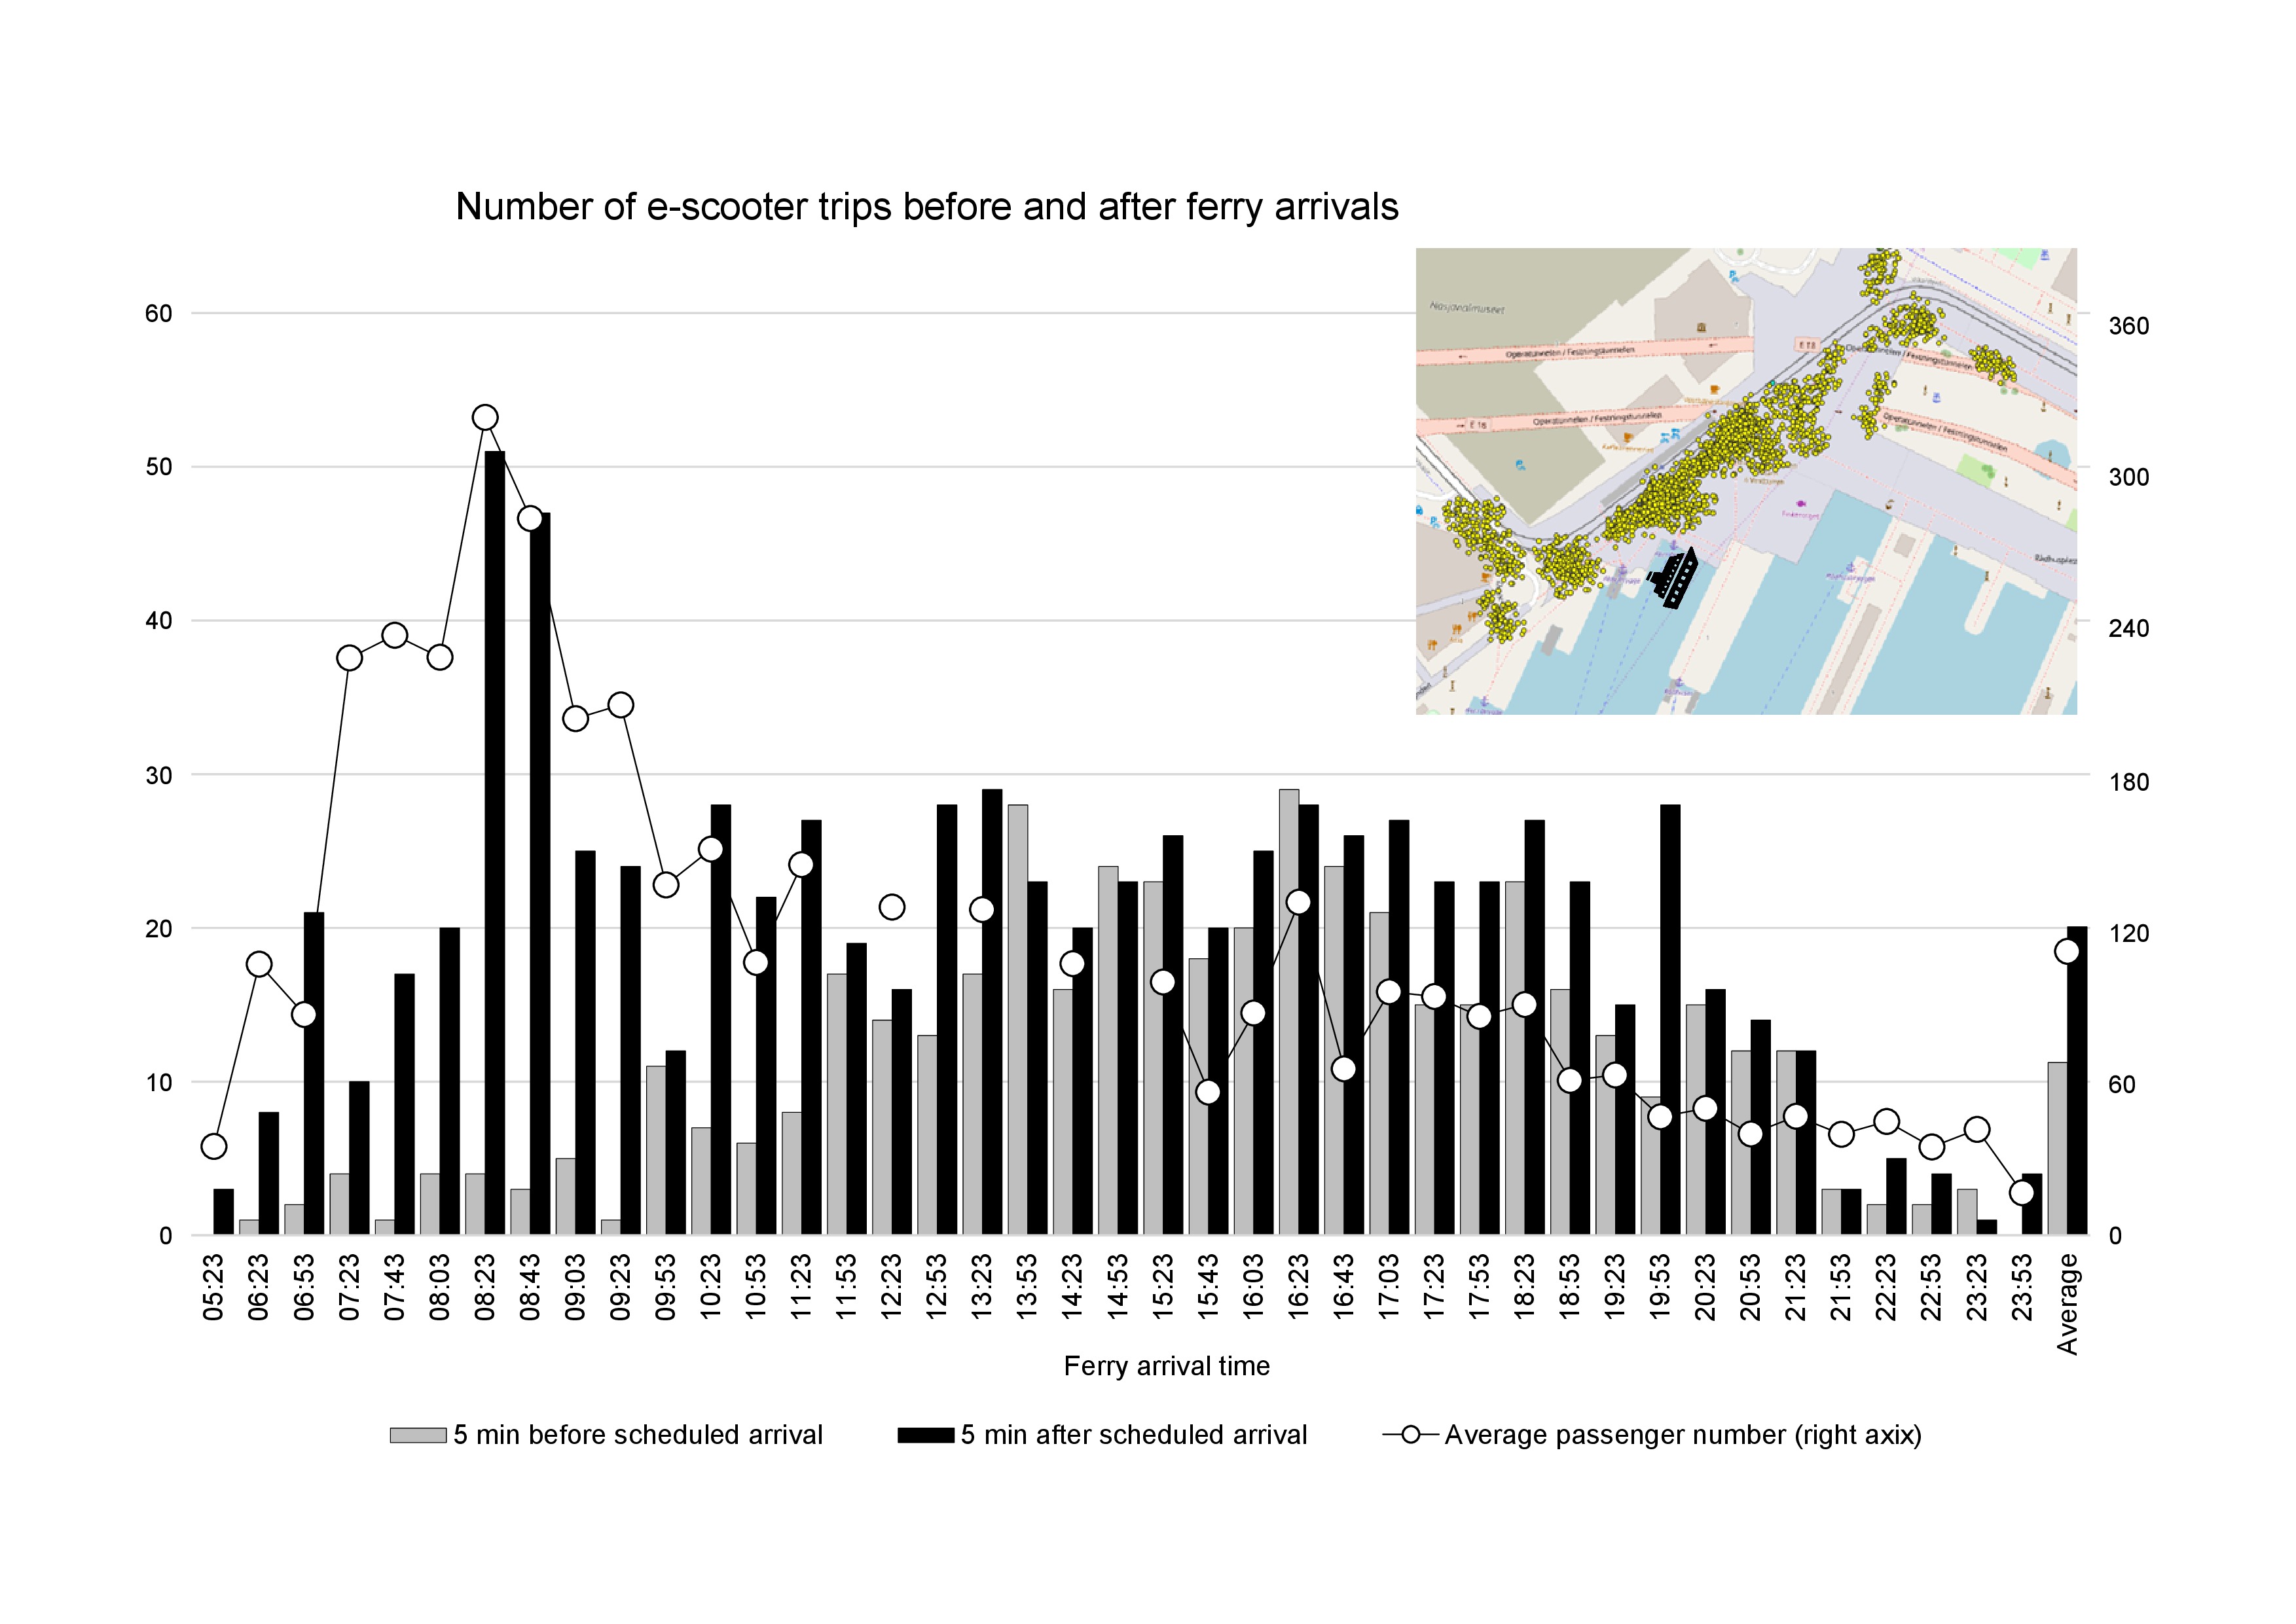
Our second case is a ferry service which is not well connected with the rest of the city center by means of PT. Its passengers are typically commuters and students who travel into Oslo in the morning and return home again in the afternoon. We have compared the number of e-scooter trips which start five minutes after each ferry arrival in the vicinity of the ferry quay with 1) the number of e-scooter trips starting five minutes prior to ferry arrivals; and 2) the number of e-scooter trips during all other five minutes periods of the day between 5am and midnight. The former is illustrated in figure 2. The mean values of 11.24 trips within five minutes before ferry arrival and 20.07 e-scooter trips within five minutes after ferry arrivals were found statistically different following a t-test t(76) = -4.161, p = .000. Also the latter comparison identifies a significant difference in e-scooter trips that start within five minutes of a ferry arrival (mean 20.7) and all other five minute periods during the day (mean 13.73) t(263) = -3.686, p = .000. We interpret the differences, an in particular the larger ones in the AM peak, as a result of arriving ferry passengers using e-scooters for their next trip leg.
._totals_.jpg)
Together, these pieces of evidence imply that a considerable share of e-scooter trips is indeed made in combination with public transport – and in particular, they appear to be last mile trips. As such, e-scooters play a role in complementing and supporting PT services.
In fact, when our survey respondents were asked to identify measures that may increase their usage of e-scooters, ‘Better integration with public transport’ was selected by 51 percent, and scored highest (followed by ‘Lower minute/start price’ (51/49 percent, respectively), ‘Larger geographical coverage’ (35%) and ‘Better infrastructure’ (35%) (N=539)).
We conclude that shared e-scooters offer a popular first and last mile solution to many PT passengers. Better integration with public transport and policy instruments which make e-scooters a more reliable, attractive and affordable first/last mile solution, can contribute to strengthen this role.
Acknowledgements
The study was funded in part by the Research Council of Norway via the REGSMART project (project number 283327), and in part by an e-scooter knowledge-building project sponsored by Ruter, Bymiljøetaten, Helsedirektoratet and the Norwegian Public Roads Administration.