
1. QUESTIONS
Taxis are mainly operated as independent economic entities adapting individually to context. The market outcomes vary from location to location, depending largely on regulatory context. The interaction between the customer and provider at a taxi stand is challenging as the customer makes the purchase decision before knowing the quality and exact price of the service bought. This phenomenon is well known and described in literature (Cooper et al. 2023; Gilbert and Samuels 1982; Schaller 2007). At airports where many customers are arriving in the city for the first time and are unfamiliar with the local taxi services, this is particularly challenging (Anil Yazici, Kamga, and Singhal 2016).
For efficiency reasons, airports frequently utilize taxi depots to better match supply and demand at the airport (Kamga et al. 2012). At Oslo Airport Gardermoen a taxi depot has been in place since the opening of the Airport in 1998. Before 2022 this depot was operated as a hybrid stand, where the customer could choose between ordering a taxi from the depot or hailing a taxi from the stand immediately in front of the terminal. Similarly, the taxi driver could either receive a booking from the taxi management system while at the depot or wait until at the depot until called to the stand next to the terminal and eventually became first in line. Bookings can either take place through the taxi depot’s data system or by contacting the taxi dispatcher (TD)/ridesourcing actor/vehicle directly (i.e. use an app, the most widely used being Bolt, TaxiFix and Uber or call). In 2022 the taxi stand next to the terminal was removed. This change resulted in a physical separation between the taxis and the customers. Booking became compulsory. The taxi depot’s data system presents the available taxis on a touch screen listing capacity, price, type of vehicle, make and model, and emissions for available vehicles.
In this paper we investigate: How this regulatory change affected efficiency, measured in average daily waiting times for the taxi operators, in a context where taxi fares are set at operator level. Our expectation from literature is that physically separating taxi vehicles and customers removes the attractiveness for taxi operators to wait long and charge the customer a high price to compensate for the wait.
2. METHODS
We have accessed two datasets one from Taxi Depot AS, and one from Fast Travel AS, who were the two taxi depot operators organizing the taxi depot and stand at Oslo Airport Gardermoen. The data set from Taxi Depot AS covers all taxi trips in 2018, that is before the regulatory change was made and before the pandemic, while the data set from Fast Travel AS covers the period May 2023 to October 2024, after the regulatory change and the pandemic. We have chosen these time periods as they both cover all the seasons in the year and that the 2023/24 data set covers a time period where air traffic was back at almost pre-pandemic levels. The number of passengers Oslo Airport Gardermoen (excluding transfers) were 27,5 million in 2018 and 25,6 million in 2024. With the pandemic low of 9 million in 2020. Both data sets contain daily average waiting times for taxis aggregated to operator level. These operators are either organized individually or through “Taxi Dispatchers” (TDs) that represent a number of vehicles with uniform pricing schemes. We have combined these data sets and grouped them into two categories. 2018 data is labelled ‘pre-intervention’, and 2023/24 data is labelled ‘post-intervention’. Observations with time waited values of 0 were recoded as missing. Moreover, observations with average waiting times of more than 400 minutes were eliminated as outliers. Tukey’s hinges (interquartile range) are used for outlier detection.
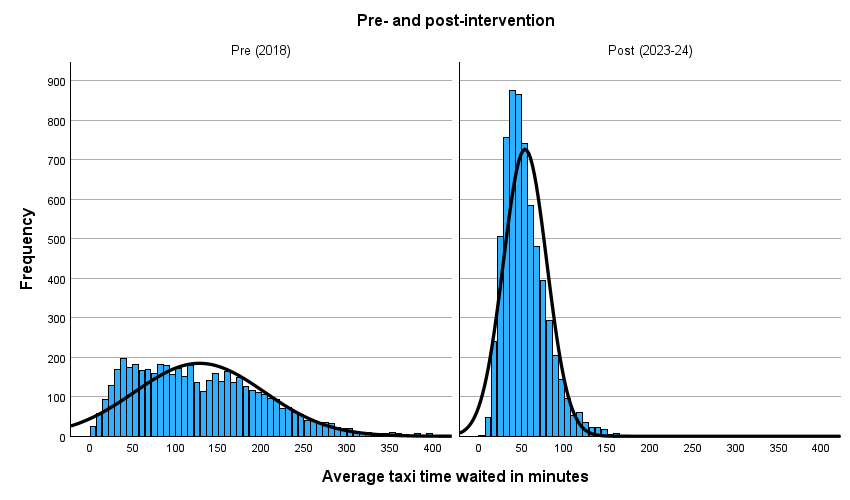
We conducted descriptive analysis (table 1, and figures 1 and 2), and two parametric tests – independent sample t-test and one-way ANOVA with post hoc test – to examine whether changes in how the taxis are hailed have impacted taxi drivers’ waiting times. Results from independent sample t-test and one-way ANOVA are reported in tables 2 and 3).
3. FINDINGS
Waiting times in the year 2023 and 2024, denominated by means, median upper and lower quartiles, show a substantial decline relative to 2018 data. The reduction of waiting times is sizable throughout the entire spectrum of operators. Meanwhile, the reduction from the upper end of the distribution is greater, both in absolute (minutes) and relative terms (precent). Waiting time at the upper end of the spectrum (the 75th percentile) declined by over 60 percent and 110 minutes while the decline amounted to 40 percent and 25 minutes for the lower end of the spectrum.
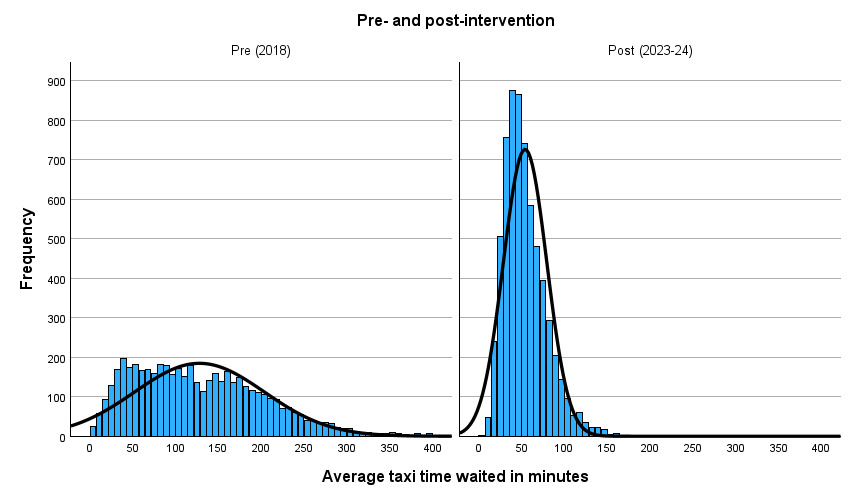
Table 2 displays three sets of results: (1) a pre- and post-intervention comparison of combined taxi waiting times for all dispatchers with a recorded waiting history at Oslo Airport Gardermoen in 2018 and/or 2023/24; (2) a pre- and post-intervention comparison of individual dispatchers that were operational in both periods; and (3) a pre- and post-intervention comparison of waiting times based on dispatcher ownership structure.
While the magnitude of waiting times varied across dispatchers and ownership structures, the results consistently indicate a significant reduction in post-intervention waiting times across all categories. Overall, the average waiting time was more than halved following the intervention. Among dispatchers that were operational in both periods, those with the longest pre-intervention waiting times generally continued to have the highest post-intervention waiting times, though the number of minutes waited were substantially lower and the variance between operators is reduced. For instance, dispatchers with the longest pre-intervention waiting times saw their mean waiting time drop from 3.25 hours to just under 1.5 hours. Meanwhile, drivers from TDs with the shortest pre-intervention waiting times experienced a decline from 70 minutes to 40 minutes.
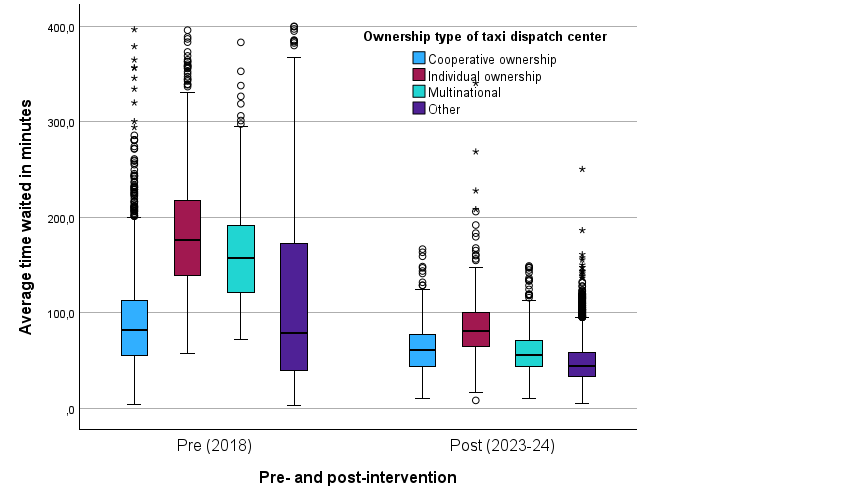
Beyond individual TDs, we also analyzed whether dispatcher ownership structures influenced waiting time disparities among drivers. The results (last batch in table 2) confirm that ownership structure does indeed correlate with taxi drivers’ waiting times. Before the intervention, drivers associated with cooperatively owned dispatchers had the shortest average waiting times, while those linked to multinational or individually owned dispatchers had the longest. Post-intervention, waiting times fell across all ownership types. However, drivers associated with individually owned dispatchers still recorded the highest average waiting time (85 minutes), while other ownership categories ranged between 47 and 62 minutes.
To further explore differences in waiting times across ownership types, we conducted pairwise comparisons among ownership types separately for each period. The one-way ANOVA results in table 3 reveal that in 2018 (pre-intervention), drivers under cooperatively owned dispatchers had the shortest waiting times. By 2023/24, the category labeled as “other” – comprising of independent owner-drivers that are not specifically linked to dispatchers whose numbers increased dramatically following a national change in taxi regulation in 2020 (NOU 2024; Oppegaard et al. 2023). These operators mostly do street work or rides booked through Bolt and Uber. These exhibited the shortest mean waiting times. Notably, drivers affiliated with multinational dispatchers experienced the most substantial post-intervention reduction in waiting time, now aligning with the levels observed among cooperative dispatchers.
Tables 2 and 3, together with figures 2 and 3, show that the time waited was reduced both for the total population of taxis that were in operation, at each of the TDs that were present in both the pre- and post-intervention period and across all categories of TD ownership.
_that_were_operational_both_pre-and_post-int.png)

For passengers we do not have data on waiting times in the pre-intervention situation. In the post intervention median time elapsed between the booking is registered and the vehicle is leaving the airport with passengers onboard is 129 seconds.
DISCLOSURE AND CONFLICT OF INTEREST
This article is funded by the Markets and Governance research program. Data has been provided by the taxi depot operators Taxi Depot AS and Fast Travel AS. The authors declare that neither this funding nor any other factor cause a conflict of interest. We gratefully acknowledge the work of Espen Johnsson in preparing the data and Nils Fearnley in commenting on the paper at an early stage.