Processing math: 0%
Skip to main content
null
Findings
  • Menu
  • Articles
    • Energy Findings
    • Resilience Findings
    • Safety Findings
    • Transport Findings
    • Urban Findings
    • All
  • For Authors
  • Editorial Board
  • About
  • Blog
  • covid-19
  • search

RSS Feed

Enter the URL below into your favorite RSS reader.

http://localhost:25298/feed
Transport Findings
May 22, 2025 AEST

Determinants of US Transit Bus Prices

Ayush Pandey, MS, Lewis Lehe, PhD,
public transitbusgeneralized linear modelscostspublic transport
Copyright Logoccby-sa-4.0 • https://doi.org/10.32866/001c.133936
Findings
Pandey, Ayush, and Lewis Lehe. 2025. “Determinants of US Transit Bus Prices.” Findings, May. https:/​/​doi.org/​10.32866/​001c.133936.
Save article as...▾
Download all (3)
  • Figure 1. Sina plots for the distribution of the sample and its composition over time
    Download
  • Figure 2. Price of buses by year built and power type
    Download
  • Figure 3. Price of rigid buses by length
    Download

Sorry, something went wrong. Please try again.

If this problem reoccurs, please contact Scholastica Support

Error message:

undefined

View more stats

Abstract

Using data from the American Public Transportation Association’s 2024 Public Transportation Vehicle Database, this paper estimates statistical models to explain the real prices of single-deck, rigid US transit buses in terms of their attributes. Non-electric bus prices have risen by 0.7% per year faster than inflation since 2010, while electric bus’ real prices have fallen by about 3% annually. The elasticity of price with respect to length is only 0.36, such that a 30 ft. (9.1 m) bus is only 10% cheaper than a 40 ft. (12.2 m) bus. High-floor buses are 3.4% cheaper than standard low-floor models. CNG, diesel-electric hybrid and battery electric buses cost, respectively, about 11%, 44% and 66% more than diesel buses. BYD buses are substantially cheaper than those of other manufacturers. The sample of buses is fairly homogeneous except for power type.

1. Questions

Some life-cycle cost assessments (e.g., Quarles, Kockelman, and Mohamed 2020; Krelling and Badami 2020; Holland et al. 2021) and other studies (Li, Kahn, and Nickelsburg 2015) treat buses as homogeneous except for their power types (i.e., diesel vs. electric). This study asks: How do the prices of US public transit buses vary with their attributes, such as size, floor height, etc.? The scope is limited to the United States and to single-deck, rigid transit buses.

2. Methods

We use the American Public Transportation Association’s 2024 Public Transportation Vehicle Database (PTVD) (Dickens and Bonina 2024). The PTVD is an excel file in which each row is a batch of homogeneous buses ordered by one agency in one year, with diverse information provided for each batch. To exclude errors, the data are filtered as follows:

  1. Buses in active service built 2010-2023 (inclusive). This window is two years longer than the standard bus service-life in the US (Laver et al. 2007).

  2. Buses listed as type transit: a rigid, single-deck vehicle with two doors, no luggage bays, at least 27.5 ft. (8.4 m) long.

  3. Buses with power types (i) diesel, (ii) compressed natural gas (CNG), (iii) diesel-electric hybrid, or (iv) battery-electric. These constitute over 99% of all active buses passing (a)-(b). Buses with ‘biodiesel’ power type are treated as diesel, as the definition is ambiguous and prices are similar.

  4. Buses from eight manufacturers accounting for 97% of those passing filters (a)-(c). Other busmakers seemed to have diverse errors or ambiguities. Of the eight, New Flyer, Gillig, Nova Bus, BYD and ElDorado-National are now active, while Proterra, Orion Bus Industries and North American Bus Industries are not.

  5. Buses eliminated via manual checking. For example, diesel buses made by Proterra, diesel buses listed with hybrid model numbers, or rigid buses with cutaway model numbers.

  6. Even after the above filtering, the dataset contained some outlier observations with suspiciously low or high prices given their year and power types. We suspected these were erroneously recorded, recorded with the wrong power type, or (in the case of low prices) purchased used. Hence, we removed observations with prices more than 1.5 IQR’s (interquartile range) from the median price for their year and power type, eliminating 2% of buses.

After filtering, the dataset contains 1,475 batches (rows) referring to 28,013 buses.

We converted the dataset’s nominal prices to 2023 USD using the CPI obtained from the priceR package in R (Condylios 2024). Next, we estimated Generalized Linear Models (GLM) to explain the real prices using a “log link” functions and a Gaussian distribution (Nelder and Wedderburn 1972; Dobson and Barnett 2018). The real price is modelled as a random variable that is normally distributed with mean \mu = \exp(\mathbf{X} \boldsymbol{\beta}), where \mathbf{X} represents bus attributes and \boldsymbol{\beta} is a vector of coefficients fit to the data via maximum likelihood estimation. Estimation was weighted by the number of active buses in each of the 1,475 batches (rows) passing filters. The code for the analysis is available at https://github.com/UTEL-UIUC/bus-purchase-cost-apta.

3. Findings

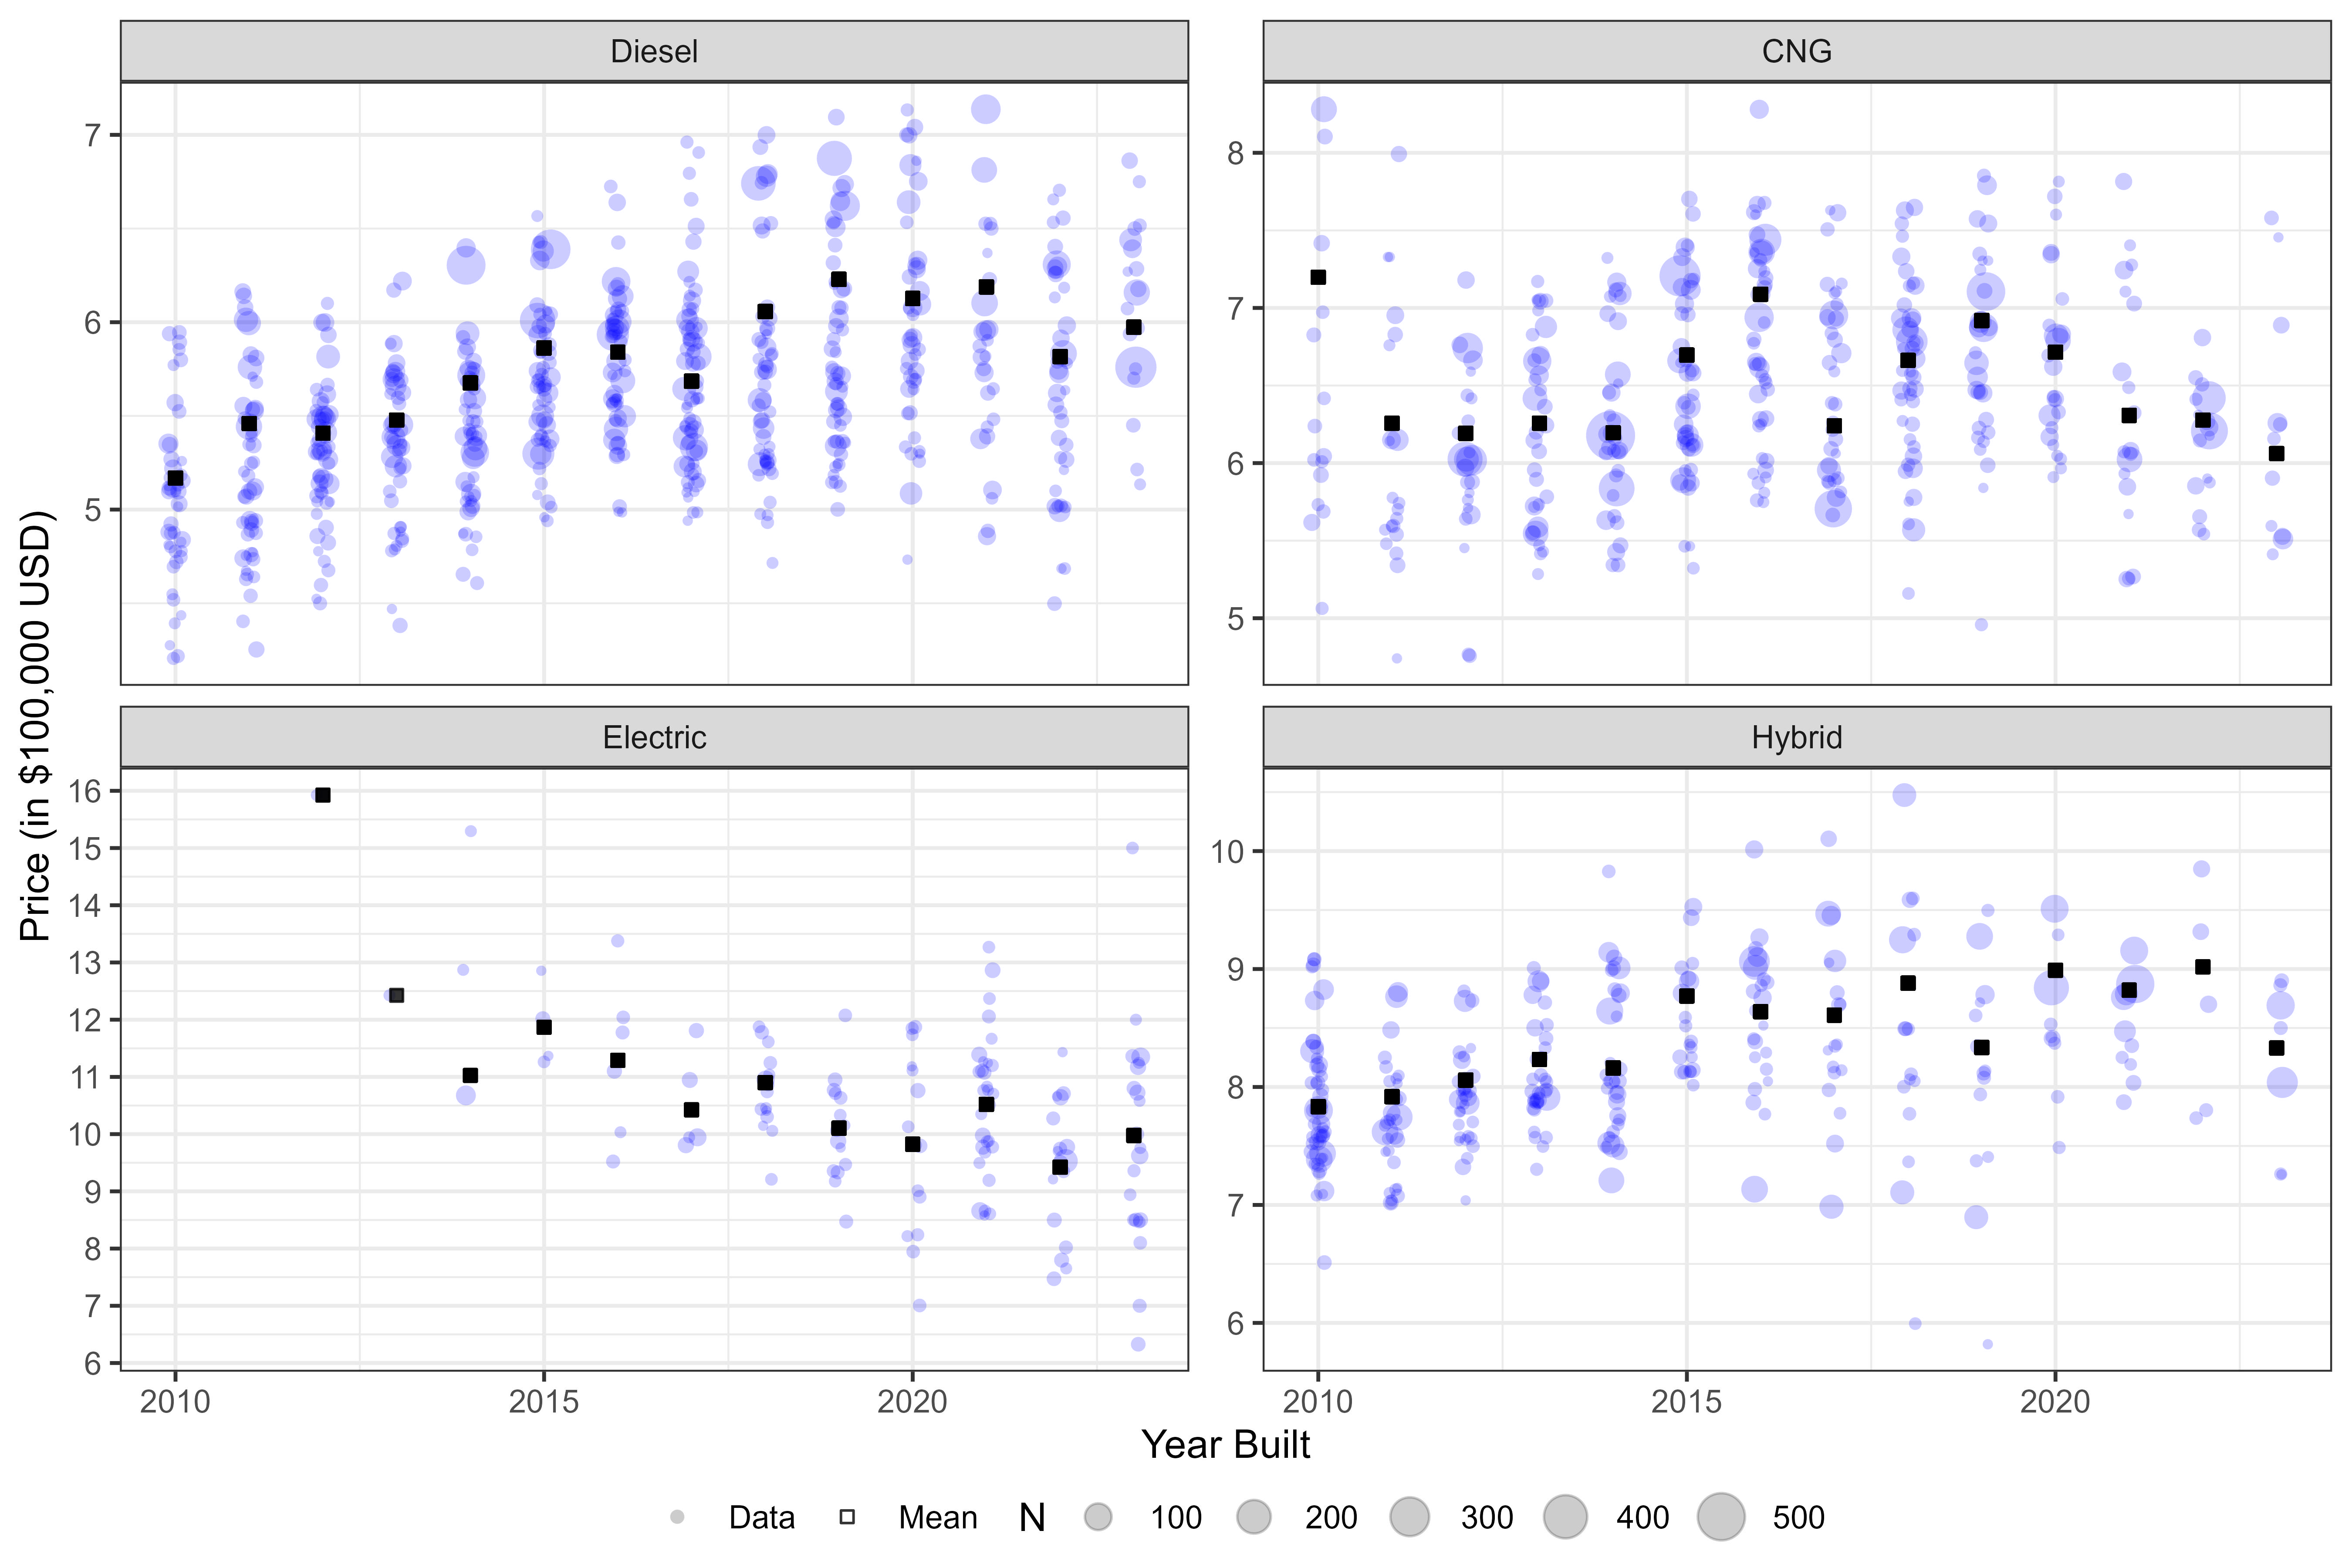
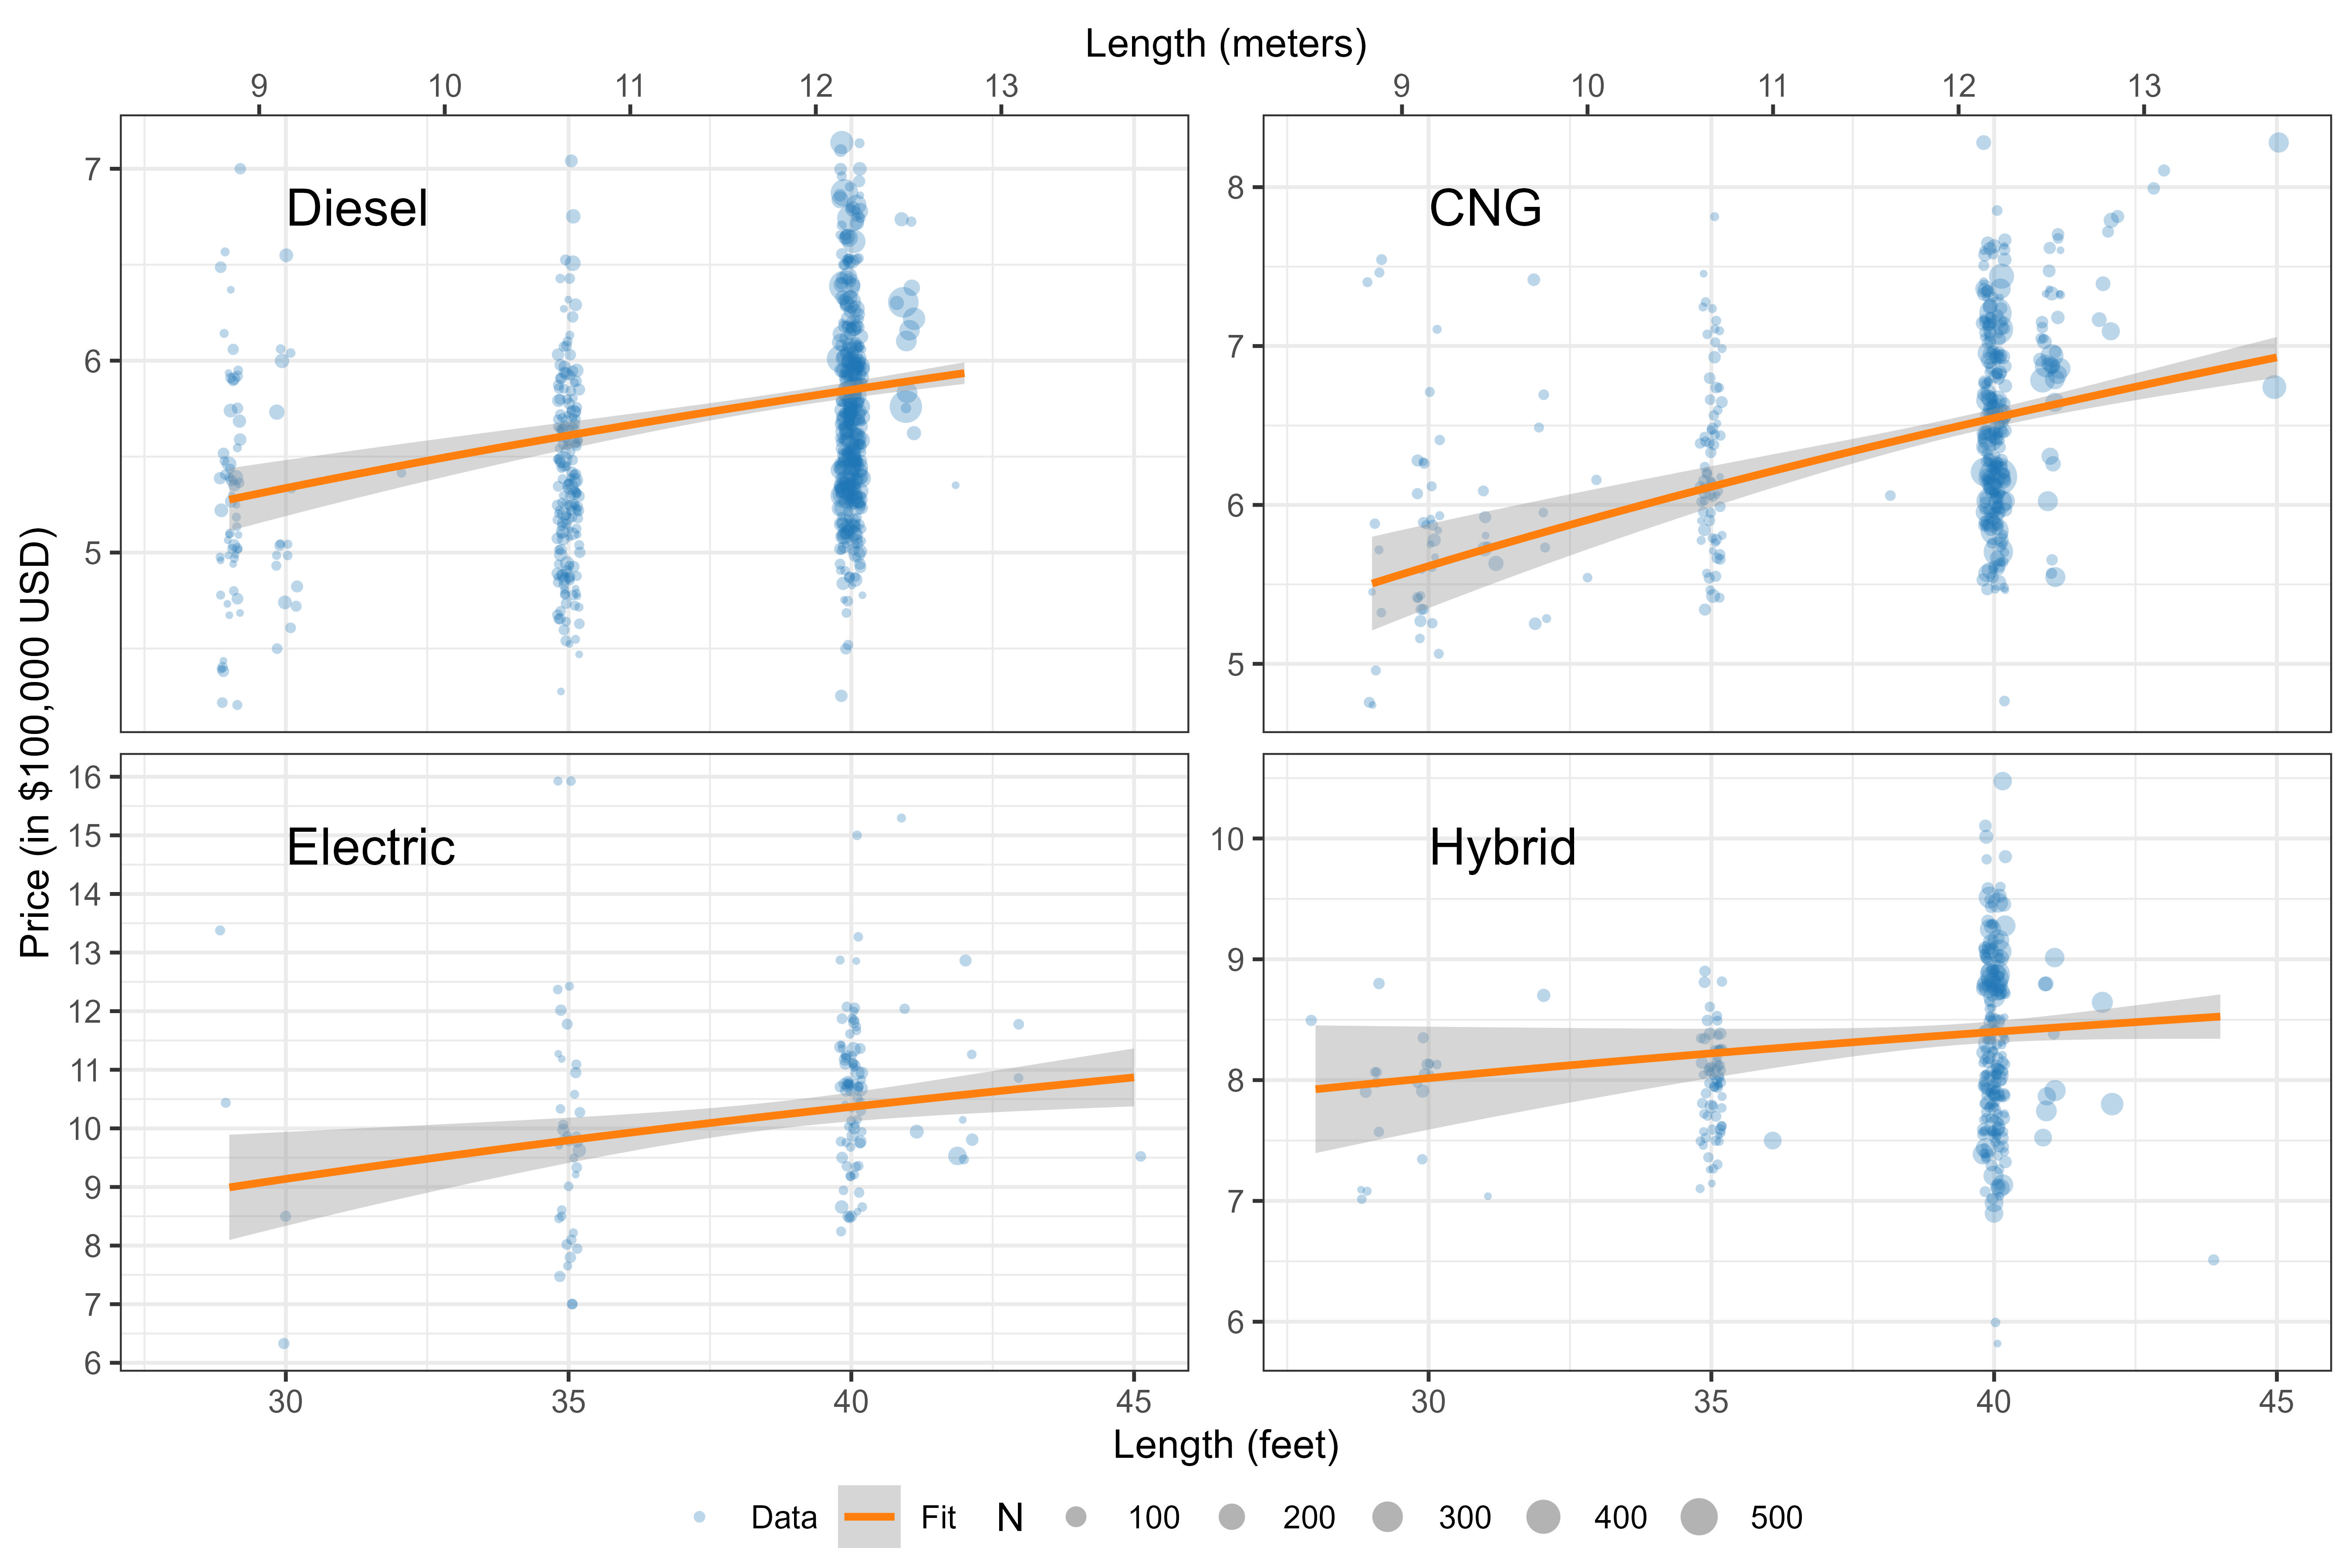
We begin with some facts about the sample. Table 1 shows the average price and count of buses by manufacturer and power type. Figure 1 shows sina (violin) plots for price, length, and seat density (the ratio of the number of seats to the product of length and width) as well as the number of buses manufactured each year. Figure 2 shows that, with the exception of electric buses, real prices (unadjusted for attributes) have generally risen over time. Figure 3 shows prices generally rise with length—albeit slowly. The sample is fairly homogeneous. Over 75% of buses are diesel or CNG, and over 75% are built by New Flyer or Gillig. 85% are 40 or 41 ft. (12.2-12.5 m) long. The dataset also includes a “floor height” indicator (low or high), although 98% of all buses are low-floor. Seat densities are around 1 seat per square yard (per 0.84 m\mathstrut^2).

Table 1.Average price and number of buses by manufacturer and power type
Manufacturer Diesel CNG Electric Hybrid all percent
Gillig Count 7,085 2,716 100 1,464 11,365 40.6
Price ($1000) 564 644 1,041 826 621
New Flyer of America Count 2,619 4,176 208 3,484 10,487 37.4
Price ($1000) 600 664 1,056 845 716
Nova Bus Count 2,093 362 381 2,836 10.1
Price ($1000) 617 575 848 642
North American Bus Ind.* Count 143 985 141 1,269 4.5
Price ($1000) 582 648 870 665
ElDorado-National Count 321 879 20 1,220 4.4
Price ($1000) 535 662 862 632
Orion Bus Ind.† Count 126 18 158 302 1.1
Price ($1000) 590 562 738 666
BYD Count 142 142 0.5
Price ($1000) 942 942
Proterra‡ Count 392 392 1.4
Price ($1000) 1,033 1,033
all Count 12,387 9,136 842 5,648 28,013
Price ($1000) 580 652 1,024 838 669
percent Count 44.2 32.6 3.0 20.2

*Purchased by New Flyer in 2013, discontinued in 2015
†Discontinued in 2012
‡Discontinued in 2023
Prices are in 2023 USD.

Figure 1
Figure 1.Sina plots for the distribution of the sample and its composition over time
Figure 2
Figure 2.Price of buses by year built and power type
Figure 3
Figure 3.Price of rigid buses by length

Table 2 reports estimation results. Model (1) covers all bus types. Its continuous variables are year, the logs of length and seat density and an interaction term “year x electric” to capture the trend apparent in Figure 2. Its discrete variables are fixed effect intercepts for high-floor body type, power types and manufacturers. The model has a relatively high (pseudo) R^2 of 0.81. Likelihood-ratio tests indicated that manufacturer fixed effects improved the model significantly, and help control for a changing mix of manufacturers over time. Model (2) was fit for electric buses as a robustness check, since electric buses appear later and have only four manufacturers. The intercept of each model is the expected price of a 40-ft (12.2 m), low-floor, New Flyer bus built in 2023 with 1 seat per square yard (0.84 m\mathstrut^2), which is diesel-powered in (1).

Table 2.Model results
All Power Types Electric Only
(1) (2)
Continuous Variables
year 0.007*** −0.030***
(0.001) (0.004)
log(seat density) −0.258*** 0.171*
(0.032) (0.085)
log(length) 0.357*** 0.294*
(0.039) (0.132)
year x electric −0.032***
(0.004)
Categorical Variables: Exponentiated coefficients are price multipliers
intercept 621,250*** 1,020,511***
(4,364) (20,879)
high floor 0.963* 1.019
(0.018) (0.057)
battery electric 1.661***
(0.027)
diesel-electric hybrid 1.435***
(0.009)
CNG 1.114***
(0.007)
BYD Motors 0.801*** 0.847***
(0.023) (0.029)
Proterra 0.906*** 0.914***
(0.018) (0.023)
Gillig 0.976*** 0.995
(0.005) (0.033)
North American Bus Industries 1.013
(0.012)
Orion Bus Industries 0.958+
(0.021)
Nova Bus 0.975**
(0.008)
ElDorado-National 0.959***
(0.012)
Num.Obs. 1475 134
AIC 37790 3560
BIC 37880 3586
LogLik −18878 −1771
R2 (Nagelkerke) 0.813 0.379

+ p < 0.1, * p < 0.05, ** p < 0.01, *** p < 0.001
Standard errors in parentheses
Power type reference category for (1): Diesel
Manufacturer reference category: New Flyer of America
Baseline length: 40ft (12.2m).
Baseline seat density: 1 seat per sq. yard (0.84 m2).
Intercept (base price) is in 2023 USD.
Num.Obs. is the number of rows in the dataset, not the number of buses.
Each observation is weighted by the number of buses in the batch.

To interpret estimated coefficients, recall the model has a log-link. The coefficient of “year” in model (1) indicates real prices of non-electric buses rose 0.7% per year, while model (2) shows real prices for electric buses falling about 3% per year. The elasticity of price with respect to length is only 0.36 in (1) and 0.29 in (2) (although the latter, smaller estimate has a larger standard error). Over the observed range of lengths (28-45 ft, or 8.5-13.7 m), these low elasticities are very close to the affine price/length relationship used in economic models such as Jara-Diaz and Gschwender (2003) and Fielbaum, Tirachini, and Alonso-Mora (2024). Surprisingly, model (1) has a significant and negative elasticity of price with respect to seat density. It seems implausible that, ceteris paribus, installing fewer seats lowers prices, but seat density may correlate with unobserved attributes (e.g., higher-quality buses intended for high-demand routes may have fewer seats) and thus should be viewed as a “control.”

For categorical variables, Table 2 reports exponentiated coefficients. CNG, hybrid, and electric buses are, respectively, about 11%, 44%, and 66% more expensive (controlling for other attributes). High-floor buses are 3.4% cheaper. The largest manufacturer effect is BYD’s 15% discount on electric buses from model (2).

Overall, the estimates suggest that ignoring variation other than power type is a reasonable, if imperfect, approximation for cost assessment or theorizing. Prices vary substantially across power types. While length has a statistically significant effect, model (1)'s price/length elasticity of 0.36 implies a 30 ft (9.1 m) bus is only 10% cheaper than a 40 ft (12.2 m) bus, when controlling for other attributes. This accords with the claim that smaller buses are not substantially cheaper (Walker 2024, Ch. 6).

Submitted: March 18, 2025 AEST

Accepted: May 06, 2025 AEST

References

Condylios, Steve. 2024. priceR: Economics and Pricing Tools. https:/​/​CRAN.R-project.org/​package=priceR.
Google Scholar
Dickens, Matthew, and Jared Bonina. 2024. “Public Transportation Vehicle Database.” American Public Transportation Association. https:/​/​www.apta.com/​research-technical-resources/​transit-statistics/​vehicle-database/​.
Dobson, Annette J., and Adrian G. Barnett. 2018. An Introduction to Generalized Linear Models. Chapman and Hall/CRC.
Google Scholar
Fielbaum, Andres, Alejandro Tirachini, and Javier Alonso-Mora. 2024. “Improving Public Transportation via Line-Based Integration of on-Demand Ridepooling.” Transportation Research Part A: Policy and Practice 190 (December):104289. https:/​/​doi.org/​10.1016/​j.tra.2024.104289.
Google Scholar
Holland, Stephen P., Erin T. Mansur, Nicholas Z. Muller, and Andrew J. Yates. 2021. “The Environmental Benefits of Transportation Electrification: Urban Buses.” Energy Policy 148:111921.
Google Scholar
Jara-Diaz, Sergio R., and Antonio Gschwender. 2003. “Towards a General Microeconomic Model for the Operation of Public Transport.” Transport Reviews 23 (4): 453–69. https:/​/​doi.org/​10.1080/​0144164032000048922.
Google Scholar
Krelling, Christian, and Madhav G. Badami. 2020. “CNG and Diesel Urban Buses in India: A Life-Cycle Cost Comparison.” International Journal of Sustainable Transportation 14 (8): 591–605. https:/​/​doi.org/​10.1080/​15568318.2019.1594468.
Google Scholar
Laver, Richard, Donald Schneck, Douglas Skorupski, Stephen Brady, Laura Cham, and Booz Allen Hamilton. 2007. “Useful Life of Transit Buses and Vans.” FTA VA-26-7229-07.1. Federal Transit Administration. https:/​/​www.transit.dot.gov/​sites/​fta.dot.gov/​files/​docs/​Useful_Life_of_Buses_Final_Report_4-26-07_rv1.pdf.
Li, Shanjun, Matthew E. Kahn, and Jerry Nickelsburg. 2015. “Public Transit Bus Procurement: The Role of Energy Prices, Regulation and Federal Subsidies.” Journal of Urban Economics 87 (May):57–71. https:/​/​doi.org/​10.1016/​j.jue.2015.01.004.
Google Scholar
Nelder, John Ashworth, and Robert W. M. Wedderburn. 1972. “Generalized Linear Models.” Journal of the Royal Statistical Society Series A: Statistics in Society 135 (3): 370–84.
Google Scholar
Quarles, Neil, Kara M. Kockelman, and Moataz Mohamed. 2020. “Costs and Benefits of Electrifying and Automating Bus Transit Fleets.” Sustainability 12 (10): 3977. https:/​/​doi.org/​10.3390/​su12103977.
Google Scholar
Walker, Jarrett. 2024. Human Transit, Revised Edition: How Clearer Thinking about Public Transit Can Enrich Our Communities and Our Lives. Island Press.
Google Scholar

This website uses cookies

We use cookies to enhance your experience and support COUNTER Metrics for transparent reporting of readership statistics. Cookie data is not sold to third parties or used for marketing purposes.

Powered by Scholastica, the modern academic journal management system