Loading [Contrib]/a11y/accessibility-menu.js
Skip to main content
null
Findings
  • Menu
  • Articles
    • Energy Findings
    • Resilience Findings
    • Safety Findings
    • Transport Findings
    • Urban Findings
    • All
  • For Authors
  • Editorial Board
  • About
  • Blog
  • covid-19
  • search

RSS Feed

Enter the URL below into your favorite RSS reader.

http://localhost:42874/feed
Urban Findings
March 27, 2025 AEST

The Rise and Fall of Twitter Data in Urban Analytics

Paddy Smith, Myles Gould, Ed Manley,
BibliometricsTwitterResearch TrendsTopic Modeling
Copyright Logoccby-sa-4.0 • https://doi.org/10.32866/001c.133245
Findings
Smith, Paddy, Myles Gould, and Ed Manley. 2025. “The Rise and Fall of Twitter Data in Urban Analytics.” Findings, March. https:/​/​doi.org/​10.32866/​001c.133245.
Save article as...▾
Download all (4)
  • Figure 1. Normalized publication rates for Urban Research, Urban Research using SM Data and Urban Research using Twitter Data
    Download
  • Figure 2. Percentage share of identified urban research papers using SM by different platform
    Download
  • Figure 3. Most frequently used SM data source for urban research topics
    Download
  • Urban research papers using SM data
    Download

Sorry, something went wrong. Please try again.

If this problem reoccurs, please contact Scholastica Support

Error message:

undefined

View more stats

Abstract

Twitter has established itself as a valuable social media platform for urban research over the last 10 years, by providing free and accessible data. However, recent shift towards the monetization of its data, raises questions on its future use. To investigate this, bibliometric analysis and topic modeling techniques are used to explore trends in urban research publications and wider consequences of reduced data access. The results illustrate a period of ‘hype’ towards Twitter data, followed by decline in recent years. Application areas and topics are also identified, highlighting the distinct ways in which social media data contributes to urban research.

1. Questions

This bibliometric analysis addresses two questions, 1) Is use of Twitter data declining in urban research? 2) What might be lost for urban research if Twitter data remains less accessible?

The focus on Twitter (now ‘X’ but referred to as Twitter) within urban research is a result of recent changes to data access. In 2023, Twitter introduced monetized access tiers and a limited ‘free’ tier. The number of Tweets that can be collected for free reduced from 500,000 to 1,500 per month (Mehta 2023). For the monetized tiers, ‘Basic’ costs $100 a month for 10,000 Tweets, ‘Pro’ costs $5,000 per month for 1m tweets, and above these costs are negotiable for projects/organizations (X 2024). Generally, urban research that have previously used Twitter data would fall into the ‘Pro’ or above categories, as it is typical to use more than 1m tweets i.e. 11m Tweets (Claramunt et al. 2011) or 275m Tweets (Murty, Gross, and Pensavalle 2016).

As a result of these changes, Twitter’s attractiveness, and accessibility as a data source for urban research has been potentially undermined (Davidson et al. 2023). To understand the implications of these changes, it is useful to investigate the trends in use of social media data within urban research.

2. Methods

Papers reporting urban research that use social media (SM) data were extracted from Web of Science and Scopus, up until 1st January 2025. To search for and analyze the papers, a bibliometric analysis procedure was adopted based on Donthu et al. (2021) methodology. Firstly, search terms were used to identify journal articles and conference papers, employing terms related to 'urban’, ‘social media’ and data analysis or data types (i.e. ‘mining’, ‘geotag’). Searches were made within the title, abstract and keywords, and filtered using urban related topics, retrieving 2,812 papers. A qualitative review was performed on all abstracts to identify SM data sources. During which, irrelevant papers were removed, and a total 1,409 papers remained. A further search identified 122,398 urban research papers, by reducing search terms to ‘urban’ keywords and filtering for urban related topics.

Topic modeling was performed on the 1,409 urban SM abstracts using BERTopic model (Bidirectional Encoder Representations from Transformations) (Grootendorst 2022). BERTopic converts all documents to embedding representations using a pre-trained language model (Grootendorst 2022). Embeddings are then clustered, and topic representations extracted using a term frequency-inverse document frequency (TF-IDF) measure (Grootendorst 2022). Each abstract was assigned a topic, whilst outliers (not assigned a topic) were redistributed using BERTopic outlier reduction function. Similar topics were merged, and topic names were derived from keywords and representative documents.

3. Findings

Of the 1,409 urban SM research papers, 76 different SM platforms were identified as a data source. Twitter was observed as most frequently used, accounting for 35.7% of all papers, followed by Weibo (15.5%) (Table 1). In comparison, an earlier review by Stock (2018) on SM data in geospatial research, reported a larger share for Twitter (54.2%) and limited use of Weibo (2.9%). The popularity of Chinese social media platforms in urban research (Weibo, WeChat, Dianping, Tencent QQ) was also not previously identified (Stock 2018).

Table 1.Top 10 most used social media data source in urban SM research papers (research papers using multiple SM data sources are counted separately)
Social Media Platform % Urban SM Research Papers
Twitter 35.7%
Weibo 15.5%
Instagram 7%
Foursquare 6.8%
Flickr 6.2%
Facebook 6.1%
WeChat 3.5%
Dianping 2.4%
Tencent QQ 1.7%
Strava 1.2%

Observing temporal trends in publications, Figure 1 shows steady growth in SM data in urban research from 2011. Growth peaks between 2018-2021, as the publication rate exceeds urban research, highlighting widespread use of SM data. Publication rate then starts to decline from 2021. Despite this, publication rate is above earlier levels, suggesting SM remains a relevant data source however its growth is shifting.

Urban research using Twitter data shows a similar trend but with some key differences. It’s growth starts earlier than SM data, and rises more sharply between 2013-2018, indicating it’s popularity over other SM data sources (Figure 1). Publication rate also declines earlier and shows a more appreciable drop from 2022, suggesting Twitter data is declining more intensely.

Figure 1
Figure 1.Normalized publication rates for Urban Research, Urban Research using SM Data and Urban Research using Twitter Data

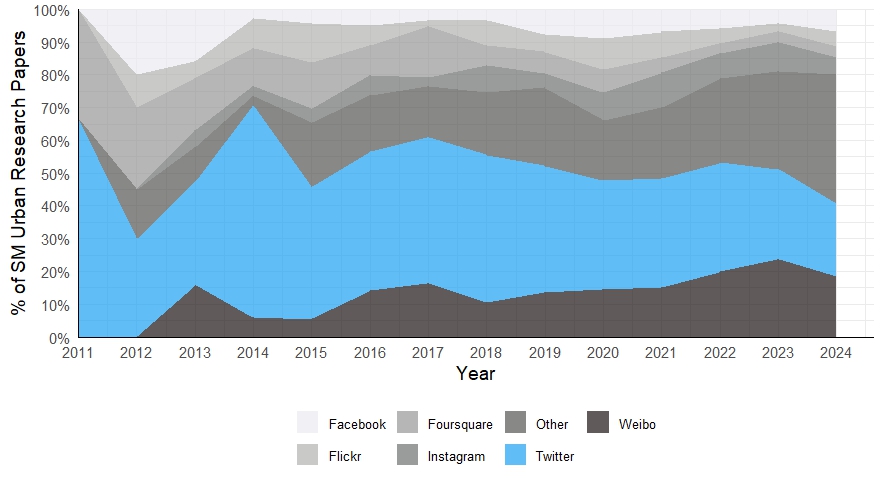
When Twitter is compared to other SM data sources in urban research, Figure 2 shows in more detail the declining share of Twitter from 2022. Most other SM platforms fluctuate in publications across the period, but have showed previous drops in usage (Facebook, Foursquare and Flickr). Only Weibo and ‘Other’ platforms are substantially increasing their share.

Figure 2
Figure 2.Percentage share of identified urban research papers using SM by different platform

To explore what might be lost for urban research from declining use of SM data, topics were identified in the urban SM research papers (Table 2). From the topics, broad application areas can be defined which align to previously reported urban SM research areas (Niu and Silva 2020). Mobility/Activity flows (30.3% of papers) are the most common focus, typically leveraging spatio-temporal data to analyze urban movement and activity. Research on urban perception is also frequently studied (26% of papers), often utilizing text and image data to capture experiences and emotions about urban spaces.

Table 2.Application areas (bold) and topics (1-15) identified from BERTopic analysis (Keywords are three most frequently used)
Application Area & Topic Keywords Representative Documents %
Mobility/Activity Patterns 30.30%
(13) Mobility and Activity Flows trajectories, mobility, activities Rizwan et al. (2020) and Yin and Chi (2021) 19.30%
(9) Urban Functional Areas and Vibrancy buildings, residential, areas Lang et al. (2022) and M. Li et al. (2016) 9.20%
(1) Cycling cycling, bricycle, mobrility Brum-Bastos et al. (2019) and Livingston et al. (2021) 1.70%
Urban Perception 26.30%
(3) Green Space park, visitors, recreation J. Li et al. (2024) and Ma et al. (2023) 11.50%
(7) Tourism tourists, attractions, destinations Gunter and Önder (2021) and Païl I Agustí (2018) 8.20%
(5) Emotions and Sentiment Detection emotions, sentiment, environment Ashkezari-Toussi et al. (2019) and Duan et al. (2022) 6.50%
Event Detection/Emergency Management 17.60%
(4) Pandemic and Cowid-19 epidemic, pandemic, outbreak Sun et al. (2024) and Wu et al. (2022) 6.50%
(14) Traffic Management/Transport traffic, congestion, transportation Huang et al. (2019) and Shoaeinamini et al. (2022) 6.30%
(12) Disasters and Flooding disasters, floods, spatiotemporal Xu et al. (2016) and Yigitcanlar et al. (2022) 4.80%
Urban Planning/Management 17.30%
(6) Smart Cities and Civic Engagement municipalitiek, infrastructure, initiatives Molinillo et al. (2019) and Stan and Tasente (2024) 8.30%
(15) Neighborhoods and Urban Areas geographiek, neighborhoods, kegregation Levy et al. (2020) and Poorthuis et al. (2022) 5.80%
(2) Land Use Classification land, classification, urbanization Zhan et al. (2014) and X. Zhao et al. (2023) 3.30%
Social Dynamics 8.50%
(11) Communities and Migration cultures, communities, migrant Te Lintelo et al. (2024) and Verselinov et al. (2021) 4.10%
(10) Protest and Activism protests, activism, political Askanins (2013) and M. Zhao et al. (2018) 2.30%
(8) Cultures and Languages cultures, communities, language. Väisinnen et al. (2022) and N. Zhao and Cao (2017) 2.10%

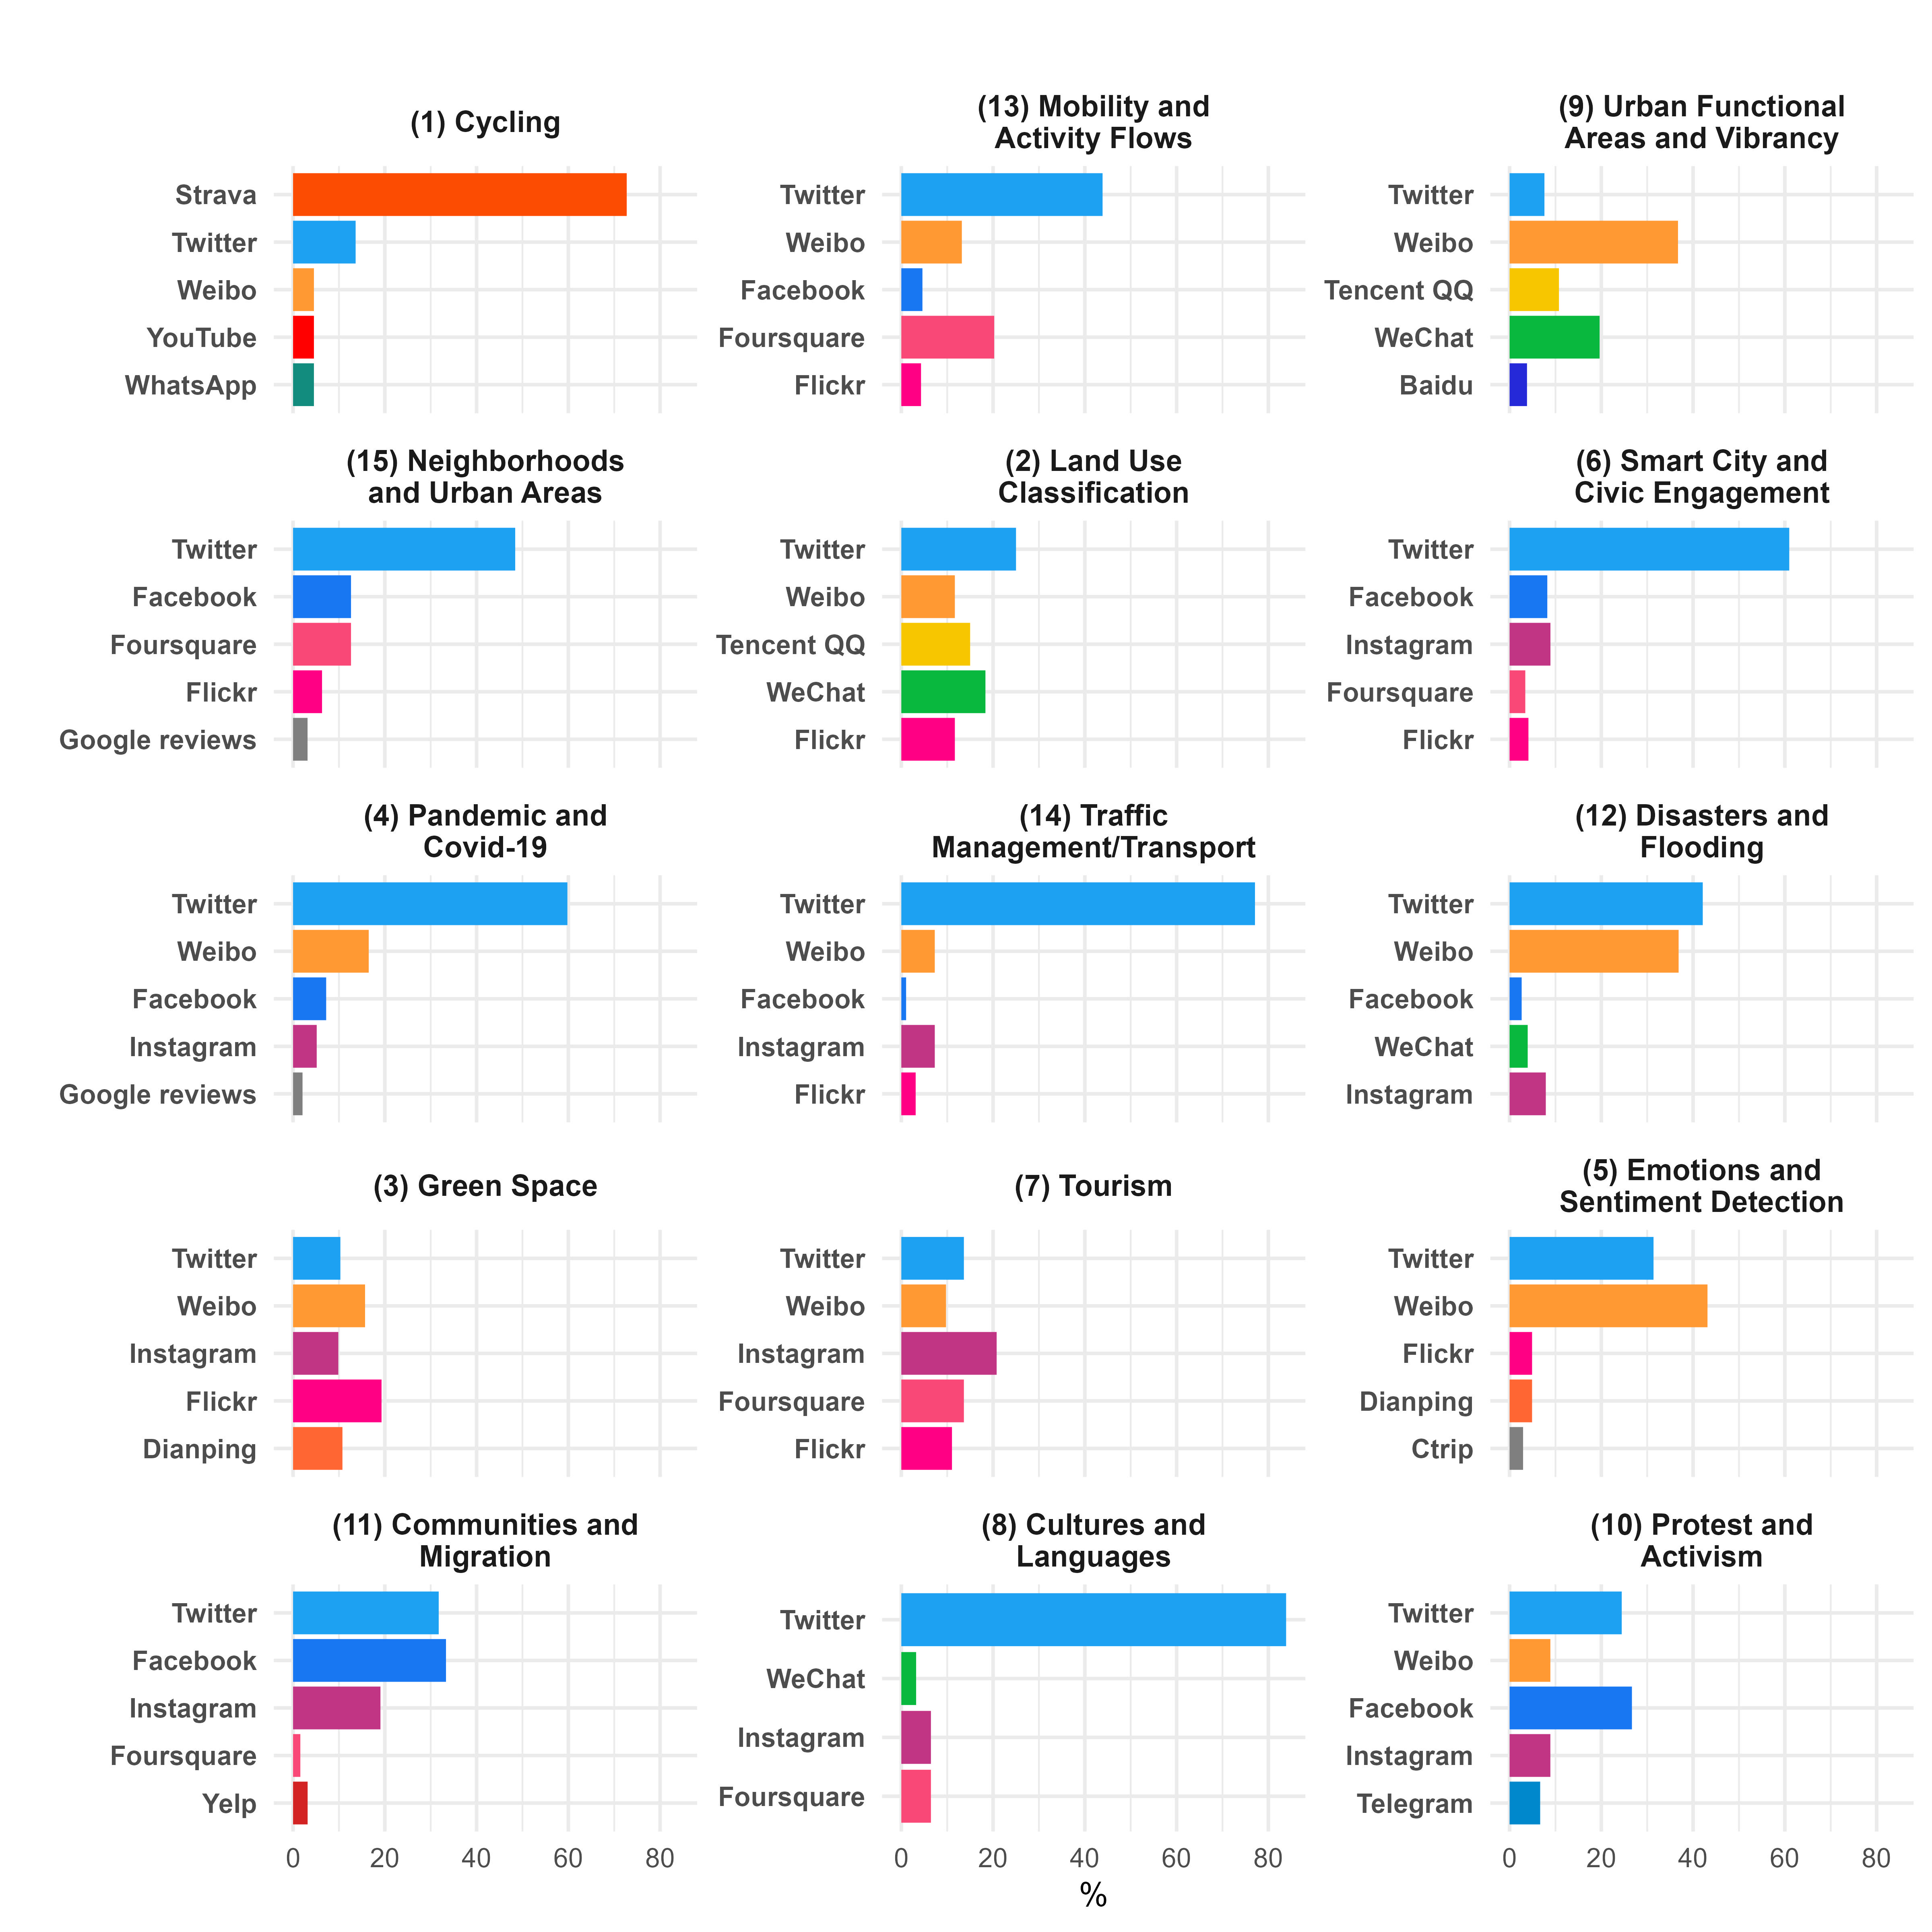
SM platforms contribute differently to urban topics, as shown in Figure 3. Twitter is frequently used across most topics. Previous findings have shown the overwhelming use of the ‘geotag’ in geospatial research, which are commonly collected from Twitter (Stock 2018). Foursquare, Flickr and Instagram are often applied to urban perception topics (3,7), due to providing geo-located image data. Chinese SM platforms (Weibo, WeChat and Tencent QQ) are present across many topics, but contribute frequently to a few (5, 9, 12). The variation in SM data source by urban topic, suggests changes in data accessibility could possibly reshape not only the volume of research but also the types of urban phenomena that can be studied.

Figure 3
Figure 3.Most frequently used SM data source for urban research topics

This analysis highlights a broad decline in the use of SM data in urban research, with a notable drop in Twitter data. The reasons for this shift remain unclear, though reduced accessibility and declining interest in the platform may be contributing factors. This trend could continue, with active U.S. users of X decreasing by 8.4% since October 2024, while its competitor Bluesky has grown its user base by 1,064% (Boyd 2024). It will remain to be seen whether the decline in Twitter data access will prompt researchers to look elsewhere for urban analytics, and whether new forms of data can fill the gap that is left.

Submitted: November 08, 2024 AEST

Accepted: March 19, 2025 AEST

References

Ashkezari-Toussi, Soheila, Mohammad Kamel, and Hadi Sadoghi-Yazdi. 2019. “Emotional Maps Based on Social Networks Data to Analyze Cities Emotional Structure and Measure Their Emotional Similarity.” Cities 86:113–24. https:/​/​doi.org/​10.1016/​j.cities.2018.09.009.
Google Scholar
Askanius, Tina. 2013. “Protest Movements and Spectacles of Death: From Urban Places to Video Spaces.” In Research in Social Movements, Conflicts and Change, edited by Nicole Doerr, Alice Mattoni, and Simon Teune, 35:105–33. Emerald Group Publishing Limited. https:/​/​doi.org/​10.1108/​S0163-786X(2013)0000035009.
Google Scholar
Boyd, Raphael. 2024. “From x to Bluesky: Why Are People Abandoning Twitter’s Digital Town Square?” The Guardian. 2024. https:/​/​www.theguardian.com/​media/​2024/​dec/​11/​from-x-to-bluesky-why-are-people-abandoning-twitter-digital-town-square?CMP=share_btn_url.
Brum-Bastos, Vanessa, Colin J. Ferster, Trisalyn Nelson, and Meghan Winters. 2019. “Where to Put Bike Counters? Stratifying Bicycling Patterns in the City Using Crowdsourced Data.” Transport Findings. https:/​/​doi.org/​10.32866/​10828.
Google Scholar
Claramunt, Christophe, Sergei Levashkin, Michela Bertolotto, Shoko Wakamiya, and Kazutoshi. Sumiya. 2011. “Urban Area Characterization Based on Semantics of Crowd Activities in Twitter.” In GeoSpatial Semantics, 108–23. Berlin, Heidelberg: Springer Berlin Heidelberg. https:/​/​doi.org/​10.1007/​978-3-642-20630-6_7.
Google Scholar
Davidson, Brittany, Darja Wischerath, Daniel Racek, Douglas A Parry, Emily Godwin, Joanne Hinds, Dirk Van Der Linden, Johnathan F Roscoe, Laura Ayravainen, and Alicia G. Cork. 2023. “Platform-Controlled Social Media APIs Threaten Open Science.” Nature Human Behaviour 7 (12): 2054–57. https:/​/​doi.org/​10.1038/​s41562-023-01750-2.
Google Scholar
Donthu, Naveen, Satish Kumar, Debmalya Mukherjee, Nitesh Pandey, and Weng Marc. Lim. 2021. “How to Conduct a Bibliometric Analysis: An Overview and Guidelines.” Journal of Business Research 133:285–96. https:/​/​doi.org/​10.1016/​j.jbusres.2021.04.070.
Google Scholar
Duan, Sutian, Zhiyong Shen, and Xiao Luo. 2022. “Exploring the Relationship between Urban Youth Sentiment and the Built Environment Using Machine Learning and Weibo Comments.” International Journal of Environmental Research and Public Health 19 (8): 4794. https:/​/​doi.org/​10.3390/​ijerph19084794.
Google Scholar
Grootendorst, Maarten. 2022. “BERTopic: Neural Topic Modeling with a Class-Based TF-IDF Procedure.” ArXiv. https:/​/​doi.org/​10.48550/​ARXIV.2203.05794.
Google Scholar
Gunter, Ulrich, and Irem Önder. 2021. “An Exploratory Analysis of Geotagged Photos From Instagram for Residents of and Visitors to Vienna.” Journal of Hospitality & Tourism Research 45 (2): 373–98. https:/​/​doi.org/​10.1177/​1096348020963689.
Google Scholar
Huang, Wei, Shishuo Xu, Yingwei Yan, and Alexander Zipf. 2019. “An Exploration of the Interaction between Urban Human Activities and Daily Traffic Conditions: A Case Study of Toronto, Canada.” Cities 84:8–22. https:/​/​doi.org/​10.1016/​j.cities.2018.07.001.
Google Scholar
Lang, Wei, Hao Lang, Eddie C. M. Hui, Tingting Chen, Jiemin Wu, and Marianne Jahre. 2022. “Measuring Urban Vibrancy of Neighborhood Performance Using Social Media Data in Oslo, Norway.” Cities 131:103908. https:/​/​doi.org/​10.1016/​j.cities.2022.103908.
Google Scholar
Levy, Brian L., Nolan E. Phillips, and Robert J. Sampson. 2020. “Triple Disadvantage: Neighborhood Networks of Everyday Urban Mobility and Violence in U.S. Cities.” American Sociological Review 85 (6): 925–56. https:/​/​doi.org/​10.1177/​0003122420972323.
Google Scholar
Li, Jie, Jun Gao, Zhonghao Zhang, Jing Fu, Guofan Shao, Zhenyu Zhao, and Panpan Yang. 2024. “Insights into Citizens’ Experiences of Cultural Ecosystem Services in Urban Green Spaces Based on Social Media Analytics.” Landscape and Urban Planning 244:104999. https:/​/​doi.org/​10.1016/​j.landurbplan.2023.104999.
Google Scholar
Li, Miaoyi, Zhenjiang Shen, and Xinhua Hao. 2016. “Revealing the Relationship between Spatio-Temporal Distribution of Population and Urban Function with Social Media Data.” GeoJournal 81 (6): 919–35. https:/​/​doi.org/​10.1007/​s10708-016-9738-7.
Google Scholar
Livingston, Mark, David McArthur, Jinhyun Hong, and Kirstie English. 2021. “Predicting Cycling Volumes Using Crowdsourced Activity Data.” Environment and Planning B: Urban Analytics and City Science 48 (5): 1228–44. https:/​/​doi.org/​10.1177/​2399808320925822.
Google Scholar
Ma, Dongfang, Shaojie Zhang, Tieqiao Xiao, and Taotao Shui. 2023. “Aspects of New and Old Urban Parks Most Valued by Residents on Social Media: A Case Study in Hefei.” Sustainability 15 (18): 13771. https:/​/​doi.org/​10.3390/​su151813771.
Google Scholar
Mehta, Ivan. 2023. “Twitter Announces New API with Only Free, Basic and Enterprise Levels.” 2023. https:/​/​techcrunch.com/​2023/​03/​29/​twitter-announces-new-api-with-only-free-basic-and-enterprise-levels/​#:~:text=Earlier%2C%20with%20the%20introduction%20of,2%20million%20tweets%20per%20month.
Molinillo, Sebastian, Rafael Anaya-Sánchez, Alastair M. Morrison, and J. Andres Coca-Stefaniak. 2019. “Smart City Communication via Social Media: Analysing Residents’ and Visitors’ Engagement.” Cities 94:247–55. https:/​/​doi.org/​10.1016/​j.cities.2019.06.003.
Google Scholar
Murty, Dhiraj, Alexander Gross, and Alexander. Pensavalle. 2016. “Urban Social Media Demographics: An Exploration of Twitter Use in Major American Cities: Urban Social Media Demographics.” Journal of Computer-Mediated Communication 21 (1): 33–49. https:/​/​doi.org/​10.1111/​jcc4.12144.
Google Scholar
Niu, Haifeng, and Elisabete A. Silva. 2020. “Crowdsourced Data Mining for Urban Activity: Review of Data Sources, Applications, and Methods.” Journal of Urban Planning and Development 146 (2): 04020007. https:/​/​doi.org/​10.1061/​(ASCE)UP.1943-5444.0000566.
Google Scholar
Paül I Agustí, Daniel. 2018. “Characterizing the Location of Tourist Images in Cities. Differences in User-Generated Images (Instagram), Official Tourist Brochures and Travel Guides.” Annals of Tourism Research 73:103–15. https:/​/​doi.org/​10.1016/​j.annals.2018.09.001.
Google Scholar
Poorthuis, Ate, Taylor Shelton, and Matthew Zook. 2022. “Changing Neighborhoods, Shifting Connections: Mapping Relational Geographies of Gentrification Using Social Media Data.” Urban Geography 43 (7): 960–83. https:/​/​doi.org/​10.1080/​02723638.2021.1888016.
Google Scholar
Rizwan, Muhammad, Wanggen Wan, and Luc Gwiazdzinski. 2020. “Visualization, Spatiotemporal Patterns, and Directional Analysis of Urban Activities Using Geolocation Data Extracted from LBSN.” ISPRS International Journal of Geo-Information 9 (2): 137. https:/​/​doi.org/​10.3390/​ijgi9020137.
Google Scholar
Shoaeinaeini, Maryam, Oktay Ozturk, and Deepak Gupta. 2022. “Twitter-Informed Prediction for Urban Traffic Flow Using Machine Learning.” In 2022 6th International Conference on Universal Village (UV), 1–6. IEEE. https:/​/​doi.org/​10.1109/​UV56588.2022.10185516.
Google Scholar
Stan, Mari-Isabella, and Tănase Tasențe. 2024. “Citizen-Centric Smart Cities: Empowering Public Administration through Social Media and Citizen Engagement.” Hrvatska i Komparativna Javna Uprava 23 (4): 529–58. https:/​/​doi.org/​10.31297/​hkju.23.4.5.
Google Scholar
Stock, Kristin. 2018. “Mining Location from Social Media: A Systematic Review.” Computers, Environment and Urban Systems 71:209–40. https:/​/​doi.org/​10.1016/​j.compenvurbsys.2018.05.007.
Google Scholar
Sun, Peijin, Jie Sun, Lan Jin, and Yan Zhu. 2024. “COVID-19 Pandemic Changes the Outdoor Physical Activity Preference in Chinese City: A 7-Year GPS Trajectory Data Analysis.” Cities 152:105253. https:/​/​doi.org/​10.1016/​j.cities.2024.105253.
Google Scholar
Te Lintelo, Dolf J. H., Kevin Hernandez, and Rajith Lakshman. 2024. “Migrant Digital Placemaking for Wellbeing: A Netnography of Facebook Groups.” Wellbeing, Space and Society 6:100196. https:/​/​doi.org/​10.1016/​j.wss.2024.100196.
Google Scholar
Väisänen, Tuomas, Olle Järv, Tuuli Toivonen, and Tuomo Hiippala. 2022. “Mapping Urban Linguistic Diversity with Social Media and Population Register Data.” Computers, Environment and Urban Systems 97:101857. https:/​/​doi.org/​10.1016/​j.compenvurbsys.2022.101857.
Google Scholar
Vesselinov, Elena, Sebastián F. Villamizar-Santamaría, Charles J. Gomez, and Eva M. Fernández. 2021. “A Global Community or a Global Waste of Time? Content Analysis of the Facebook Site ‘Humans of New York.’” Journal of Urban Affairs 43 (1): 117–39. https:/​/​doi.org/​10.1080/​07352166.2019.1697184.
Google Scholar
Wu, Guobin, Xiaopeng Deng, and Bingsheng Liu. 2022. “Managing Urban Citizens’ Panic Levels and Preventive Behaviours during COVID-19 with Pandemic Information Released by Social Media.” Cities 120:103490. https:/​/​doi.org/​10.1016/​j.cities.2021.103490.
Google Scholar
X. 2024. “X API Documentation.” 2024. https:/​/​developer.x.com/​en/​products/​x-api.
Xu, Zheng, Hui Zhang, Vijayan Sugumaran, Kim-Kwang Raymond Choo, Lin Mei, and Yiwei Zhu. 2016. “Participatory Sensing-Based Semantic and Spatial Analysis of Urban Emergency Events Using Mobile Social Media.” EURASIP Journal on Wireless Communications and Networking 2016 (1): 44. https:/​/​doi.org/​10.1186/​s13638-016-0553-0.
Google Scholar
Yigitcanlar, Tan, Massimo Regona, Nayomi Kankanamge, Rashid Mehmood, Justin D’Costa, Samuel Lindsay, Scott Nelson, and Adiam Brhane. 2022. “Detecting Natural Hazard-Related Disaster Impacts with Social Media Analytics: The Case of Australian States and Territories.” Sustainability 14 (2): 810. https:/​/​doi.org/​10.3390/​su14020810.
Google Scholar
Yin, Junjun, and Guangqing Chi. 2021. “Characterizing People’s Daily Activity Patterns in the Urban Environment: A Mobility Network Approach with Geographic Context-Aware Twitter Data.” Annals of the American Association of Geographers, 1–21. https:/​/​doi.org/​10.1080/​24694452.2020.1867498.
Google Scholar
Zhan, Xianyuan, Satish V. Ukkusuri, and Feng Zhu. 2014. “Inferring Urban Land Use Using Large-Scale Social Media Check-in Data.” Networks and Spatial Economics 14 (3–4): 647–67. https:/​/​doi.org/​10.1007/​s11067-014-9264-4.
Google Scholar
Zhao, Miaoxi, Yanliu Lin, and Ben Derudder. 2018. “Demonstration of Public Participation and Communication through Social Media in the Network Society within Shanghai.” Environment and Planning B: Urban Analytics and City Science 45 (3): 529–47. https:/​/​doi.org/​10.1177/​2399808317690154.
Google Scholar
Zhao, Naizhuo, and Guofeng Cao. 2017. “Quantifying and Visualizing Language Diversity of Hong Kong Using Twitter.” Environment and Planning A: Economy and Space 49 (12): 2698–2701. https:/​/​doi.org/​10.1177/​0308518X17722369.
Google Scholar
Zhao, Xin, Nan Xia, ManChun Li, and Yunyun Xu. 2023. “Mapping Urban Land Type with Multi-Source Geospatial Big Data: A Case Study of Shenzhen, China.” Journal of Maps 19 (1): 2273833. https:/​/​doi.org/​10.1080/​17445647.2023.2273833.
Google Scholar

This website uses cookies

We use cookies to enhance your experience and support COUNTER Metrics for transparent reporting of readership statistics. Cookie data is not sold to third parties or used for marketing purposes.

Powered by Scholastica, the modern academic journal management system