

1. Questions
While cycling infrastructure has a positive impact on cycling safety (Pucher and Buehler 2016), relatively few studies have compared the safety of different bikeway designs (Marqués and Hernández-Herrador 2017). Historically, the lack of data on infrastructure characteristics and cyclist flows has made it difficult to carry out analyses on this topic, with many studies failing to account for cyclist exposure (DiGioia et al. 2017; Ling et al. 2020). Increased data availability on cyclist flows – often using modelled or crowdsourced data (Adams and Aldred 2020; Saad et al. 2019; Garber et al. 2023) – has started to redress this gap, but there exists a need for further research in this area, particularly since findings might not be generalizable from one context to another.
While previous studies have generally only looked at either two- or one-way bike lanes (Thomas and DeRobertis 2013), there is a lack of studies comparing one- and two-way bike lanes in the same city. This paper addresses this research gap by asking an apparently simple question: Are two-way bike lanes more dangerous than one-way ones?
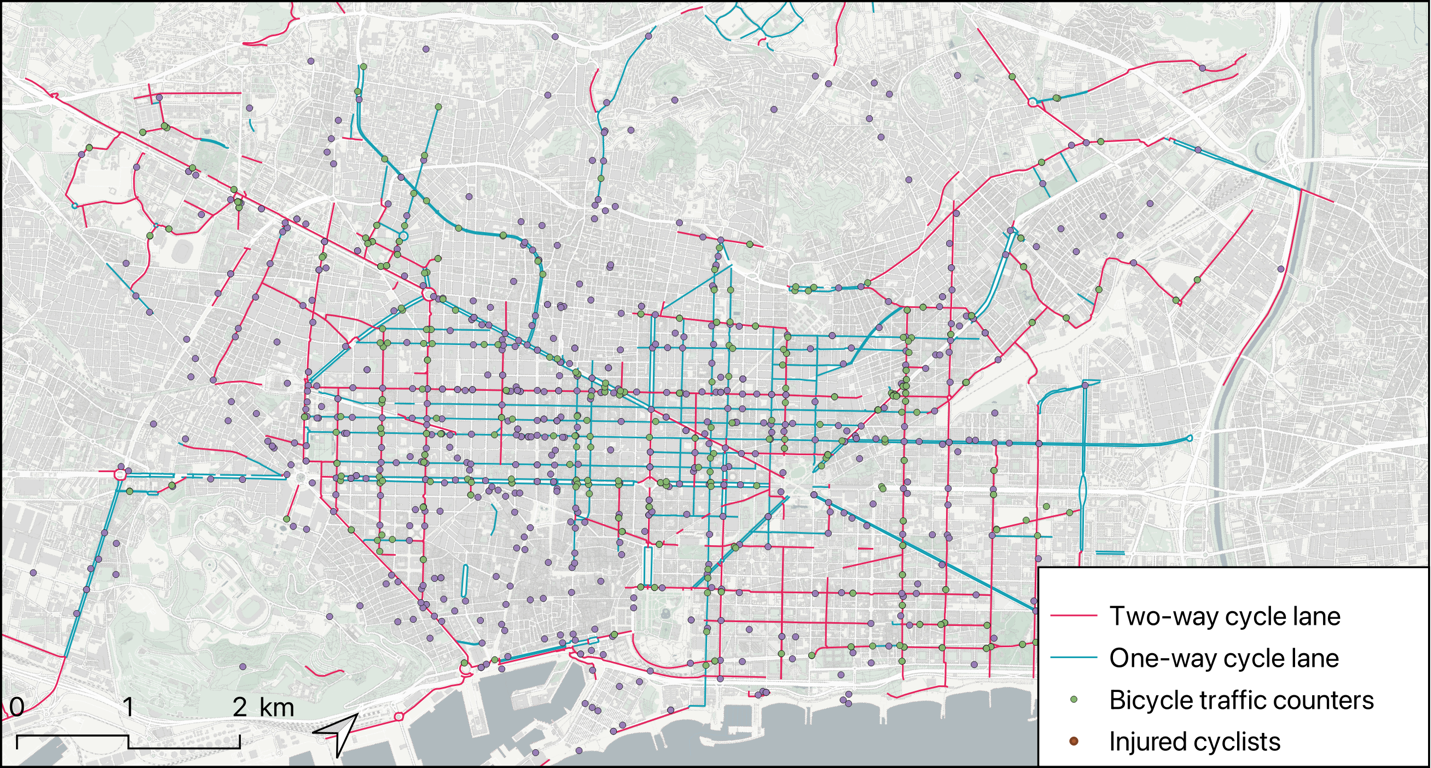
I use data from Barcelona, which has an extensive cycling network split almost evenly between two-way and one-way bike lanes (mostly with physical separation on pavement, but also including some painted lanes on pavement or sidewalk). There exists a local perception that two-way bike lanes are more dangerous than one-way ones (Betevé 2019): as a result, city policy has abandoned the construction of two-way bike lanes and aims to transform existing two-way bike lanes into one-way lanes along parallel streets. Given the predominance of one-way streets in Barcelona, this risks reducing the connectivity of the existing cycling network.
2. Methods
My analysis relies on 3 spatial datasets from Barcelona’s Open Data portal, available for the years 2020-23 (see Appendix):
-
Municipal bike lane network: This dataset distinguishes between one-way and two-way lanes, but contains no further attributes (e.g. separation, width). The data is split into segments of variable length, which correspond to a bike lane section implemented at the same time along a specific street.
-
Injured cyclists: This includes all cyclists involved in a reported traffic accident, regardless of severity. Key characteristics of this dataset are summarized in Table 1.
-
Cycling counter data: This includes average daily cycling counts for all permanent traffic counters (371 in 2023) along the city’s bike lane network.
These three datasets are displayed in a map in Figure 1. To calculate injury rates for each bike lane segment, I undertook the following steps:
-
Spatially join injured cyclists to the nearest bike lane segment (max 20 m. distance, discarding remaining records), resulting in a total of 1,035 records for the years 2020-23.
-
Based on average daily counts, calculate annual cyclist flows for each bike lane segment with available counter data (this assumes that all cyclists travel through the whole length of each individual bike segment). For bike lane segments with more than one counter, the average of all counters was used.
-
Building on the previous steps, calculate the rate of injured cyclists per 100,000 veh-km for each bike lane segment based on a well-established formula (U.S. Department of Transportation 2011) (bike lane segments shorter than 100 m or with no cycling flow data were excluded):
Rinjured_cyclists=Annual number of injured cyclists × 100,000Length of bike lane segment (km) × Annual cyclist flow

To account for temporal changes in the bike lane (and counter) network, injury rates for each bike lane segment were calculated separately for each year, resulting in a total of 425 records (Table 2).
Subsequently, I used the Man-Whitney U test to examine whether the rate of injured cyclists is statistically different between one-way and two-way bike lane segments (aggregating data for the whole 2020-23 period). All calculations were performed in R, relying primarily on packages “tidyverse” and “sf”.
While the large number of observations and availability of exposure data constitute a key strength of my analysis, the lack of detailed information on bike lane characteristics is an important limitation. Likewise, cyclist injury data is not geographically accurate enough to confidently determine whether an accident occurred at an intersection, which previous research has shown to be an important consideration (Adams and Aldred 2020; Garber et al. 2023).
3. Findings
Figure 2 displays aggregate temporal trends for the entire cycling network (including bike lanes without count data). While the network is split relatively evenly between one-way and two-way bike lanes, one-way lanes account for most of the network expansion in recent years. Without taking cyclist volumes into account, one-way bike lanes present a slightly higher accident rate for all years.
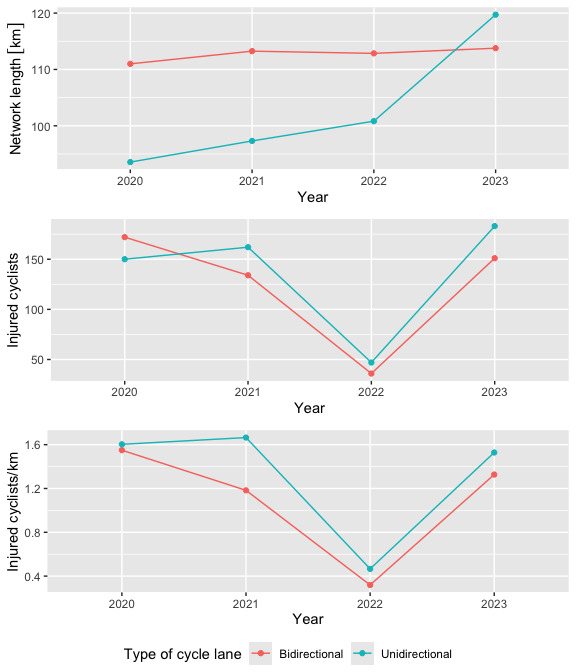
Figure 3 visually compares annual injury rates per 100,000 veh-km, for all one- and two-way bike lane segments with available cycling count data (Table 2). Given the large number of segments with no recorded accidents, this results in a non-normal distribution with a strong positive skew which is very similar for both categories. Nevertheless, mean injury rates per 100,000 veh-km are slightly higher for one-way than two-way lanes for all study years (Table 3).
.jpg)
I subsequently performed a Mann-Whitney U test comparing both samples, which found that injury rates tend to be statistically slightly higher for one-way than two-way bike lanes (n (one-way) = 259, n (two-way)= 166, U= 19096; p= 0.03). Nevertheless, this effect is small (r= 0.10).
These findings apparently run against the common assumption that Barcelona’s two-way bike lanes are generally more dangerous than one-way ones, suggesting that public policy should not oppose two-way lanes as a matter of principle. In fact, my findings suggest the existence of a small effect in the opposite direction. Given the smallness of this effect and that my analysis does not include other potential explanatory variables (e.g. motorized traffic flows, intersection density, bike lane width), however, this finding is hardly conclusive. A potential explanation for the slightly higher observed injury rates of one-way lanes is that these predominate in the central Eixample district, which has high levels of motorized traffic and busy intersections, while two-way lanes are more common in more peripheral areas. More in-depth future research might unpack this issue in further detail through more sophisticated models which incorporate a greater number of variables.