1. QUESTIONS
Under President Biden’s administration, the US Department of Transportation (DOT) supported discretionary funding that sought to funnel investments into underserved areas and areas burdened by legacy transportation decisions, including interstate highway construction that disconnected communities. Communities seeking discretionary transportation funds could demonstrate need based on data created to support the Justice40 initiative (Biden White House Archives 2025), which sought to direct 40% of federal resources to “disadvantaged communities” identified by low-income status, high household costs, and exposure to environmental, health, and climate burdens. Preliminary analysis suggests that Justice40 implementation met several goals, resulting in two USDOT programs placing 70% and 100% of grants in disadvantaged communities (Walls, Hines, and Ruggles 2024).
In January 2025, the Trump administration terminated the Justice40 initiative. The DOT then dramatically restructured transportation investment priorities, as laid out in an undated memo released in late January 2025 (referred to in this paper as the 2025 DOT policy). The memo states that the department will prioritize “grants, loans, [and] contracts” that, among other criteria, “…give preference to communities with marriage and birth rates higher than the national average … and require local compliance or cooperation with Federal immigration enforcement…” (US Department of Transportation 2025).
We analyze how these new criteria will reshape the geography and beneficiaries of federal transportation funding. Specifically, we assess whether funding priorities described in the 2025 DOT order diverge from past equity-driven frameworks, how they can be expected to shift funding in areas with greater transportation needs, and the extent to which they align with political patterns from the 2024 presidential election.
2. METHODS
We assembled several datasets to understand the anticipated effects of the change in funding priorities. The Climate and Economic Justice Screening Tool (CEJST) was a federal spatial mapping application intended to assist federal agencies in identifying census tracts that reflect funding priorities under the Justice40 initiative. We used the tract-level “disadvantaged” designation from CEJST, along with its measures of transportation funding need (travel barriers, along with vehicle traffic proximity and volume) and sociodemographics (race, ethnicity, and poverty).
To identify census tracts likely to be newly prioritized, we made several assumptions based on the marriage, birth, and immigration-related criteria mentioned in the 2025 DOT policy. Since marriage and birth rates are not available at the census tract level, we use two similar variables from the 2021 five-year American Community Survey data (US Census Bureau 2024). We approximate the marriage rate as the share of people aged 15 years or older reporting being “now married.” We approximate the birth rate as the share of women 15 to 50 years who had a birth in the last twelve months, a metric that is more age and gender-specific than a crude birth rate but less cohort-specific than a fertility rate. We used data from the Immigrant Legal Resource Center (ILRC) to determine which counties were more cooperative with Immigration and Customs Enforcement (ICE) activities (Immigrant Legal Resource Center 2019). Tracts with both marriage and birth rates above the aggregate national levels and that fell in counties that are more cooperative with ICE were identified as prioritized under the new 2025 DOT policy. County-level voting data for the 2024 Presidential election were obtained from a public repository created by Tony McGovern (McGovern [2016] 2025).
Using these data, we descriptively compare the spatial and population distributions of the two policies along the sociodemographic characteristics, transportation need, and voting patterns.
3. FINDINGS
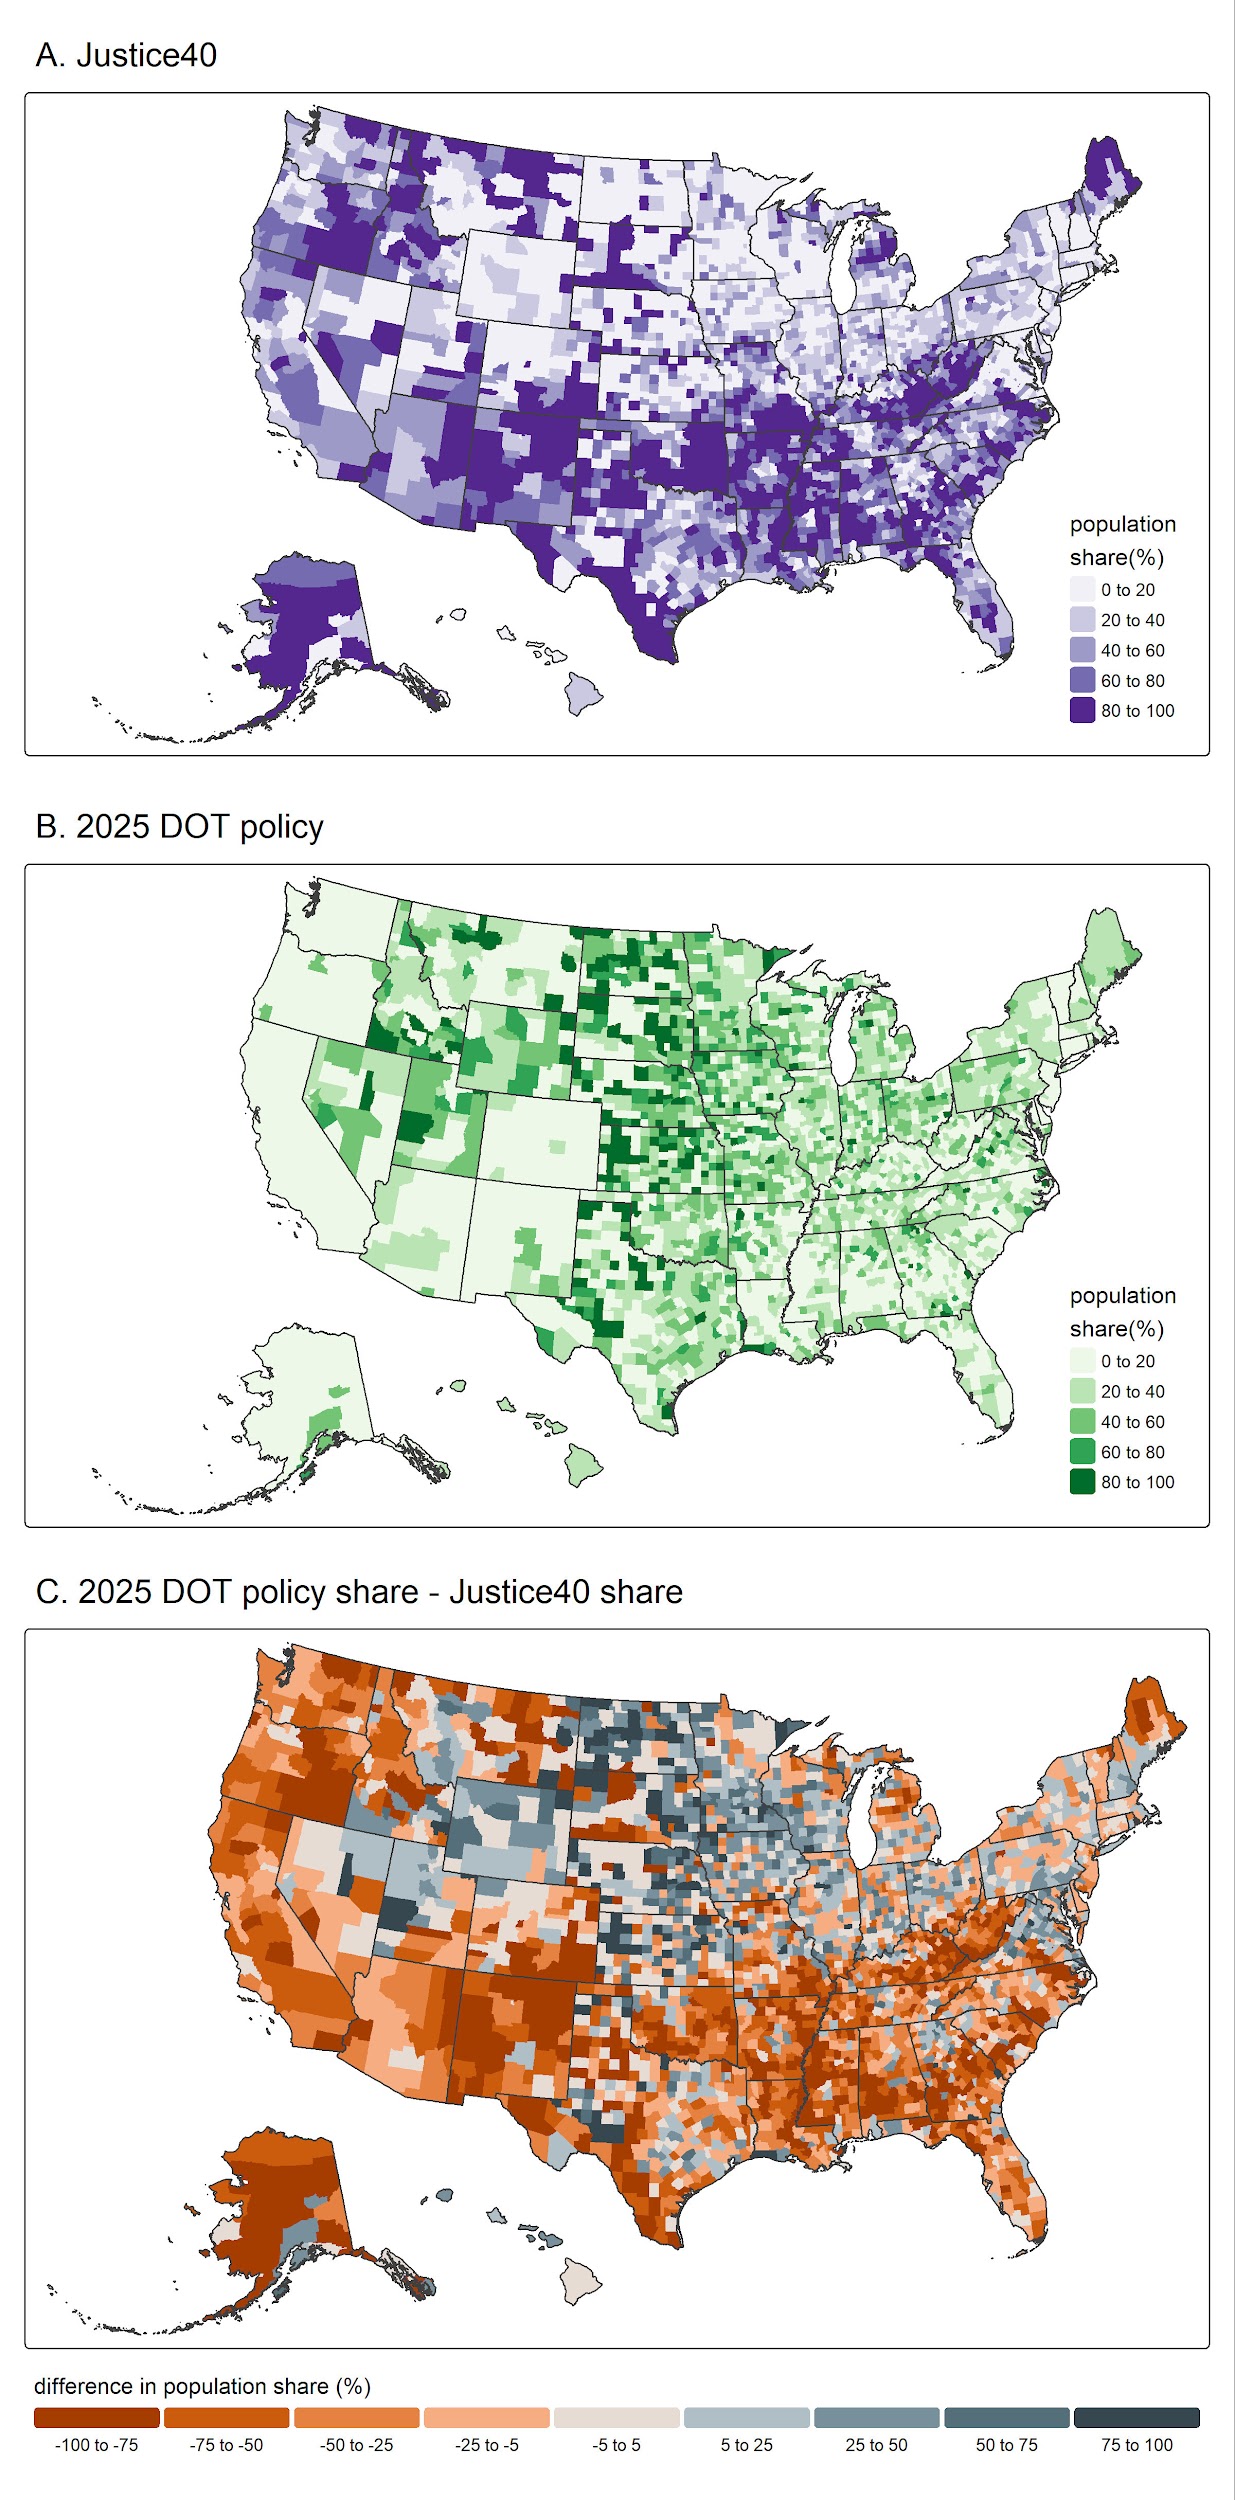
Fewer census tracts fall under the estimated implementation of the 2025 DOT policy (12,142) when compared with the Justice40 prioritization (27,738), reflecting a spatial concentration in funding eligibility. Figure 1 visualizes US counties weighted by the share of their tract-level populations that would be included in a Justice40-based prioritization (A) or the 2025 DOT policy prioritization (B), with differences shown in Panel C. Comparing the maps demonstrates a shift away from prioritizing central Appalachia, the west coast, the southwest, much of the south, and several Indigenous and Tribal communities, while placing greater priority on the Midwest and the Great Plains.
_justice40_and_(b.)_2025_dot_policy__with_(c.)_differences_in.jpg)
Figure 2 displays nationwide county-level sociodemographics, transportation need, and 2024 voting results. Locations with large Black and Hispanic or Latino populations are deprioritized under the 2025 policy. Most of the middle of the country from Texas to North Dakota heavily favored President Trump; these areas benefit from the 2025 DOT policy. Not all areas that supported President Trump are rewarded with prioritization, however. Much of Appalachia, the southeast, Alaska, and northern Maine voted for Trump but fared better under the Justice40 scheme.
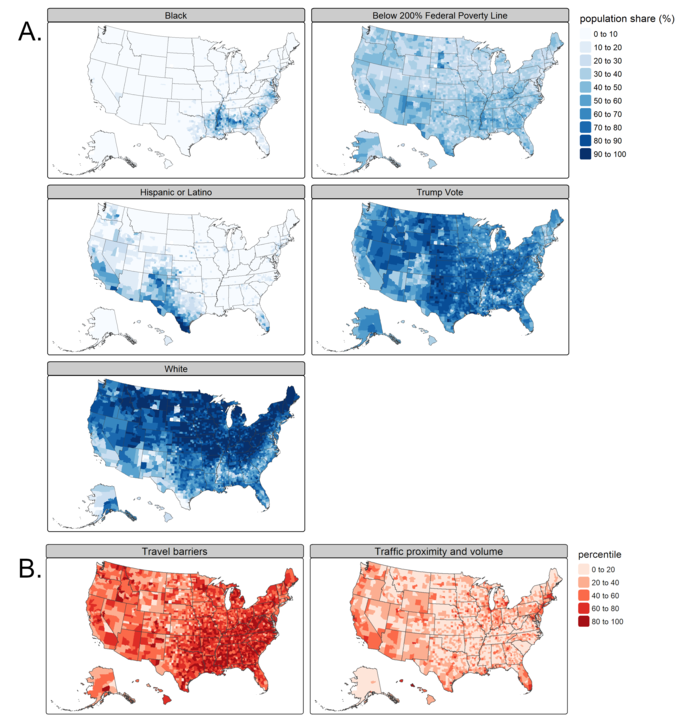
Finally, we present two indicators of transportation funding need: travel barriers and traffic proximity. These areas would benefit most from DOT’s attention and discretionary funding as they pursue efforts to increase transportation benefits and mitigate adverse transportation impacts. Geographic trends for transportation need are less pronounced in the national maps.
_sociodemographics_and_2024_presidential_votes_and_(b)_transportation_funding_ne.png)
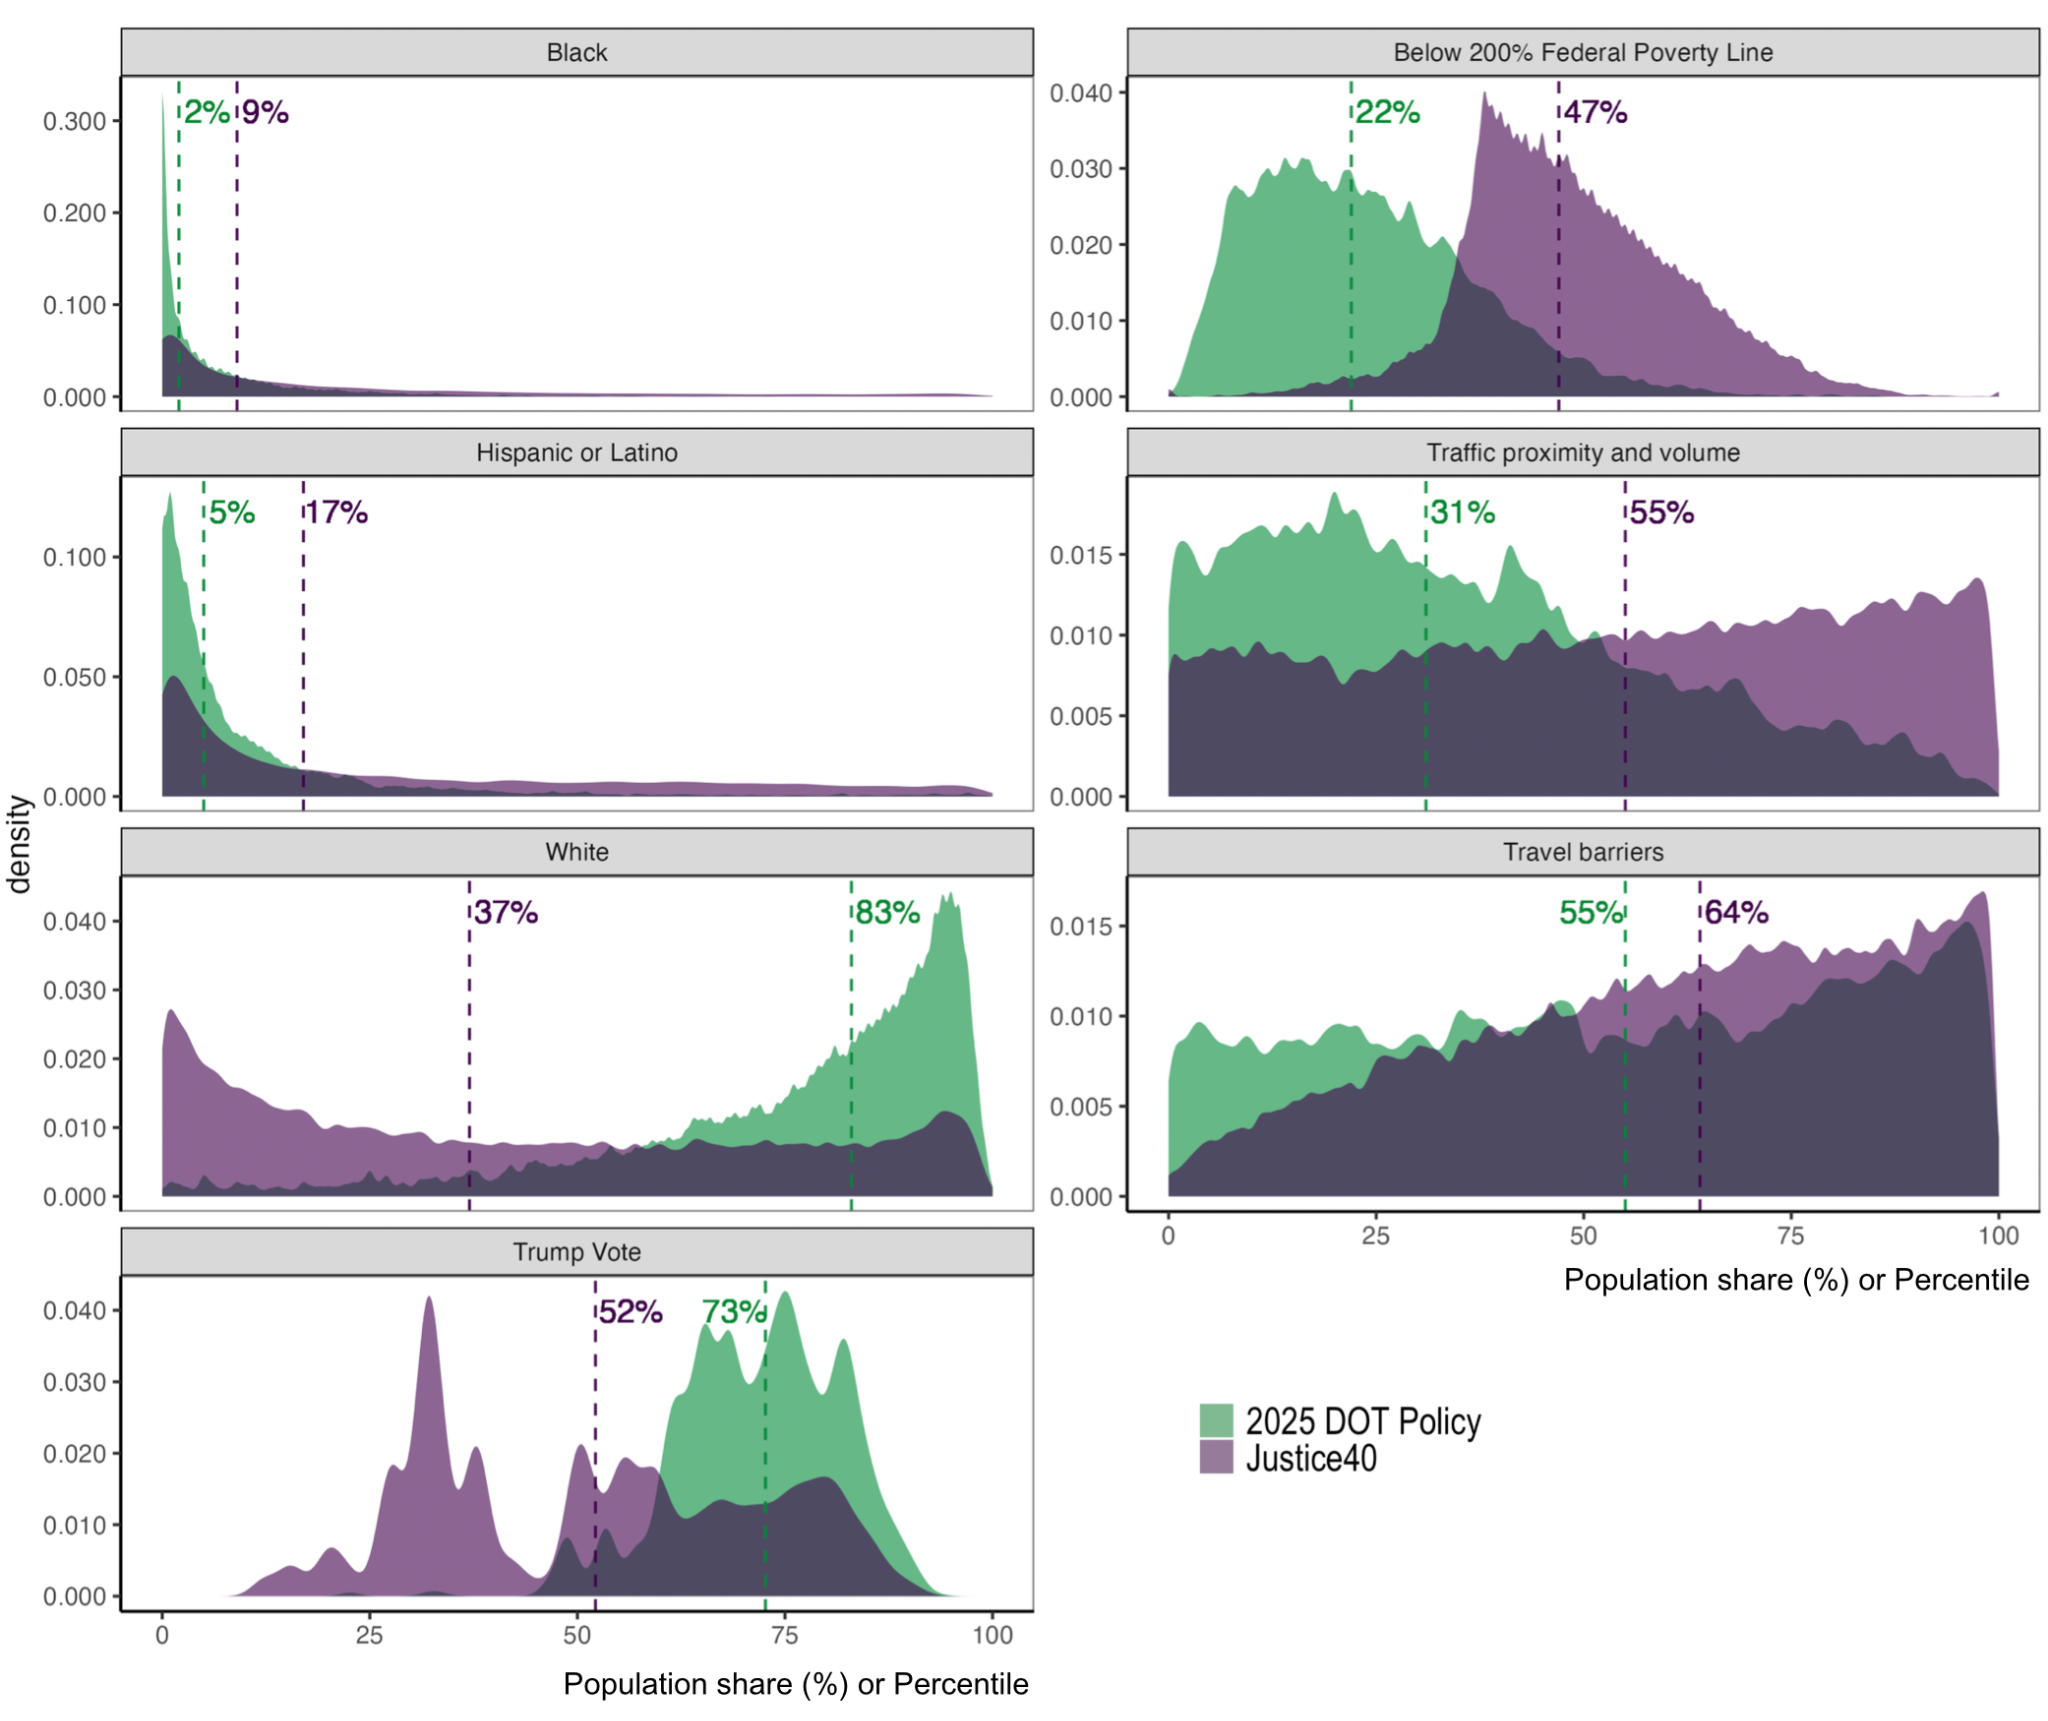
We also examine the distribution of likely beneficiaries using the same race, poverty, and transportation need indicators at the census tract level and percent Trump votes at the county level (Figure 3). Each plot shows the population-weighted distribution of communities that would be prioritized for transportation funding. Vertical dotted lines represent median values for each policy.
The 2025 DOT policy prioritizes whiter and higher income communities when compared with the Justice40 prioritization (Figure 3). Under Justice40, the median benefiting tract was 37% white, as compared to the 2025 DOT Policy, in which the median benefiting census tract is 83% white. This is the largest difference across all indicators we evaluated. The 2025 DOT policy also favors Trump-voting counties by 21 percentage points as compared to Justice40 designations.

On average, the 2025 DOT Policy favors tracts exhibiting lower levels of both traffic proximity and travel burdens. This finding is concerning, as one of the objectives of the DOT has been to reduce externalities of the transportation system and to meet the population’s transportation needs. The new DOT policy is likely to reverse progress towards achieving these objectives, though the policy may yet change given the administration’s unpredictability. Future research will need to track effects on communities, as well as the long-term effects of successfully implemented Justice40 projects.
ACKNOWLEDGEMENTS
The authors acknowledge the Immigrant Legal Resource Center (ILRC), which provided county-level ICE entanglement data, and Public Environmental Data Partners (https://screening-tools.com/), which hosts an archived version of the CEJST v2.0 data tool.