RESEARCH QUESTION
Taking transit to and from a destination typically involves crossing the street. However, not all bus stops have traffic lights or marked crosswalks to facilitate crossings at intersections. A lack of marked crossings at bus stops may deter certain populations from using transit, such as people with mobility challenges and seniors. In this study, we 1) identify bus stops in Vancouver, Canada with unmarked crosswalks and 2) assess whether unmarked crosswalks are inequitably distributed across the city.
METHODS AND DATA
Study area
The study area was the city of Vancouver, which has a population of approximately 630,000 people and land area of 115km2 (Statistics Canada 2017). Vancouver has a high transit mode share relative to other Canadian cities with 17% of all trips being made by public transit (McElhanney 2019).
Data and Analysis
We used publicly available data from Metro Vancouver’s transit authority, the City of Vancouver, and the Canadian census (TransLink 2020; City of Vancouver 2020; Statistics Canada 2016a). The latitude and longitude of bus stops within Vancouver were obtained from TransLink’s Open API and mapped in QGIS 3.10.3.
We created 200-meter buffers around each bus stop and intersected the buffers with traffic signal data to identify bus stops that did not have a traffic signal. We selected a distance of 200 meters because this represents approximately two city blocks and could be considered an unreasonable distance for a transit user to walk out of their way if they were trying to cross the street. The available traffic signal dataset did not include marked crosswalks. Thus, for the subset of bus stops with no traffic signal we used Google Street View to record whether there was a marked crosswalk at the nearest intersection, the number of traffic lanes in each direction, and whether there was a median and/or street parking. Captures for Google Street View were taken from June to September 2019; therefore, it is possible that a marked crosswalk may have been installed between when the captures were taken and when we examined them in March 2020. We also obtained the average number of daily boardings on weekdays at bus stops from TransLink (TransLink 2018).
To explore how unmarked crosswalks at bus stops were distributed across the city, we overlaid bus stops on area-level income data. We used dissemination areas (DAs) as the geographical unit of analysis, which cover a population of approximately 400-700 people (Statistics Canada 2016b). We assigned DAs to an income quintile using median household income from the 2016 Canadian census (quintile 1=lowest income; quintile 5=highest income). We summed the number of bus stops across income quintiles and calculated the proportion of the stops with unmarked crosswalks. We also calculated population density across income quintiles and the average number of daily boardings at bus stops.
FINDINGS
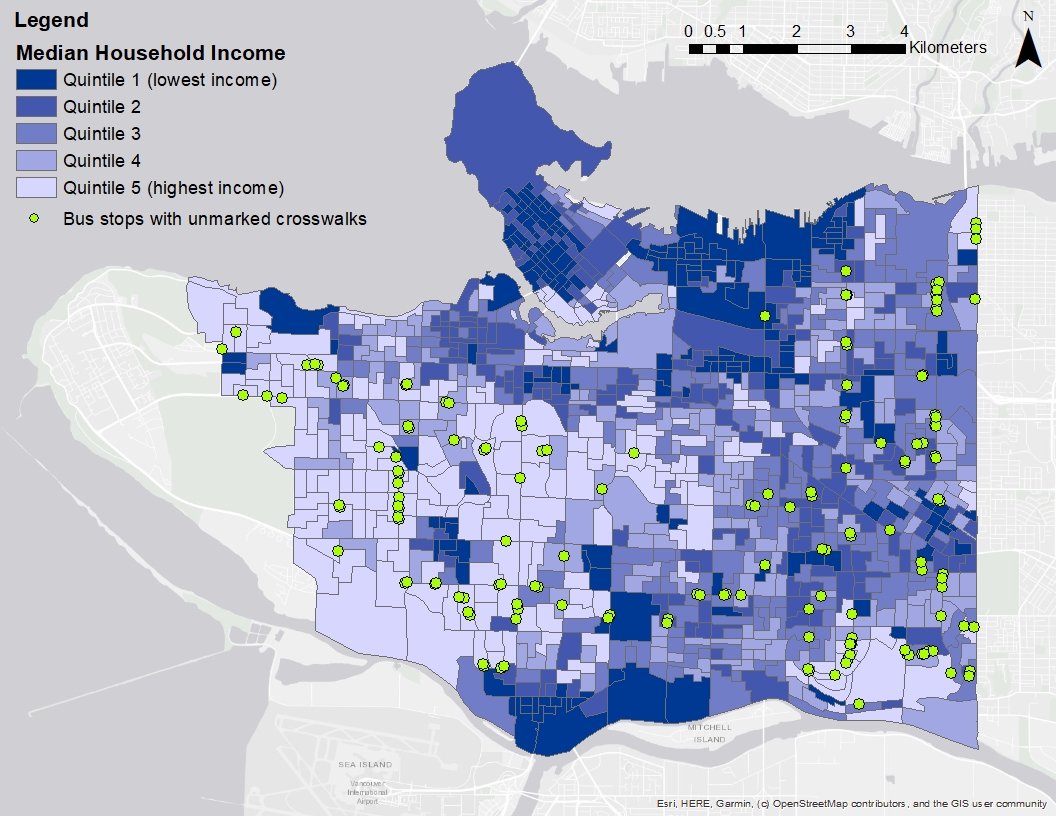
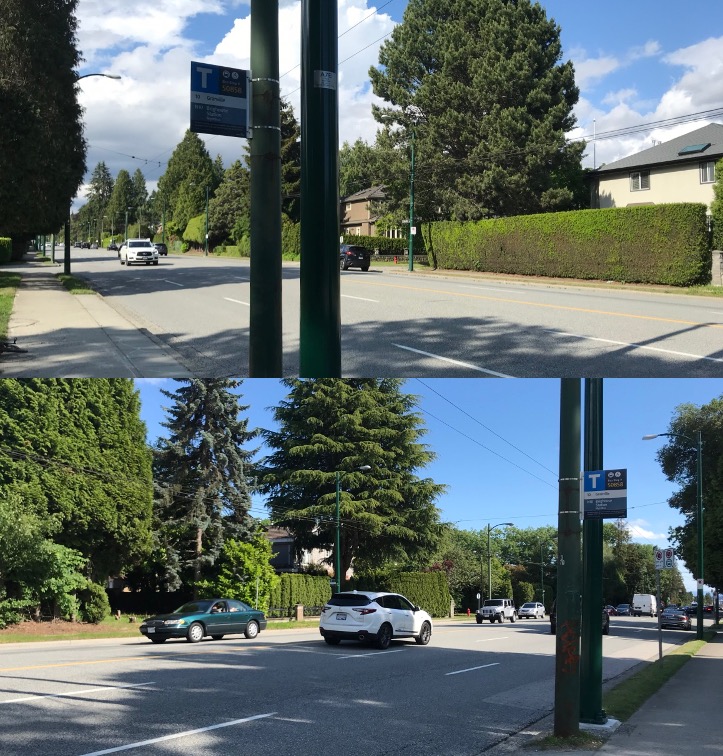
As of March 2020, there were a total of 1,892 bus stops across Vancouver. Of these, 198 (10%) did not have a traffic signal within 200 meters and a further 151 (8%) did not have a marked crosswalk at the nearest intersection. Figure 1 maps the locations of the 151 bus stops that did not have traffic signal or marked crosswalk at the nearest intersection. The 151 bus stops were at 135 unique crossing sites. Street crossing characteristics for the 135 crossing sites with unmarked crosswalks are in Table 1. The majority were on streets with two (64%) or four traffic lanes (23%), but notably there were 17 crossings on streets with five or six traffic lanes. Figure 2 shows a picture of a bus stop in the city with no marked crosswalk along a road with six traffic lanes. Almost all bus stops with unmarked crossings were on streets with street parking (98%), which may reduce the driver’s visibility of pedestrians at intersections. A traffic median, infrastructure that allows pedestrians to cross one direction of traffic at a time, was only available at one in five (19%) crossings.


There are clear trends across area-level income quintiles in terms of population density, ridership, and unmarked crosswalks at bus stops (Table 2). The population density of DAs in the lowest income quintile is more than double (7,113 persons/km2) that of DAs in the highest income quintile (3,168 persons/km2). Ridership also trends with income, with bus stops in the lowest income quintile having the highest ridership and stops in the highest income quintile having the lowest ridership. The number of bus stops across income quintiles was fairly even, but the proportion of stops with unmarked crosswalks was much higher in higher income quintiles. Almost 1 in 6 bus stops (17.1%) in the highest income quintile had an unmarked crosswalk compared to just 1.8% of bus stops in the lowest income quintile. Bus stops with unmarked crossings see less frequent use: the average number of daily boardings at bus stops with unmarked crosswalks is 40 37 SD compared to 245 538 SD at bus stops with marked crosswalks.
In line with Vision Zero principles, which aim to eliminate traffic fatalities and injuries, roads should be designed to ensure pedestrians - including those walking to use transit- can safely cross the street. In British Columbia, drivers are required by the Motor Vehicles Act to yield to pedestrians even in unmarked crosswalks (Motor Vehicle Act 1996). Nevertheless, crosswalk markings influence driver behaviour. There is evidence of higher rates of yielding at marked versus unmarked crosswalks (Mitman, Ragland, and Zegeer 2008). The evidence on collision risk is more mixed; some studies have reported a higher collision risk at marked (versus unmarked) crosswalks when they are installed on high speed multi-lane roads (Zegeer et al. 2001; Monsere et al. 2016). At locations with challenging pedestrian crossings, additional enhancements should be provided to ensure crossings are safe, such as pedestrian-activated flashing beacons, curb extensions, traffic medians, and raised pedestrian crossings.