


Abstract
Accessibility is seldom used as a performance measure when planning transit services. This study is conducted following introduction of new timetables intended to improve passenger throughput for Sydney’s transit services, but resulted in major delays throughout the system. Cumulative accessibility to jobs at 30-minute travel threshold before and after the timetable change are calculated between 8 and 9 am, to measure change in accessibility. The results show the person-weighted accessibility dropped by 3%, from 45,070 to 43,730, and 63.3% of the population’s access to jobs were adversely affected by timetable change. This study advocates for the inclusion of accessibility metrics into transit performance measures.
Research Questions
Major changes to Sydney’s transit timetable implemented in November 2017 add more services, mainly to increase passenger throughput to accommodate a growing patronage forecast to increase by 21% before 2021 (NSW Government 2018). The new timetable incorporates more train and bus services, and higher service frequency across the system, including service improvements for southwest Sydney and Parramatta. Changes to transit schedule may produce unintended consequences, for example, more services increase the passenger throughput, but inevitably reduces the buffer time between consecutive services and lowers the robustness of the system in absorbing any shock from unexpected disruptions. Although the lack of timetable robustness has been criticized (Blumer and Cockburn 2018; O’Sullivan 2018), little attention has been given to the effect on accessibility to jobs.
There has been applications in measuring accessibility change after the implementation of a light rail line (Owen and Kadziolka 2015), and bus service upgrades (Palmateer, Owen, and Levinson 2016). However, to the best of our knowledge, there has yet to be an application of GTFS in evaluating accessibility differences in microscopic service changes of existing transit services.
The objective of this paper is to measure Sydney’s region-wide transit accessibility to jobs before and after the timetable change. This work measures accessibility change for different statistical zones to shed light on the extent transit service alteration affects the spatial distribution of transit resources; population weighted accessibility is calculated to reflect the overall effect on access to jobs for the region.
Methods and Data
Data
To compare transit accessibility before and after the timetable change, this work compares transit schedule from a date before the timetable change (Wed. Sept. 6, 2017) to a date after the change (Wed Dec. 13, 2017). The transit schedule information came from GTFS data published by the NSW government (Transport for NSW 2017). General Transit Feed Specification (GTFS) is a standard format developed by Google and the Tri-Met in Portland and widely adopted by transit operators in sharing service information.
Road network data comes from the OpenStreetMap (OSM). Population statistics are obtained from census data from the Australian Bureau of Statistics (Australian Bureau of Statistics 2016), in which the Working Population Profile (WPP) describes the number of employment in each of Sydney’s level-2 Statistical Area (SA2), and General Community Profile (GCP) provides the number of residents in each area. The number of job opportunities reachable is calculated based on the WPP, and GCP is used to calculate a resident-population weighted measure of job accessibility to provide a more realistic representation accessibility.
Accessibility measure
Accessibility measures the potential for interaction (Hansen 1959). This work uses cumulative accessibility to jobs under a 30-minute travel time threshold to reflect the performance of transit service before and after the timetable change. Operationally, this accessibility measure sums the number of jobs reachable under the time threshold, shown by .
\[A_{i} = \sum\limits_{j=1}^n O_j f(C_{ij} )\]
\[f(C_{ij}) =
\begin{cases}
1 & \text{if $C_{ij} < T$}\\
0 & \text{if $C_{ij} \ge T$}\\
\end{cases}
\]
: Accessibility for statistical area i
: Number of job opportunities within statistical area j
: (Rectangular) decay function with a travel time between i and j
: Travel time threshold for \
Accessibility calculation
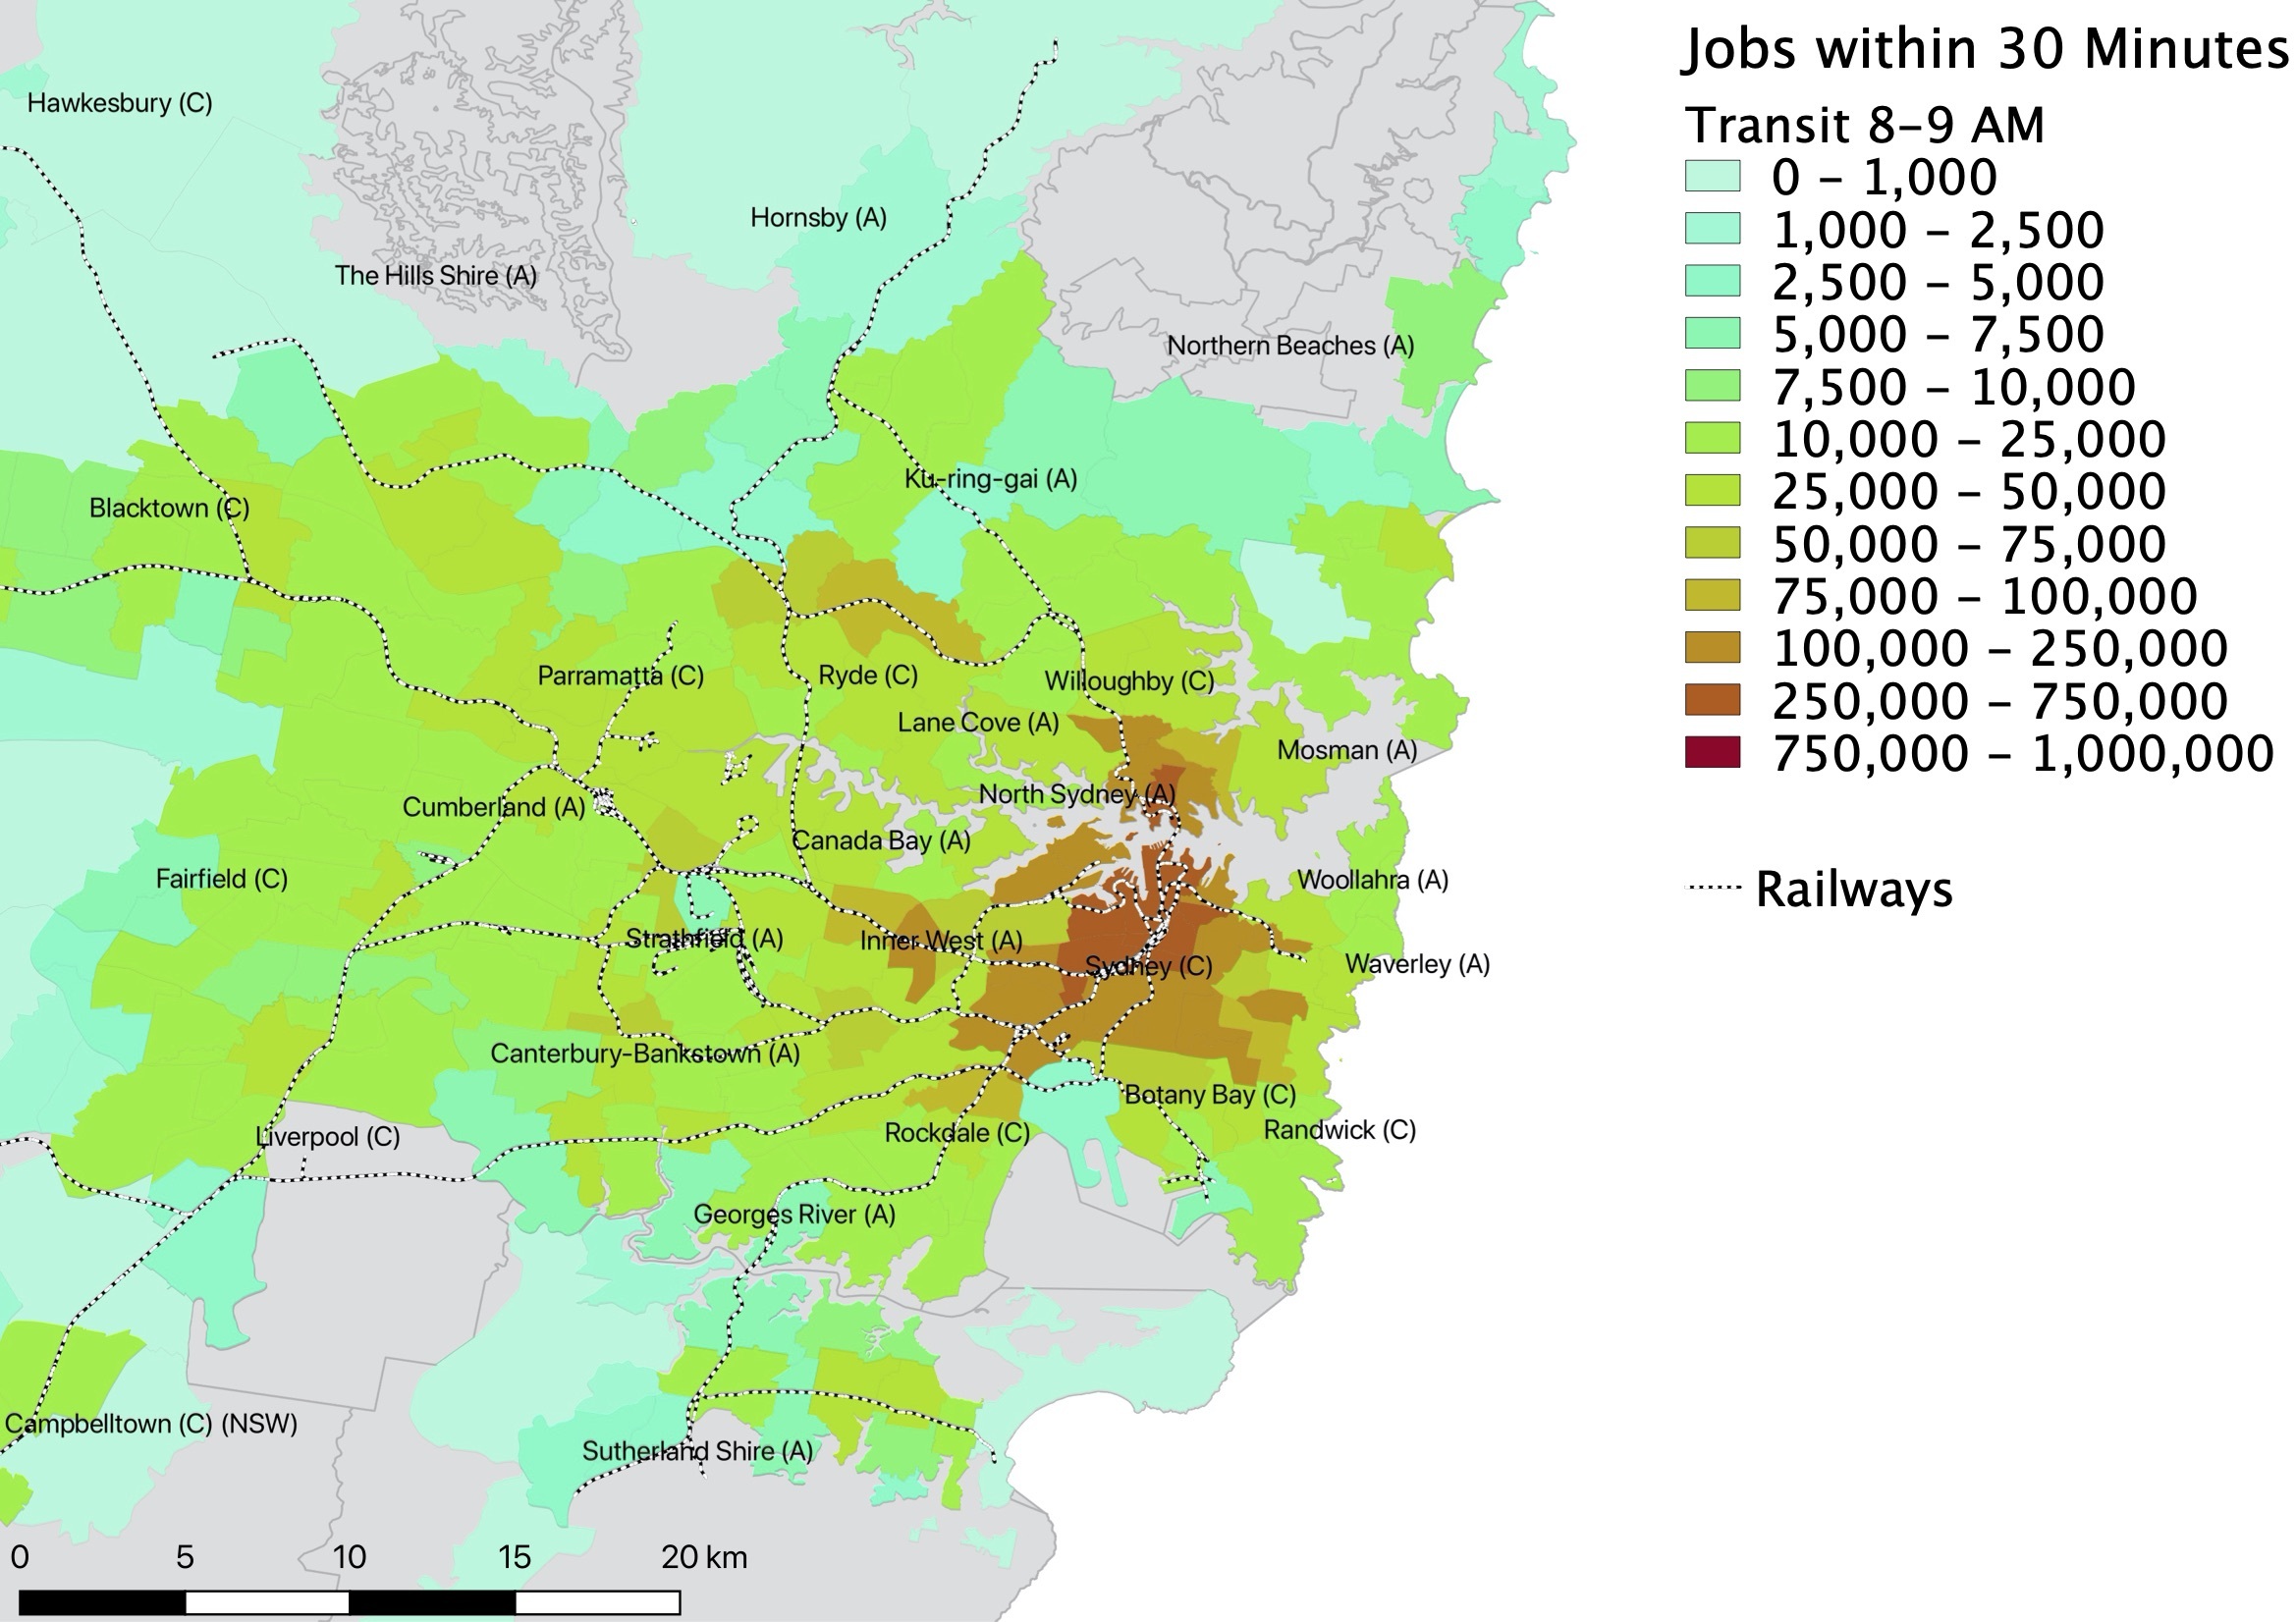
This work uses the Open Trip Planner (OTP) to calculate 30-minute transit coverage area from the origin of SA2 centroids. Perfect schedule adherence is assumed. We use an origin based accessibility measure (Yigitcanlar et al. 2007). The isochrones form the area reachable within the travel time threshold (30-minute) that covers all stages of a transit trip. Jobs covered within the isochrones are summed as the cumulative accessibility. shows an example of coverage area. This work calculates accessibility from centroids of all statistical area 2 within the Greater Sydney region.
Destination SA2s are further fine-grained with 500 by 500 meter mesh grids to increase spatial resolution of the accessibility measure . Jobs within SA2s are assumed to be spatially evenly distributed, so each grid centroid is allocated an even share of the total job opportunities from the larger SA2. The cumulative accessibility sums the total number of jobs from all grid centroids within the isochrone.
Transit accessibility to jobs are calculated based on a Wednesday transit schedule, under a 30-minute threshold of combined walking, traveling on board, and transfers. Since the temporal variation in transit accessibility can be significant especially for remote locations with low transit frequencies (Owen, Levinson, and Murphy 2016), we use a time-averaged accessibility for every two minutes during 8 - 9 am to reflect a more realistic travel experience.

Findings
Change in zonal accessibility
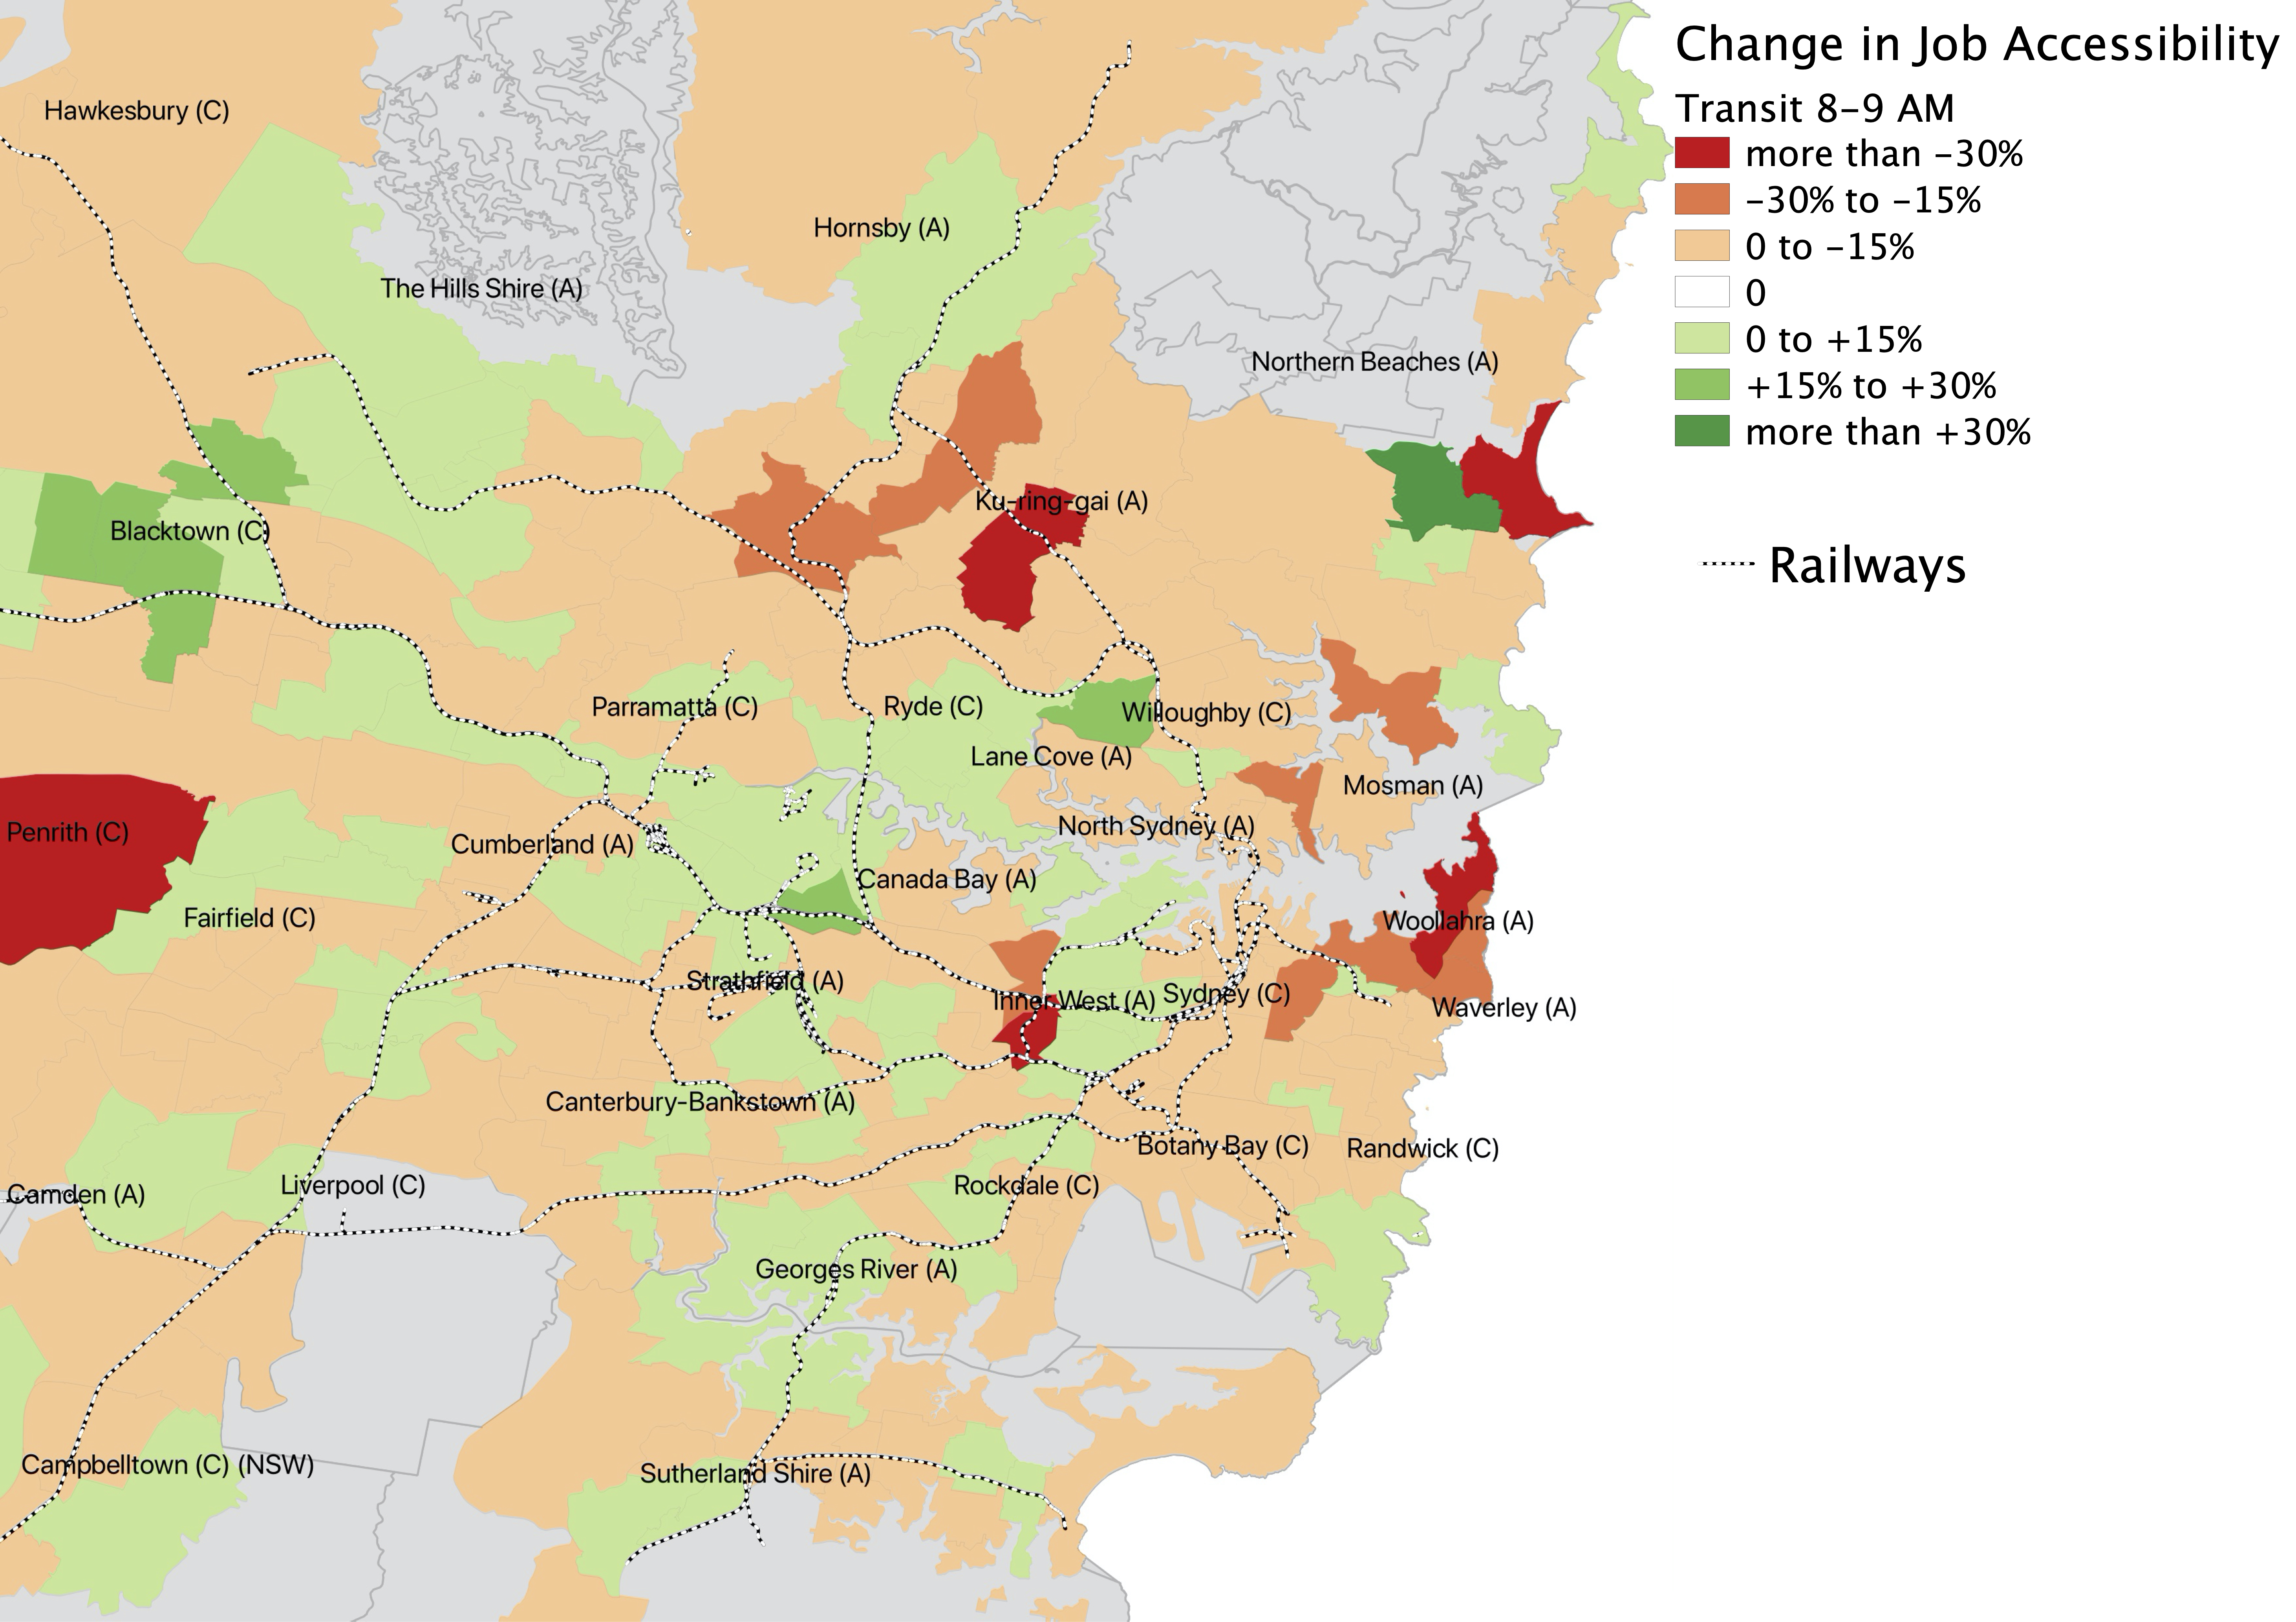
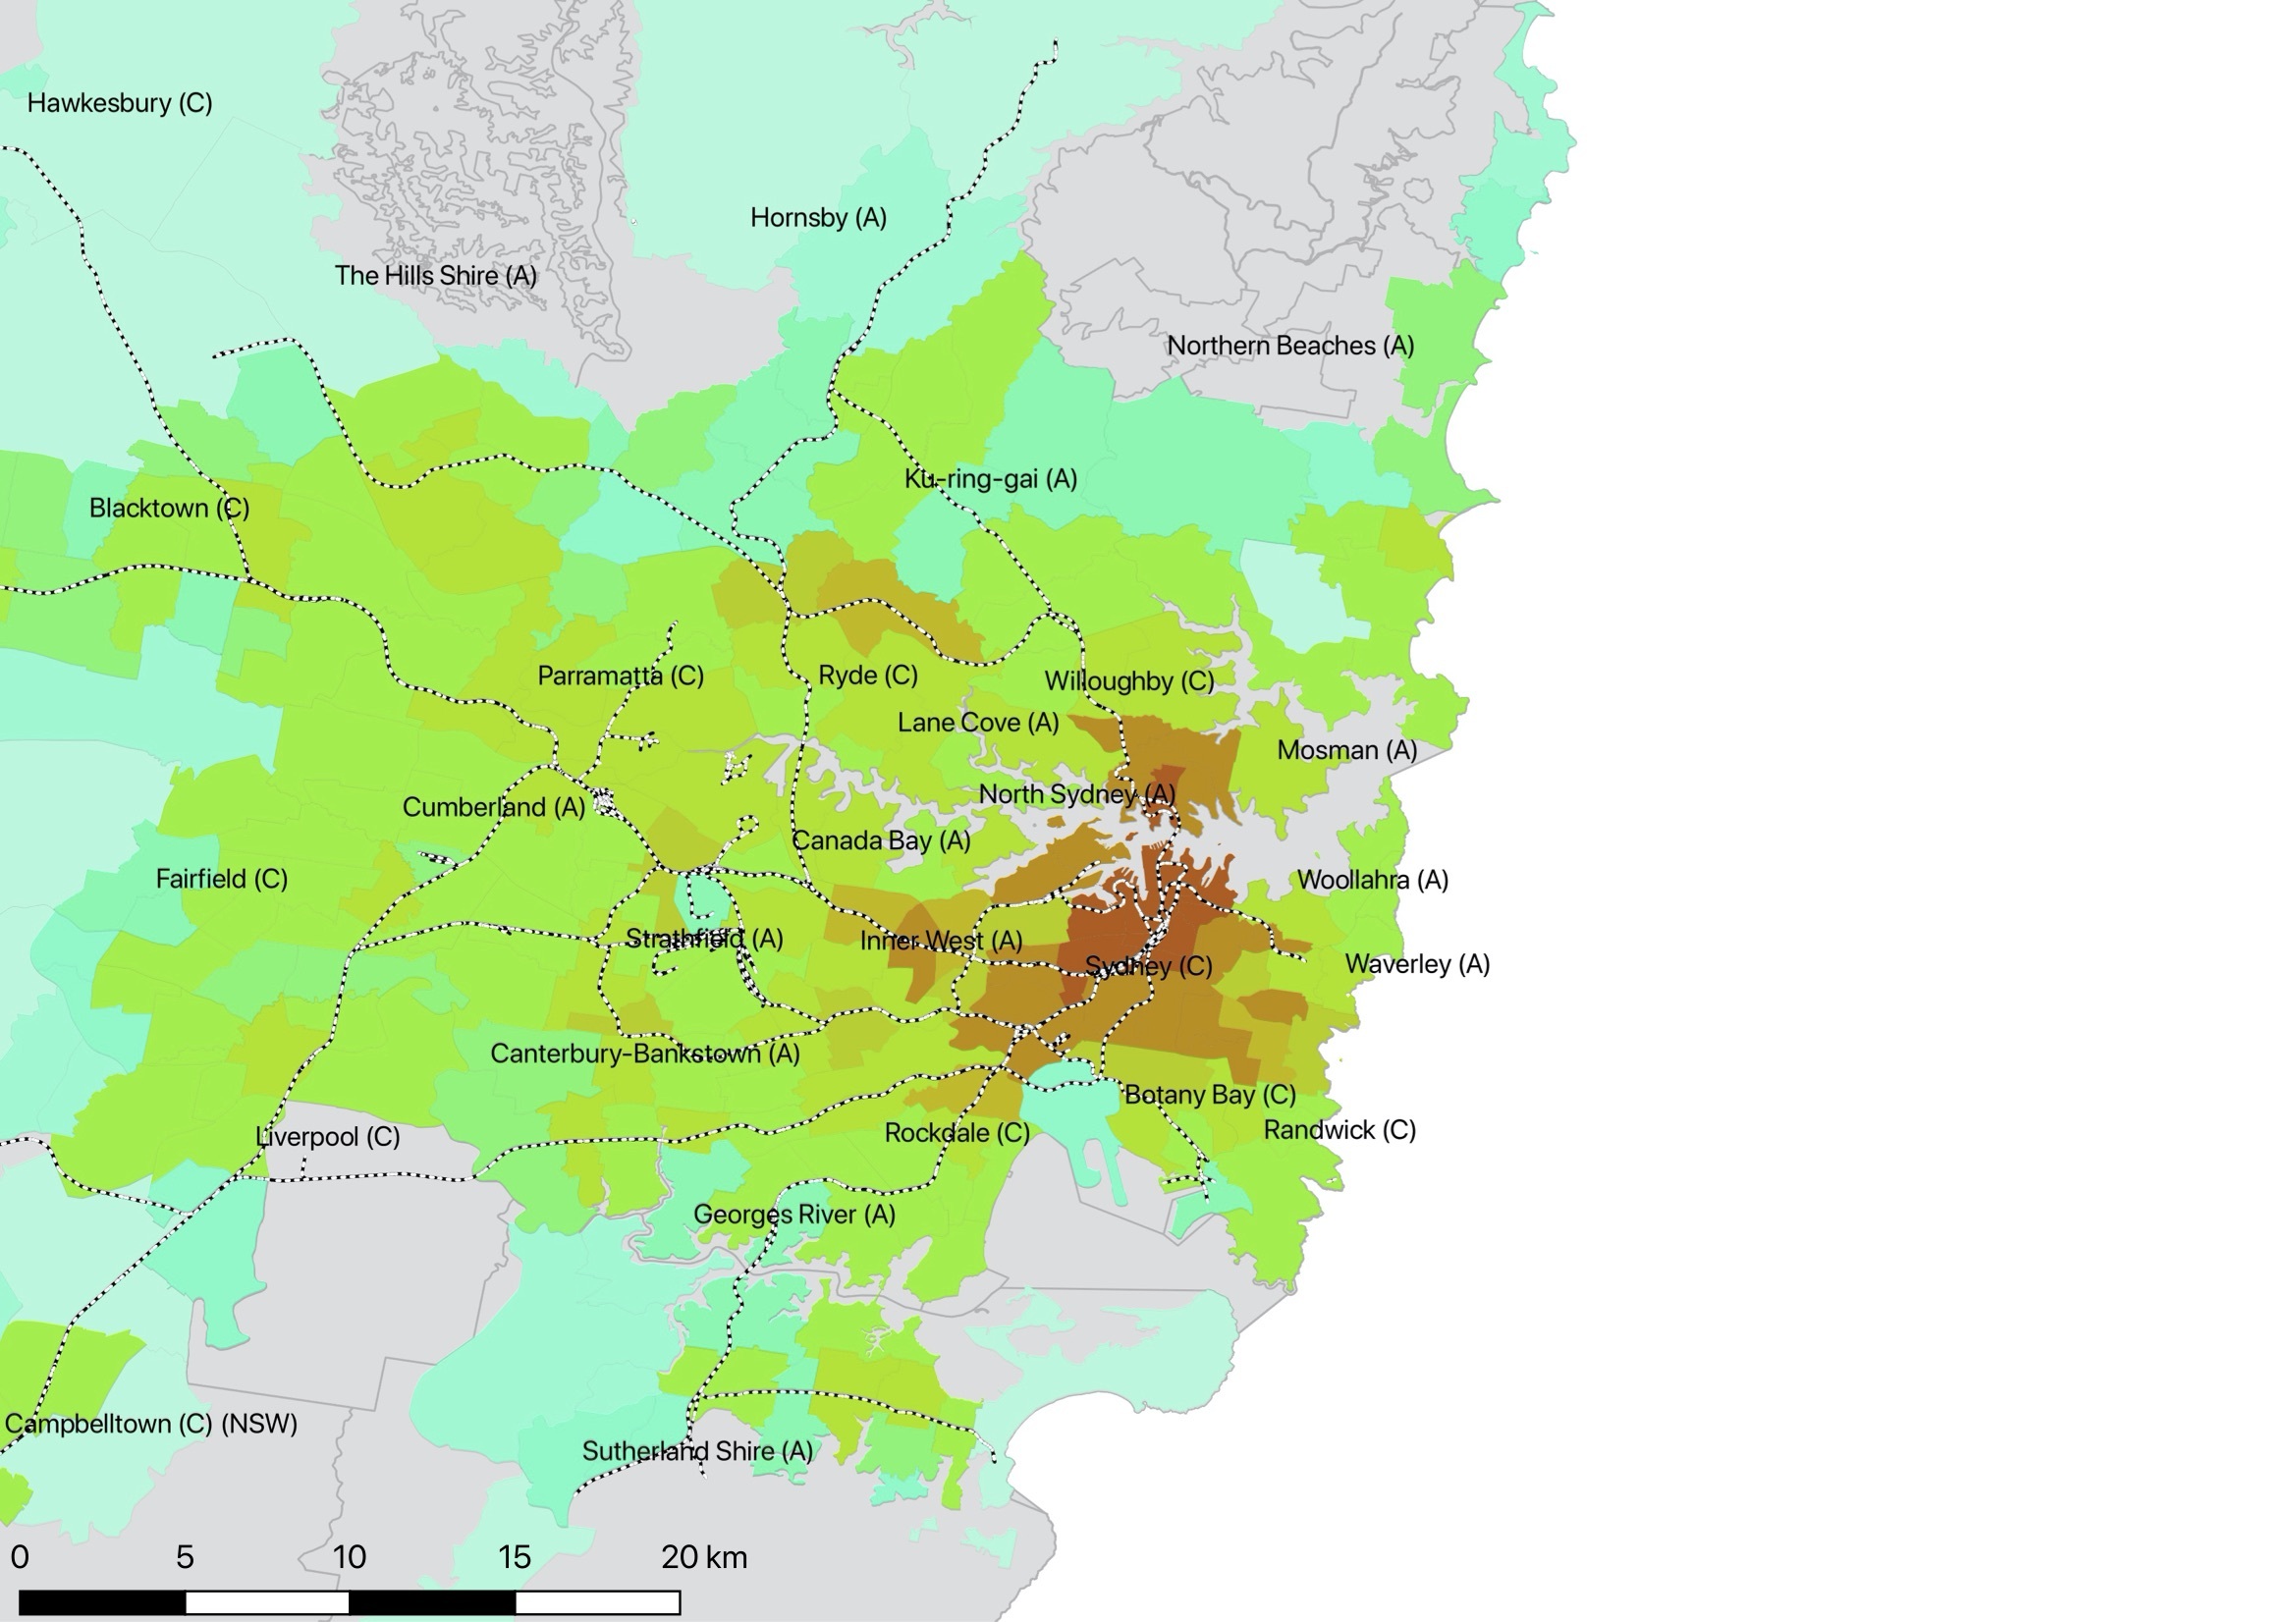
The new transit timetable has a mixed effect on accessibility. Changes in accessibility are mostly subtle. shows accessibility before and after the timetable change; plots proportional change in accessibility for each SA2.
The new timetable impacts areas of Sydney differently. Places with higher residential density to the west of city, most notably around the Parramatta (Sydney’s second CBD), and areas around the train junctions in the North-West of Sydney received an uplift in accessibility. The City of Sydney and its historical downtown CBD area which originally has high accessibility are worse off after the timetable change (). The whole eastern suburbs has lower accessibility to jobs after this timetable adjustment.
Since this accessibility measure is based on morning peak-hour (Wed, 8-9 am), the accessibility downgrade for people departing from Sydney’s CBD may not necessarily be negative for the inflow of CBD workers from outside the CBD; the change may be a redistribution of transit resources to facilitate the morning commute.
Change in population weighted accessibility
Population weighted accessibility for the studied area is an objective measurement that reflects the commute experience of the whole population, and shows whether the shift in accessibility at different places sums up as a positive, negative, or zero-sum gain. The measure reflects the redistribution of transit resources with respect to serving the population.
With the new timetable, the overall person-weighted accessibility dropped by 3%, from 45,070 to 43,730, under a 30-minute travel time threshold. Within the studied area, 63.3 % of the population would be adversely affected, and the rest 36.7 % would have better accessibility to jobs for their morning commute. Based on our method of measuring accessibility, the new timetable reduces overall accessibility, and the majority of population would be negatively affected. Other potential benefits of the new timetable, such as changes in operating cost, passenger throughput capacity, etc. are not measured in this paper.
