Processing math: 100%
Skip to main content
null
Findings
  • Menu
  • Articles
    • Energy Findings
    • Resilience Findings
    • Safety Findings
    • Transport Findings
    • Urban Findings
    • All
  • For Authors
  • Editorial Board
  • About
  • Blog
  • covid-19
  • search

RSS Feed

Enter the URL below into your favorite RSS reader.

http://localhost:46319/feed
Transport Findings
June 10, 2020 AEST

Extracting the Multimodal Fingerprint of Urban Transportation Networks

Luis Guillermo Natera Orozco, Federico Battiston, Gerardo Iñiguez, Michael Szell,
multiplex networkssustainable transportmulti-modal transportation
Copyright Logoccby-sa-4.0 • https://doi.org/10.32866/001c.13171
Photo by Ioan Sameli on Unsplash
Findings
Natera Orozco, Luis Guillermo, Federico Battiston, Gerardo Iñiguez, and Michael Szell. 2020. “Extracting the Multimodal Fingerprint of Urban Transportation Networks.” Findings, June. https:/​/​doi.org/​10.32866/​001c.13171.
Save article as...▾
Download all (2)
  • Figure 1.
    Download
  • Figure 2.
    Download

Sorry, something went wrong. Please try again.

If this problem reoccurs, please contact Scholastica Support

Error message:

undefined

View more stats

Abstract

Urban mobility increasingly relies on multimodality, combining the use of bicycle paths, streets, and rail networks. These different modes of transportation are well described by multiplex networks. Here we propose the overlap census method which extracts a multimodal profile from a city’s multiplex transportation network. We apply this method to 15 cities, identify clusters of cities with similar profiles, and link this feature to the level of sustainable mobility of each cluster. Our work highlights the importance of evaluating all the transportation systems of a city together to adequately identify and compare its potential for sustainable, multimodal mobility.

RESEARCH QUESTION AND HYPOTHESIS

The infrastructure of different modes of transportation can be described as a mathematical object, the multiplex transport network (Morris and Barthelemy 2012; Strano et al. 2012; Barthelemy et al. 2013; Battiston, Nicosia, and Latora 2014; Gallotti and Barthelemy 2014; De Domenico et al. 2014; Strano et al. 2015; Aleta, Meloni, and Moreno 2017; Lee et al. 2017). A city’s multiplex transport network contains the layer of streets and other coevolving network layers, such as the bicycle or the rail networks, which together constitute the multimodal transportation backbone of a city. Due to the car-centric development of most cities (Jacobs 1961), streets form the most developed layers (Gössling et al. 2016; Szell 2018) and define or strongly limit other layers: For example, sidewalks are by definition footpaths along the side of a street and make up a substantial part of a city’s pedestrian space (Gössling et al. 2016). Similarly, most bicycle paths are part of a street or are built along the side. Yet, the different layers of a multimodal network typically serve as diverse channels to permeate a city. Here we consider the transport networks of 15 world cities and develop an urban fingerprinting technique based on multiplex network theory to characterize the various ways in which transport layers can be interconnected, identifying the potential for multimodal transport. Using clustering algorithms on the resulting urban fingerprints, we find distinct classes of cities, reflecting their transport priorities.

METHODS AND DATA

We acquired urban transportation networks from multiple cities around the world, defined by their administrative boundaries, using OSMnx (Boeing 2017). These data sets are of high quality (Haklay 2010; Girres and Touya 2010) in terms of correspondence with municipal open data (Ferster et al. 2019) and completeness (Barbosa-Filho et al. 2018). The various analyzed urban areas and their properties are reported in Table 1. Figure 1 shows the different network layers for Manhattan, one of our analyzed cities.

Table 1.
Pedestrian Bicycle Rail Street Population
Nodes Links ⟨k⟩ Nodes Links ⟨k⟩ Nodes Links ⟨k⟩ Nodes Links ⟨k⟩
Amsterdam 23,321 33,665 2.89 34,529 35,619 2.06 1,096 1,655 3.02 15,125 21,722 2.87 872,680
Barcelona 20,203 30,267 3.00 7,553 7,647 2.02 249 249 2.00 10,393 15,809 3.04 1,600,000
Beihai 2,026 2,978 2.94 0 0 0.00 59 62 2.10 2,192 3,209 2.93 1,539,300
Bogota 81,814 121,038 2.96 9,760 9,651 1.98 166 165 1.99 62,017 91,197 2.94 7,412,566
Budapest 73,172 106,167 2.90 10,494 10,318 1.97 1,588 1,964 2.47 37,012 52,361 2.83 1,752,286
Copenhagen 30,746 41,916 2.73 13,980 13,988 2.00 276 369 2.67 15,822 20,451 2.59 2,557,737
Detroit 47,828 78,391 3.28 3,663 3,626 1.98 20 21 2.10 28,462 45,979 3.23 672,662
Jakarta 140,042 191,268 2.73 248 231 1.86 58 54 1.86 138,388 188,637 2.73 10,075,310
LA 89,543 128,757 2.88 14,577 14,428 1.98 173 221 2.55 71,091 101,692 2.86 3,792,621
London 270,659 351,824 2.60 62,398 60,043 1.92 2,988 3,535 2.37 179,782 219,917 2.45 8,908,081
Manhattan 13,326 21,447 3.22 3,871 3,777 1.95 349 436 2.50 5,671 9,379 3.31 1,628,701
Mexico 108,033 158,425 2.93 5,218 5,278 2.02 370 364 1.97 95,375 140,684 2.95 8,918,653
Phoenix 111,363 157,075 2.82 35,631 35,979 2.02 105 138 2.63 73,688 102,139 2.77 1,445,632
Portland 50,878 72,958 2.87 24,252 24,325 2.01 230 340 2.96 35,025 49,062 2.80 583,776
Singapore 82,808 110,612 2.67 12,981 12,947 1.99 683 740 2.17 50,403 66,779 2.65 5,638,700

Measures for the administrative area of analyzed cities. The number of nodes, links and average degree (⟨k⟩) for each layer in all cities of our dataset are highly diverse due to the varying developmental levels and focus of transport. The range of population in the analyzed cities goes from half million people to ten million people living in Jakarta, this allows to have a range of different sizes and cover different developmental stages.

Data and code to replicate the results are available in: (https://doi.org/10.7910/DVN/GSOPCK), and:
(https://github.com/nateraluis/Multimodal-Fingerprint).

Figure 1
Figure 1.

(Map plot left) Multiplex network representation of Manhattan with the four analyzed layers of transport infrastructure (pedestrian paths, bicycle paths, rail lines, and streets), with data from OpenStreetMap. (Right) Network information for each layer, number of nodes, links and average degree (⟨k⟩).

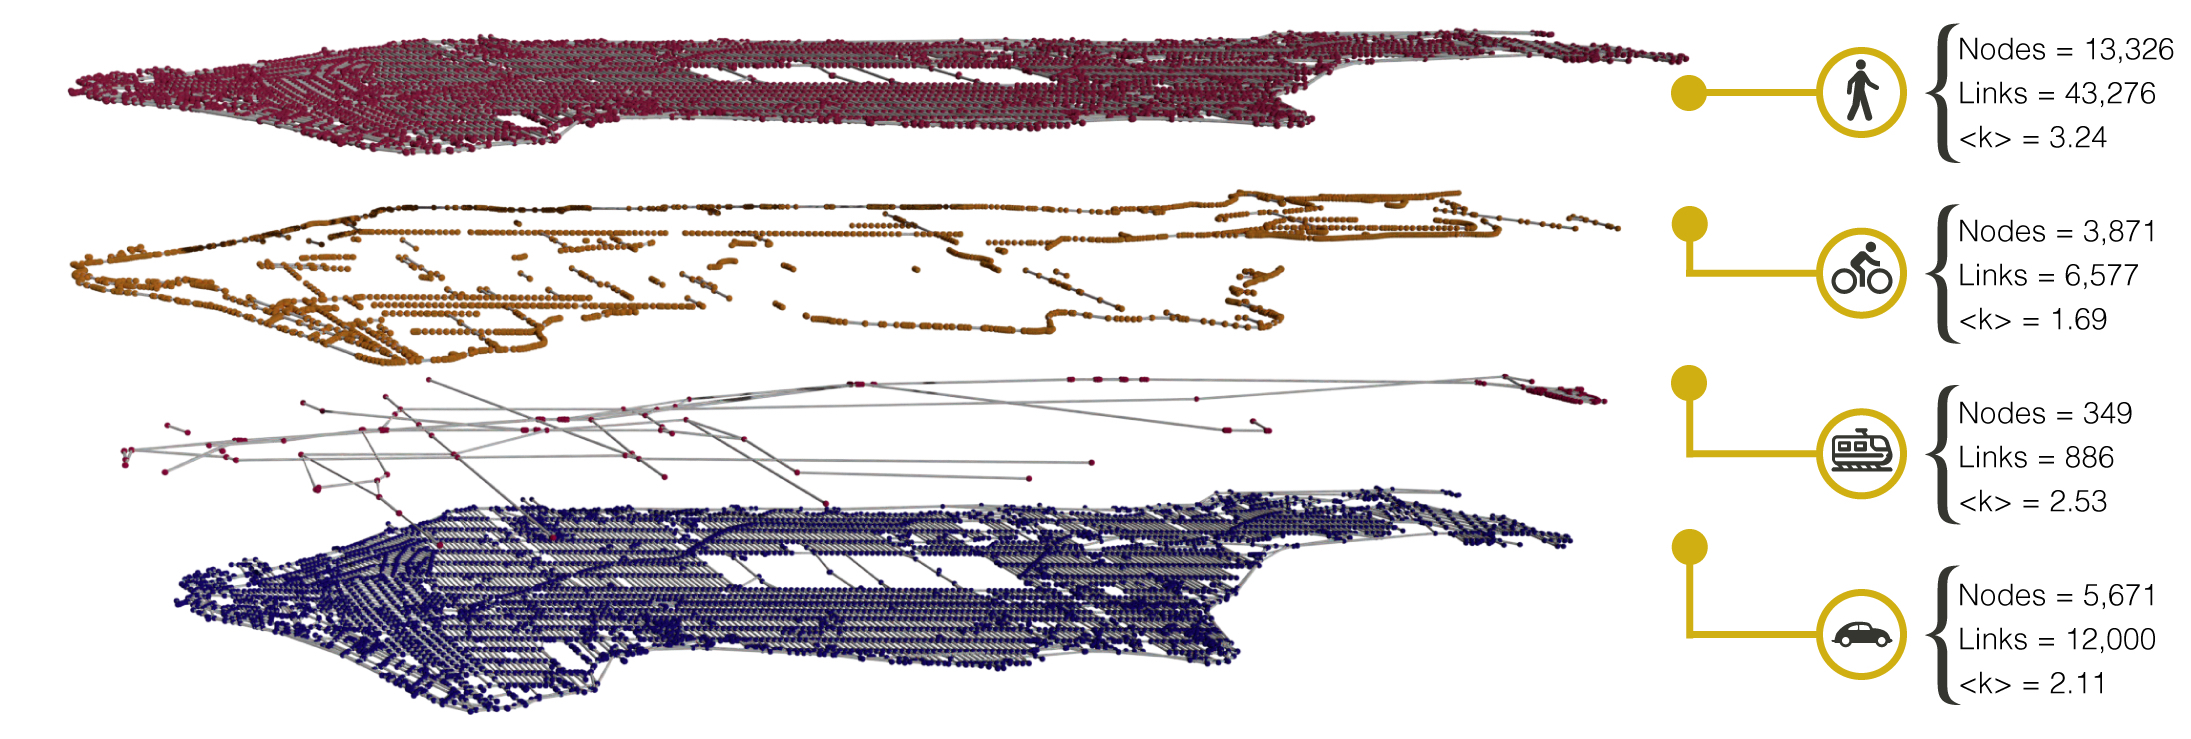
We characterize each city as a multiplex network (Boccaletti et al. 2014; Kivela et al. 2014; Battiston, Nicosia, and Latora 2017) with M layers and N nodes that can be active in one or more layers in the system. Layers follow a primal approach (Porta, Crucitti, and Latora 2006) where nodes represent intersections (that may be present in one or more layers), and links represent streets (denoted by s), bicycle paths and designated bicycle infrastructure (b), subways, trams and rail infrastructure (r), or pedestrian infrastructure (p). Construction of these intersection nodes follows the topological simplification rules of OSMnx (Boeing 2017).

In a multimodal city, we expect to find many transport hubs that connect different layers, such as train stations with bicycle and street access, i.e. nodes that are active in different multiplex configurations. Here we propose a method to assess all such combinations of node activities in the system, helping us to learn how well connected different modes are. For each city, we build a profile based on the combinations of node activities, and refer to it as overlap census (Figure 2). The overlap census captures the percentage of nodes that are active in different multiplex configurations and provides an “urban fingerprint” of its multimodality (Aleta, Meloni, and Moreno 2017). To define the overlap census formally, given a multiplex transport network with M layers the overlap census is a vector of (2M)−1 components, which accounts for the fractions of nodes that can be reached through at least one layer.

In Fig. 2(a) we show a schematic of how the overlap census is built: taking the multiplex network, and calculating the percentage of nodes that overlap in different configurations. The multiplex approach addresses the multimodality of a city: it not only counts how many nodes or links there are in each layer, but it shows how they are combined, revealing the possible multimodal mobility combinations in the city. Understanding the possibilities for interchange between mobility layers provides us with a better understanding of urban systems, showing us the complexity and interplay between layers.

FINDINGS

Even in a multimodally “optimal” city there will be a high heterogeneity of node activities due to the different speeds and nature of transport modes, implying, for example, a much lower density of nodes necessary for a train network than for a bicycle network. Therefore, a good way to assess a city’s overlap census is by comparing it with the overlap census of other cities. We find similarities between cities via a k-means algorithm fed with fifteen vectors (one per city), where each vector contains the percentages of nodes active in each possible configuration. The algorithm separates the 15 analyzed cities into six different clusters [Fig. 2(b)].

Figure 2
Figure 2.

(a) Schematic of multiplex layers in a city (left) and its transformation to the overlap census (right). In the overlap census, the vertical red line gives a visual separation of the left from the right half where nodes become active in the street layer. High spikes in the right half indicate car-centricity. (b) Clusters of cities based on similarity of their overlap census. We find six different clusters using a k-means algorithm (coloured areas), which explain more than 90% of the variance. (c) Overlap census for cities in each cluster. The first one corresponds to Amsterdam (the city with most active nodes in bicycle-only configurations). The Copenhagen-Manhattan-Barcelona-Portland city cluster has manyactive nodes in pedestrian-only and bicycle-only configurations, representing an active mobility city. The clusters of Los Angeles-Bogota and Mexico-Beihai-Jakarta are car-centric.

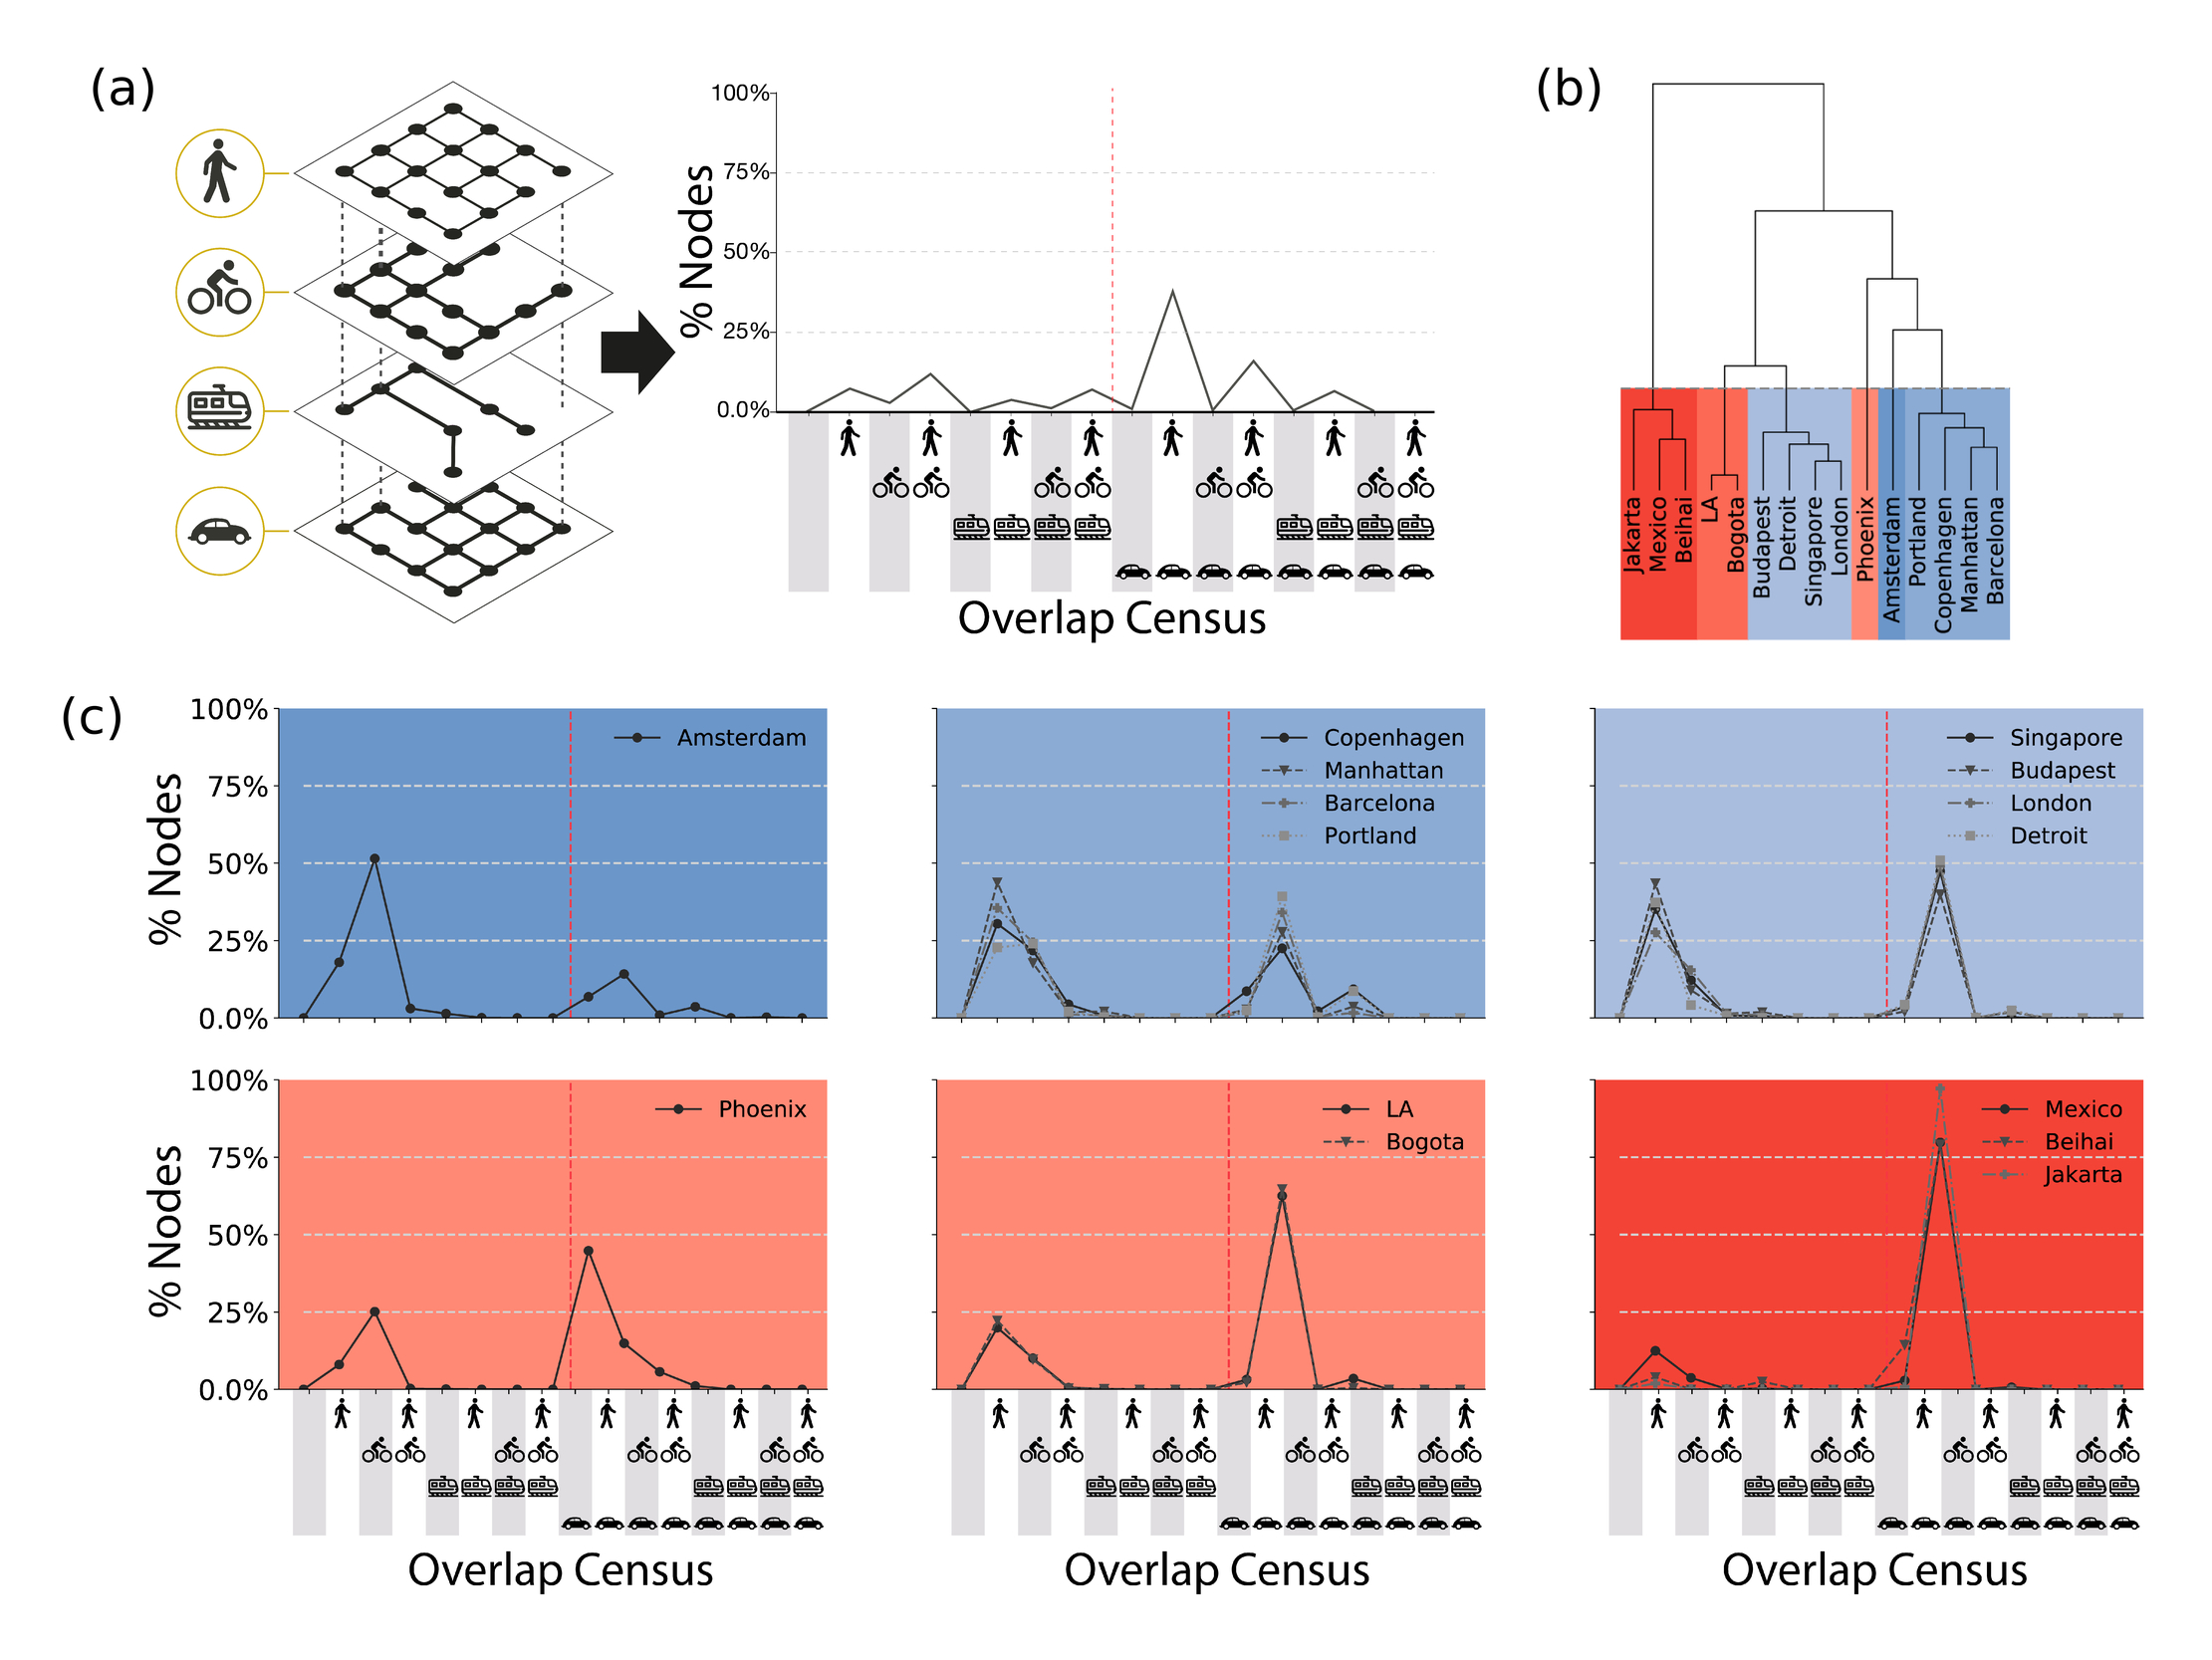
On the left half of the overlap census, we show the configurations in which nodes are not active in the street layer, while the right half contains car-related configurations [Fig. 2(c)]. These clusters of cities are useful to explain similarities in infrastructure planning in different transport development paths (Rodrigue 2013; Louf and Barthelemy 2014), with clusters of car-centric urbanization (like Mexico, Beihai, and Jakarta) opposed to clusters that show a more multimodal focus in their mobility infrastructure (like Copenhagen, Manhattan, Barcelona, and Portland). In the extreme cluster that contains only Amsterdam, close to 50% of nodes are active in the bicycle layer, whereas in the Mexico-Beihai-Jakarta cluster more than 50% of nodes are active in the street-pedestrian configuration. The concentration of nodes in just one configuration informs not only about the mobility character of the city, i.e. Amsterdam being a bicycle-friendly city, but unveils the importance of explicitly considering overlooked layers and their interconnections. For example, Singapore, Budapest, London, and Detroit have two main peaks indicating that most of their nodes are either active in the street-pedestrian or only in the pedestrian configuration. This is not the case in Los Angeles and Bogota, where the majority of nodes are active in the car-pedestrian combination, i.e. the pedestrians have to share most of the city with cars. Our multimodal fingerprint unravels how different transport modes are interlaced, helping identifying which layer (or set of layers) could be improved to promote multimodal, sustainable mobility.

To summarize, we propose the new “overlap census” method based on multiplex network theory allowing to rigorously identify and compare the multimodal potential of cities.

References

Aleta, Alberto, Sandro Meloni, and Yamir Moreno. 2017. “A Multilayer Perspective for the Analysis of Urban Transportation Systems.” Scientific Reports 7 (1). https:/​/​doi.org/​10.1038/​srep44359.
Google ScholarPubMed CentralPubMed
Barbosa-Filho, Hugo, Marc Barthelemy, Gourab Ghoshal, Charlotte R. James, Maxime Lenormand, Thomas Louail, Ronaldo Menezes, José J. Ramasco, Filippo Simini, and Marcello Tomasini. 2018. “Human Mobility: Models and Applications.” Physics Reports 734 (March):1–74. https:/​/​doi.org/​10.1016/​j.physrep.2018.01.001.
Google Scholar
Barthelemy, Marc, Patricia Bordin, Henri Berestycki, and Maurizio Gribaudi. 2013. “Self-Organization versus Top-down Planning in the Evolution of a City.” Scientific Reports 3 (1). https:/​/​doi.org/​10.1038/​srep02153.
Google ScholarPubMed CentralPubMed
Battiston, Federico, Vincenzo Nicosia, and Vito Latora. 2014. “Structural Measures for Multiplex Networks.” Physical Review E 89 (3). https:/​/​doi.org/​10.1103/​physreve.89.032804.
Google Scholar
———. 2017. “The New Challenges of Multiplex Networks: Measures and Models.” The European Physical Journal Special Topics 226 (3): 401–16. https:/​/​doi.org/​10.1140/​epjst/​e2016-60274-8.
Google Scholar
Boccaletti, S., G. Bianconi, R. Criado, C.I. del Genio, J. Gómez-Gardeñes, M. Romance, I. Sendiña-Nadal, Z. Wang, and M. Zanin. 2014. “The Structure and Dynamics of Multilayer Networks.” Physics Reports 544 (1): 1–122. https:/​/​doi.org/​10.1016/​j.physrep.2014.07.001.
Google ScholarPubMed Central
Boeing, Geoff. 2017. “OSMnx: New Methods for Acquiring, Constructing, Analyzing, and Visualizing Complex Street Networks,” March. https:/​/​doi.org/​10.31235/​osf.io/​q86sd.
Google Scholar
De Domenico, M., A. Solé-Ribalta, S. Gómez, and A. Arenas. 2014. “Navigability of Interconnected Networks under Random Failures.” Proc. Natl. Acad. Sci. 111 (23): 8351–56.
Google Scholar
Ferster, Colin, Jaimy Fischer, Kevin Manaugh, Trisalyn Nelson, and Meghan Winters. 2019. “Using OpenStreetMap to Inventory Bicycle Infrastructure: A Comparison with Open Data from Cities.” International Journal of Sustainable Transportation 14 (1): 64–73. https:/​/​doi.org/​10.1080/​15568318.2018.1519746.
Google Scholar
Gallotti, Riccardo, and Marc Barthelemy. 2014. “Anatomy and Efficiency of Urban Multimodal Mobility.” Scientific Reports 4 (1). https:/​/​doi.org/​10.1038/​srep06911.
Google ScholarPubMed CentralPubMed
Girres, Jean-François, and Guillaume Touya. 2010. “Quality Assessment of the French OpenStreetMap Dataset.” Transactions in GIS 14 (4): 435–59. https:/​/​doi.org/​10.1111/​j.1467-9671.2010.01203.x.
Google Scholar
Gössling, Stefan, Marcel Schröder, Philipp Späth, and Tim Freytag. 2016. “Urban Space Distribution and Sustainable Transport.” Transport Reviews 36 (5): 659–79. https:/​/​doi.org/​10.1080/​01441647.2016.1147101.
Google Scholar
Haklay, Mordechai. 2010. “How Good Is Volunteered Geographical Information? A Comparative Study of OpenStreetMap and Ordnance Survey Datasets.” Environment and Planning B: Planning and Design 37 (4): 682–703. https:/​/​doi.org/​10.1068/​b35097.
Google Scholar
Jacobs, J. 1961. The Death and Life of Great American Cities. New York, New York, USA: Random House.
Google Scholar
Kivela, M., A. Arenas, M. Barthelemy, J. P. Gleeson, Y. Moreno, and M. A. Porter. 2014. “Multilayer Networks.” Journal of Complex Networks 2 (3): 203–71. https:/​/​doi.org/​10.1093/​comnet/​cnu016.
Google Scholar
Lee, Minjin, Hugo Barbosa, Hyejin Youn, Petter Holme, and Gourab Ghoshal. 2017. “Morphology of Travel Routes and the Organization of Cities.” Nature Communications 8 (1). https:/​/​doi.org/​10.1038/​s41467-017-02374-7.
Google ScholarPubMed CentralPubMed
Louf, Rémi, and Marc Barthelemy. 2014. “A Typology of Street Patterns.” Journal of The Royal Society Interface 11 (101): 20140924. https:/​/​doi.org/​10.1098/​rsif.2014.0924.
Google ScholarPubMed CentralPubMed
Morris, R. G., and M. Barthelemy. 2012. “Transport on Coupled Spatial Networks.” Physical Review Letters 109 (12). https:/​/​doi.org/​10.1103/​physrevlett.109.128703.
Google Scholar
Porta, Sergio, Paolo Crucitti, and Vito Latora. 2006. “The Network Analysis of Urban Streets: A Primal Approach.” Environment and Planning B: Planning and Design 33 (5): 705–25. https:/​/​doi.org/​10.1068/​b32045.
Google Scholar
Rodrigue, Jean-Paul. 2013. The Geography of Transport Systems. Routledge. https:/​/​doi.org/​10.4324/​9780203371183.
Google Scholar
Strano, Emanuele, Vincenzo Nicosia, Vito Latora, Sergio Porta, and Marc Barthélemy. 2012. “Elementary Processes Governing the Evolution of Road Networks.” Scientific Reports 2 (1). https:/​/​doi.org/​10.1038/​srep00296.
Google ScholarPubMed CentralPubMed
Strano, Emanuele, Saray Shai, Simon Dobson, and Marc Barthelemy. 2015. “Multiplex Networks in Metropolitan Areas: Generic Features and Local Effects.” Journal of The Royal Society Interface 12 (111): 20150651. https:/​/​doi.org/​10.1098/​rsif.2015.0651.
Google ScholarPubMed CentralPubMed
Szell, Michael. 2018. “Crowdsourced Quantification and Visualization of Urban Mobility Space Inequality.” Urban Planning 3 (1): 1. https:/​/​doi.org/​10.17645/​up.v3i1.1209.
Google Scholar

This website uses cookies

We use cookies to enhance your experience and support COUNTER Metrics for transparent reporting of readership statistics. Cookie data is not sold to third parties or used for marketing purposes.

Powered by Scholastica, the modern academic journal management system