1. RESEARCH QUESTIONS AND HYPOTHESES
Many cities in the United States are experiencing decreases in vehicular traffic during the COVID-19 pandemic due to stay-at-home order, social distancing, and other external or self-imposed isolation measures. Cities are also reporting anecdotal evidence of dramatic increases in speeding (Andrew 2020; Bellon 2020; Hu 2020). However, there have been a few attempts to do proper statistical data analysis to more conclusively demonstrate that speeding has increased. If lower volumes are associated with higher speeds, this could result in a higher risk of crashes and more severe outcomes (Aarts and Van Schagen 2006; Zdechlik 2020). We investigate evidence of increased vehicle speeding for Ohio’s three biggest urbanized areas (UAs): Columbus, Cincinnati, and Cleveland, using mapping and statistical analysis of real-time traffic data. Specifically, we focus on two research questions:
-
Has the spatial extent of speeding increased this year compared to the same period last year before the COVID-19 pandemic?
-
Are the average differences in speeding before and after the COVID-19 pandemic statistically significant?
2. METHODS AND DATA
We compare INRIX traffic data for the three-week period from March 28 to April 19 in 2019 versus 2020. Ohio’s stay-at-home order went into effect on March 23, 2020. Specifically, we use traffic data for INRIX XD-level road segments to examine changes in speeding patterns before and after the COVID-19 outbreak. INRIX XD (eXtreme Definition) segments have greater granularity and capability to capture quick changes in the road networks due to the system-wide (e.g., COVID-19) or local (e.g., sports games) events, policy changes (e.g., congestion charging), and transport interventions (e.g., addition of new roads) (INRIX 2020). There are a total of 138,166 INRIX XD road segments in Ohio. The traffic data is available at high spatial resolution: the smallest XD road segment is smaller than 0.002 kilometer and the largest one is 1.798 kilometer. Interested researchers can access worldwide real-time traffic data through INRIX Roadway Analytics with a paid membership.
INRIX traffic data provides two types of speeds: reference and observed real-time speeds. Reference speed is based on the typical free-flow speed for a given road segment. These are not the actual posted or legal speed limits but are closely related to these posted limits (INRIX 2020). In this study, we define speeding as the difference between average observed speed (for a given time period) and the INRIX reference speed.
We visualize and compare spatial patterns of speeding pre (2019) and post (2020) the COVID-19 outbreak to examine if the spatial extent of speeding is increased in the Columbus, Cincinnati (Ohio part only), and Cleveland UAs after the COVID-19 pandemic began. We also generate summary statistics and plots, exploring speeding trends within the study areas. Further, we do statistical tests (bootstrap T-test) to investigate whether the mean differences in speeding before and after the COVID-19 outbreak are statistically significant in all three major urbanized areas in Ohio, USA. Bootstrap technique can account for non-normality in data distributions as well as non-equal variances between the groups.
3. FINDINGS
Figure 1 shows the changes in the spatial extent of speeding before and after the COVID-19 pandemic in the study areas. Overall, we found a significant increase in speeding in all three cities compared to the same period last year. The proportion of road kilometers on which speeding was observed in the Columbus UA over tripled from 20.6 % to 70.6 %. Cincinnati and Cleveland UAs also showed an approximately tripling in the proportion of road kilometers on which speeding was observed: 21.5 % to 63.5 % and 22.5 % to 63.9 %, respectively.
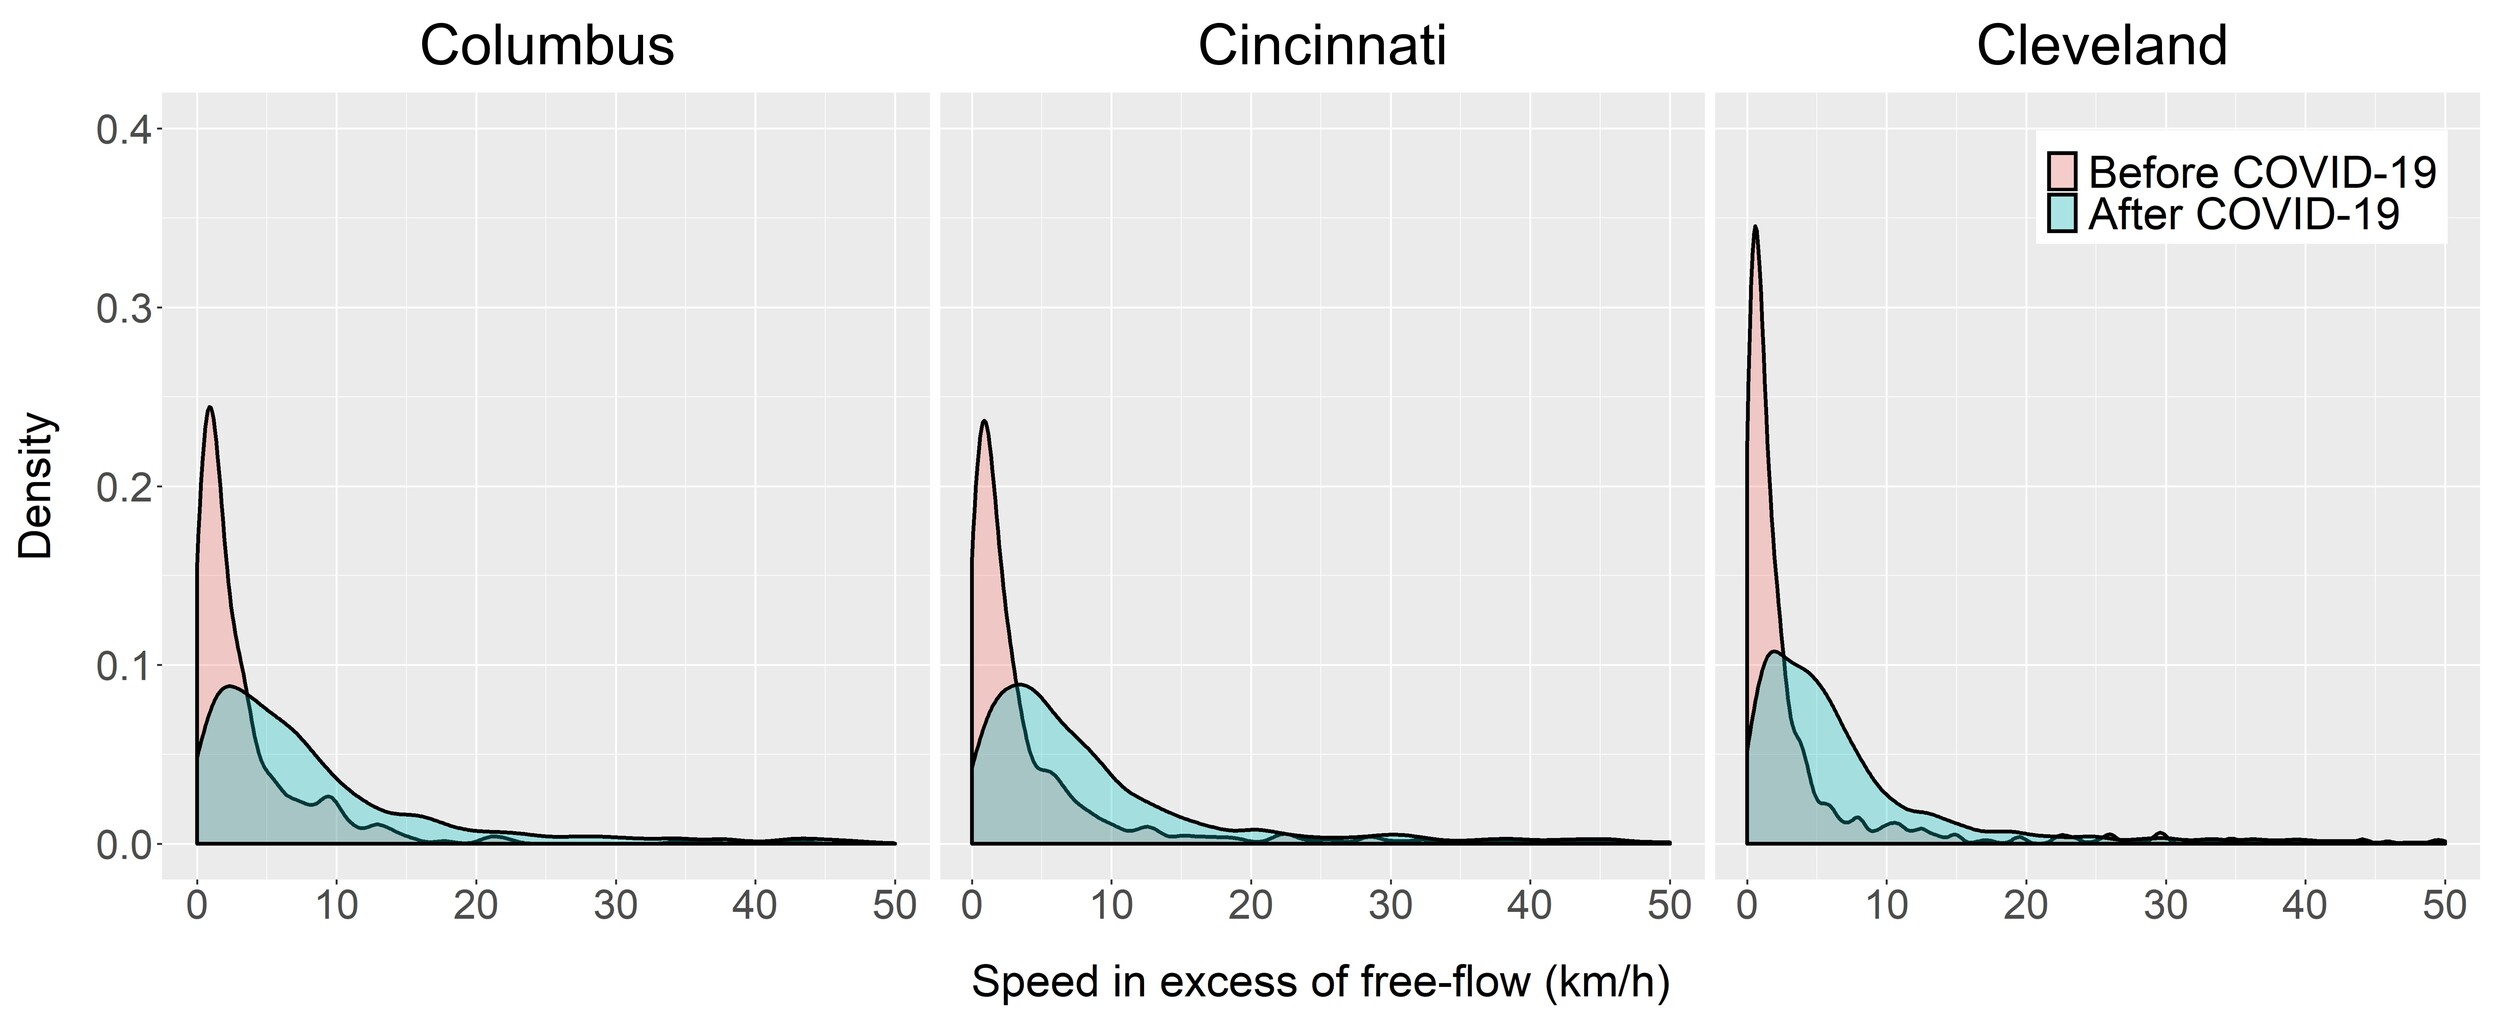
The average level of speeding also increased. Table 1 presents the mean speeding levels before and after the COVID-19 outbreak in three urbanized areas. A notable increase in the average level of speeding is observed across all three cities. Also, the levels of extreme speeding have increased considerably. Figure 2 displays the density curves of speeding, showing the distribution of road segments with speeding levels over the reference (or free-flow) speed. This shows a clear shift toward greater speeding, as evidenced by the more dispersed “After COVID-19” distributions, along with their shifts towards the right (higher speeding).
Table 2 presents the results of bootstrap T-test examining whether the mean differences in speeding before and after the COVID-19 outbreak are statistically significant. As shown in Table 2, low P-values indicate average differences in speeding before and after the COVID-19 are statistically significant across all three major urbanized areas in Ohio, USA.
Our results add to empirical evidence demonstrating reductions in traffic during the COVID-19 pandemic are leading to increases in the spatial extent and levels of vehicular speeding. In Ohio’s three major cities, drivers are apparently taking advantage of empty roads to drive faster, making streets and highways potentially more dangerous. This suggests traffic may be a major controlling factor on vehicle speeds. Implications include a need for greater vigilance and enforcement such as temporary speeding cameras with respect to speeding. The spatial variation in speeding levels also suggests other factors may be at work, such as street designs that encourage speeding (Yokoo and Levinson 2019). Although this study is based on the assumption of reduced traffic levels during the COVID-19 pandemic, we were not able to actually show to what extent traffic has decreased due to the absence of the data. A future step of this research is to explore relationships between traffic volume reductions and speeding patterns using real-time traffic volume and speed data available.


