1. Questions
Cycling is political: its development is opposed when space for cars is reclaimed. Opposition usually comes from conservative parties along car lobbies and retailers (e.g. Henderson and Gulsrud 2019; Walks 2015; Wild et al. 2018). In Switzerland, support for cycling decreases along a left-right gradient, both for new cycle lanes and for a national vote to foster cycling in the Constitution (Rérat, Haldimann, and Widmer 2022; Rérat and Ravalet 2023).
But how does cycling itself vary between individuals according to their political values? To answer this question, this article analyses whether the frequency and reasons for cycling (for transport or leisure) vary according to political leaning while controlling for socio-demographic and spatial variables.
2. Methods
In 2018, 74% of Swiss citizens voted in favor of fostering cycling to be included in the Constitution. A post-vote survey was conducted by the Federal Chancellery among 1502 randomly selected Swiss citizens over the age of 18 (FORS 2020).
The two dependent variables are:
-
Cycling frequency: every day; at least once a week; at least once a month; less than once a month (then recoded as at least once a week vs rarely)
-
Reasons for cycling: for leisure (touring, sport); for transport (e.g. commuting); both equally (the last two are then aggregated to identify utility cyclists).
Political affiliation – the independent variable – is measured as the party that respondents feel best reflects their views. This includes the main parties, to which we have added smaller affiliated parties, listed from left to right in Table 1. We have aggregated the two Green parties given their lower weight and common environmental values, although their position varies on a left-right gradient. People who do not feel close to any party are labelled “other”. Political affiliation is very stable in Switzerland compared to other countries (Ladner, Schwarz, and Fivaz 2023).
We considered several control variables:
-
Gender
-
Age
-
Education
-
Equivalized income[1]
-
Language region
-
Degree of urbanization of the municipality of residence (Eurostat 2020)[2]
We crossed the frequency and reasons for cycling with political parties and then ran two logistic regressions. These models measure the influence of each variable “all other things being equal” in terms of odds ratios. An odds ratio is the ratio of the odds of an event occurring in one group compared to another. A value greater than one means that the group is more likely to cycle, and an odds ratio below one means a lower propensity.
3. Findings
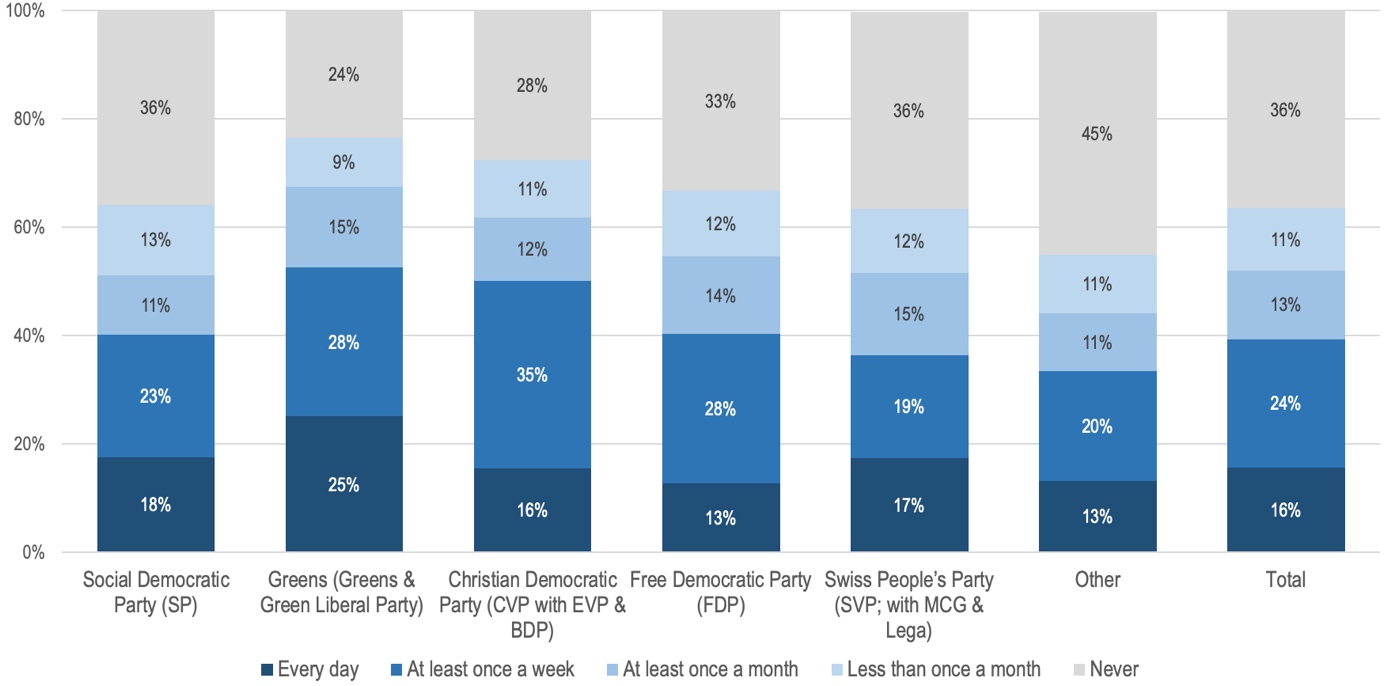
The highest proportion of people who cycle regardless of frequency is found among the Greens (76%) followed by The Center (CVP) voters (73%) (Figure 1). Two thirds cycle among the voters of the Social Democratic Party (SP), the Free Democratic Party (FDP) and the Swiss People’s Party (SVP). The lowest value is found among those who do not belong to any party (33.5%)[3].

Green voters are also the most frequent cyclists – 25% cycle every day – which is related to their use of the bicycle for transport (see below). They are followed by voters of SP (18%), SVP (17%) and CVP (16%). If we consider people who cycle at least once a week, there is a left-right gradient, but it is not perfect: Greens (53%) are followed by the CVP (50%), then by the SP and PLR (40%), and finally by the SVP (36%).
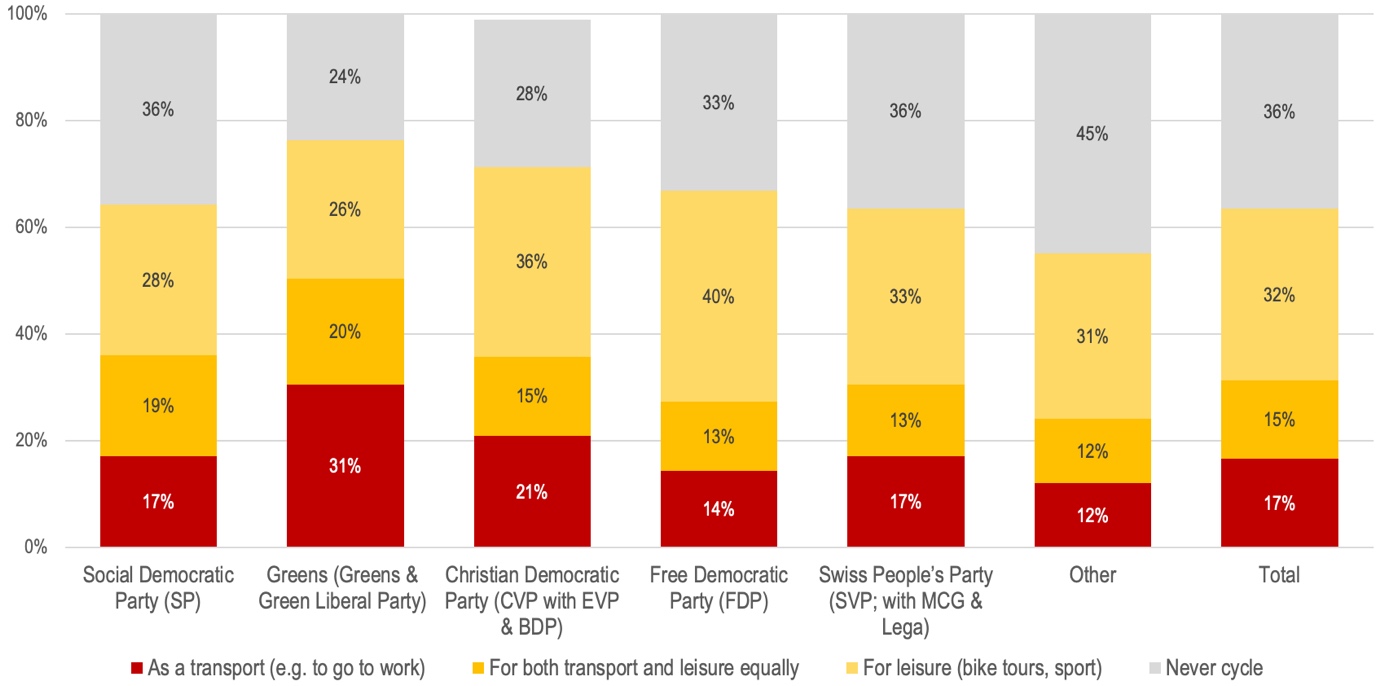
Differences are more marked regarding the reasons to cycle (Figure 2). Half of Green voters cycle for transport (exclusively or in combination with leisure). The other parties have much lower shares (between 27% for the FDP and 36% for the SP). Strictly recreational cyclists who don’t cycle for transport are more numerous among centre and right-wing parties (from 33% for SVP to 40% for FDP).

Models show that, men cycle more often than women, but the differences in the reasons for cycling are not significant. With regard to age, people under 40 cycle more for transport. There is no effect of income. Compared to university graduates, people with only compulsory schooling cycle more, while people with an apprenticeship cycle less.
People in the German-speaking part of Switzerland cycle more often than in the French- and Italian-speaking regions and cycle more for transport. These differences can be largely explained by varying levels of infrastructure and safety for cyclists (Rérat 2021). People in urban areas cycle more often but there are no differences between utility and leisure cycling.
All things being equal, Green voters have the highest odds ratios – Exp(B) – for both frequent cycling and transport (Table 3). They are followed by SP and CVP voters for utility cycling (and the same parties but in reverse order for the frequency to cycle). Among right-wing voters, cycling is more restricted to leisure.
Our analysis confirms that there is an effect of political values – and a left-right gradient although not perfect – on cycling. Green voters are those who not only cycle more often but also cycle more for transport, which could suggest that their environmental values predispose them to do so. Both SP (left) and CVP (centre) voters also cycle more for transport, all things being equal. Voters of the right and far right parties are the least likely to cycle.
At first sight, this is in line with the political debates as the Green parties strongly support cycling projects. However, the SP’s support for cycling is higher than its supporters’ actual use, while the opposite is true for the centre and right parties. Although SVP and FDP voters are significantly less likely to cycle for transport, their proportion of cyclists remains substantial, which may indicate a dissonance between these parties’ reluctance to cycling policies and the practices of their voters.
Further research could address not only whether cycling varies according to political leaning but also why, by analyzing the role of political ideologies and the values and images associated with transportation modes.
Person’s hypothetical income based on the taxable income of the household. It assumes that households which are composed of more than one person need less resources for the same standard of living.
Eurostat (2020) classifies municipalities based on 1 km² grid cells in 2 steps. First, cells are classified based on population density, contiguity, and population size: urban centres (population ≥ 50,000 inhabitants and contiguous grid cells of 1 km2 with ≥ 1 500 inhabitants per km2), urban clusters (population ≥ 5000 inhabitants and contiguous grid cells of 1 km2 with ≥ 300 inhabitants per km2), rural (outside urban clusters and urban centres). Then, municipalities are classified into 3 types: densely populated (where at least 50% of the population lives in one or more urban centres), intermediate (where less than 50% of the population lives in an urban centre and at least 50% in an urban cluster) and thinly populated (where more than 50% of the population lives in rural grid cells).
The only comparable national survey found a similar share (60%) of people who cycled at least once a year (Omnibus survey 2015, Federal Office for Statistics).