Loading [Contrib]/a11y/accessibility-menu.js
Skip to main content
null
Findings
  • Menu
  • Articles
    • Energy Findings
    • Resilience Findings
    • Safety Findings
    • Transport Findings
    • Urban Findings
    • All
  • For Authors
  • Editorial Board
  • About
  • Blog
  • covid-19
  • search

RSS Feed

Enter the URL below into your favorite RSS reader.

http://localhost:25822/feed
Transport Findings
May 28, 2020 AEST

Tracing the Sars-CoV-2 Impact: The First Month in Switzerland

Joseph Molloy, Christopher Tchervenkov, Beat Hintermann, Kay W. Axhausen,
covid-19coronaaccessibilitygps trackingmobility behaviourswitzerlandsars-cov-2
Copyright Logoccby-nc-4.0 • https://doi.org/10.32866/001c.12903
Photo by Josef Ivan Jimenea on Unsplash
Findings
Molloy, Joseph, Christopher Tchervenkov, Beat Hintermann, and Kay W. Axhausen. 2020. “Tracing the Sars-CoV-2 Impact: The First Month in Switzerland.” Findings, May. https:/​/​doi.org/​10.32866/​001c.12903.
Save article as...▾
Download all (4)
  • Figure 1: Weekly Person kilometres travelled by gender and study
    Download
  • Figure 2: Change in average kilometers travelled. Weekly observations with less than 5 participants removed.
    Download
  • Figure 3: Weekly change in person kilometres travelled by general accessibility quintiles
    Download
  • Figure 3: Weekly change in person kilometres travelled by general accessibility quintiles
    Download

Sorry, something went wrong. Please try again.

If this problem reoccurs, please contact Scholastica Support

Error message:

undefined

View more stats

Abstract

This note describes the changes in travel behaviour in response to the spread of the Sars-CoV-2 epidemic in Switzerland. The existing analyses of the Google or the national Intervisa data have limits due to missing socio-demographic details about their users. We briefly describe our GPS tracking panel and its sample. The analyses focus on the changes for different income groups and for the differences in accessibility.

It will be supplemented by the weekly
https://ivtmobis.ethz.ch/mobis/covid19/reports

Research question and hypothesis

This paper gives some first insights into the ability of the participants of different socio-economic groups to accommodate the massive restrictions in the transport supply and activity possibilities resulting from the special measures to limit the spread of the corona virus. On March 16th 2020 Switzerland implemented regulations closing all non-essential service and industrial facilities until further notice. The residents were asked for forgo all travel, except for essential work, medical care, or grocery shopping. Solitary or small-group exercise was not explicitly forbidden, but many public areas were closed by the local authorities to stop the congregation of larger groups. Public transport services were either suspended or massively reduced in frequency.

The speed of the doubling of the number of cases had fallen to 26 days by April 11th and to less then 1 percent per day by May 1st. The Federal government is reviewing the restrictions weekly, but a first easing was implemented on April 27th with more easing after May 11th.

While the federal government has access to unpublished GSM-based analyses on the movements of the residents, only the graphs published by Google[1] and the results of an on-going commercial tracking study undertaken by the local Intervista market research firm[2] are public.

The MOBIS-COVID study aims to trace and explain the changes and understand the differences between persons and locations. The hypothesis is that the mobility adjustments will vary between different socio-economic groups within the Swiss population. In particular, we focus on the impacts by income, gender and accessibility by home location.

Methods and data

A consortium consisting of researchers from ETH Zürich, University of Basel and the Zürcher Hochschule für Angewandte Wissenschaften (ZHAW) is conducting the MOBIS study: https://www.ivt.ethz.ch/en/research/mobis.html. In Autumn 2019 an eight week GPS-tracking study of 3700 persons was undertaken to assess the size of the behavioural impact of mobility pricing in Switzerland. We noted that about 250 of the 3700 participants voluntarily continued with the tracking after the MOBIS data collection was complete. In mid March we re-invited the remaining participants to reactivate the tracking app we had used Catch-my-Day developed by Motion-Tag, Berlin. A total of 1610 have re-installed the app and resumed tracking, as far as we can tell given the absence of movement of many of the participants. The app records all out-doors movements, divides the stream of GPS points into stages and trips, and imputes the travel modes. The respondents can verify the imputation and can add a trip purpose. We had encouraged the respondents to do so, but it was not obligatory.

The original sample had focused on persons who stated that they are using both cars and public transport for their daily travel. For the recruitment we limited ourselves to the French and German speaking parts of Switzerland, as the efforts involved in recruiting from the Italian speaking portion of the population (9%) was deemed disproportionate. Our sample generally matches the known socio-demographics of Switzerland, even without re-weighting. The daily and weekly counts have been normalised to account for the varying sample size as participants re-activated the tracking.

Findings

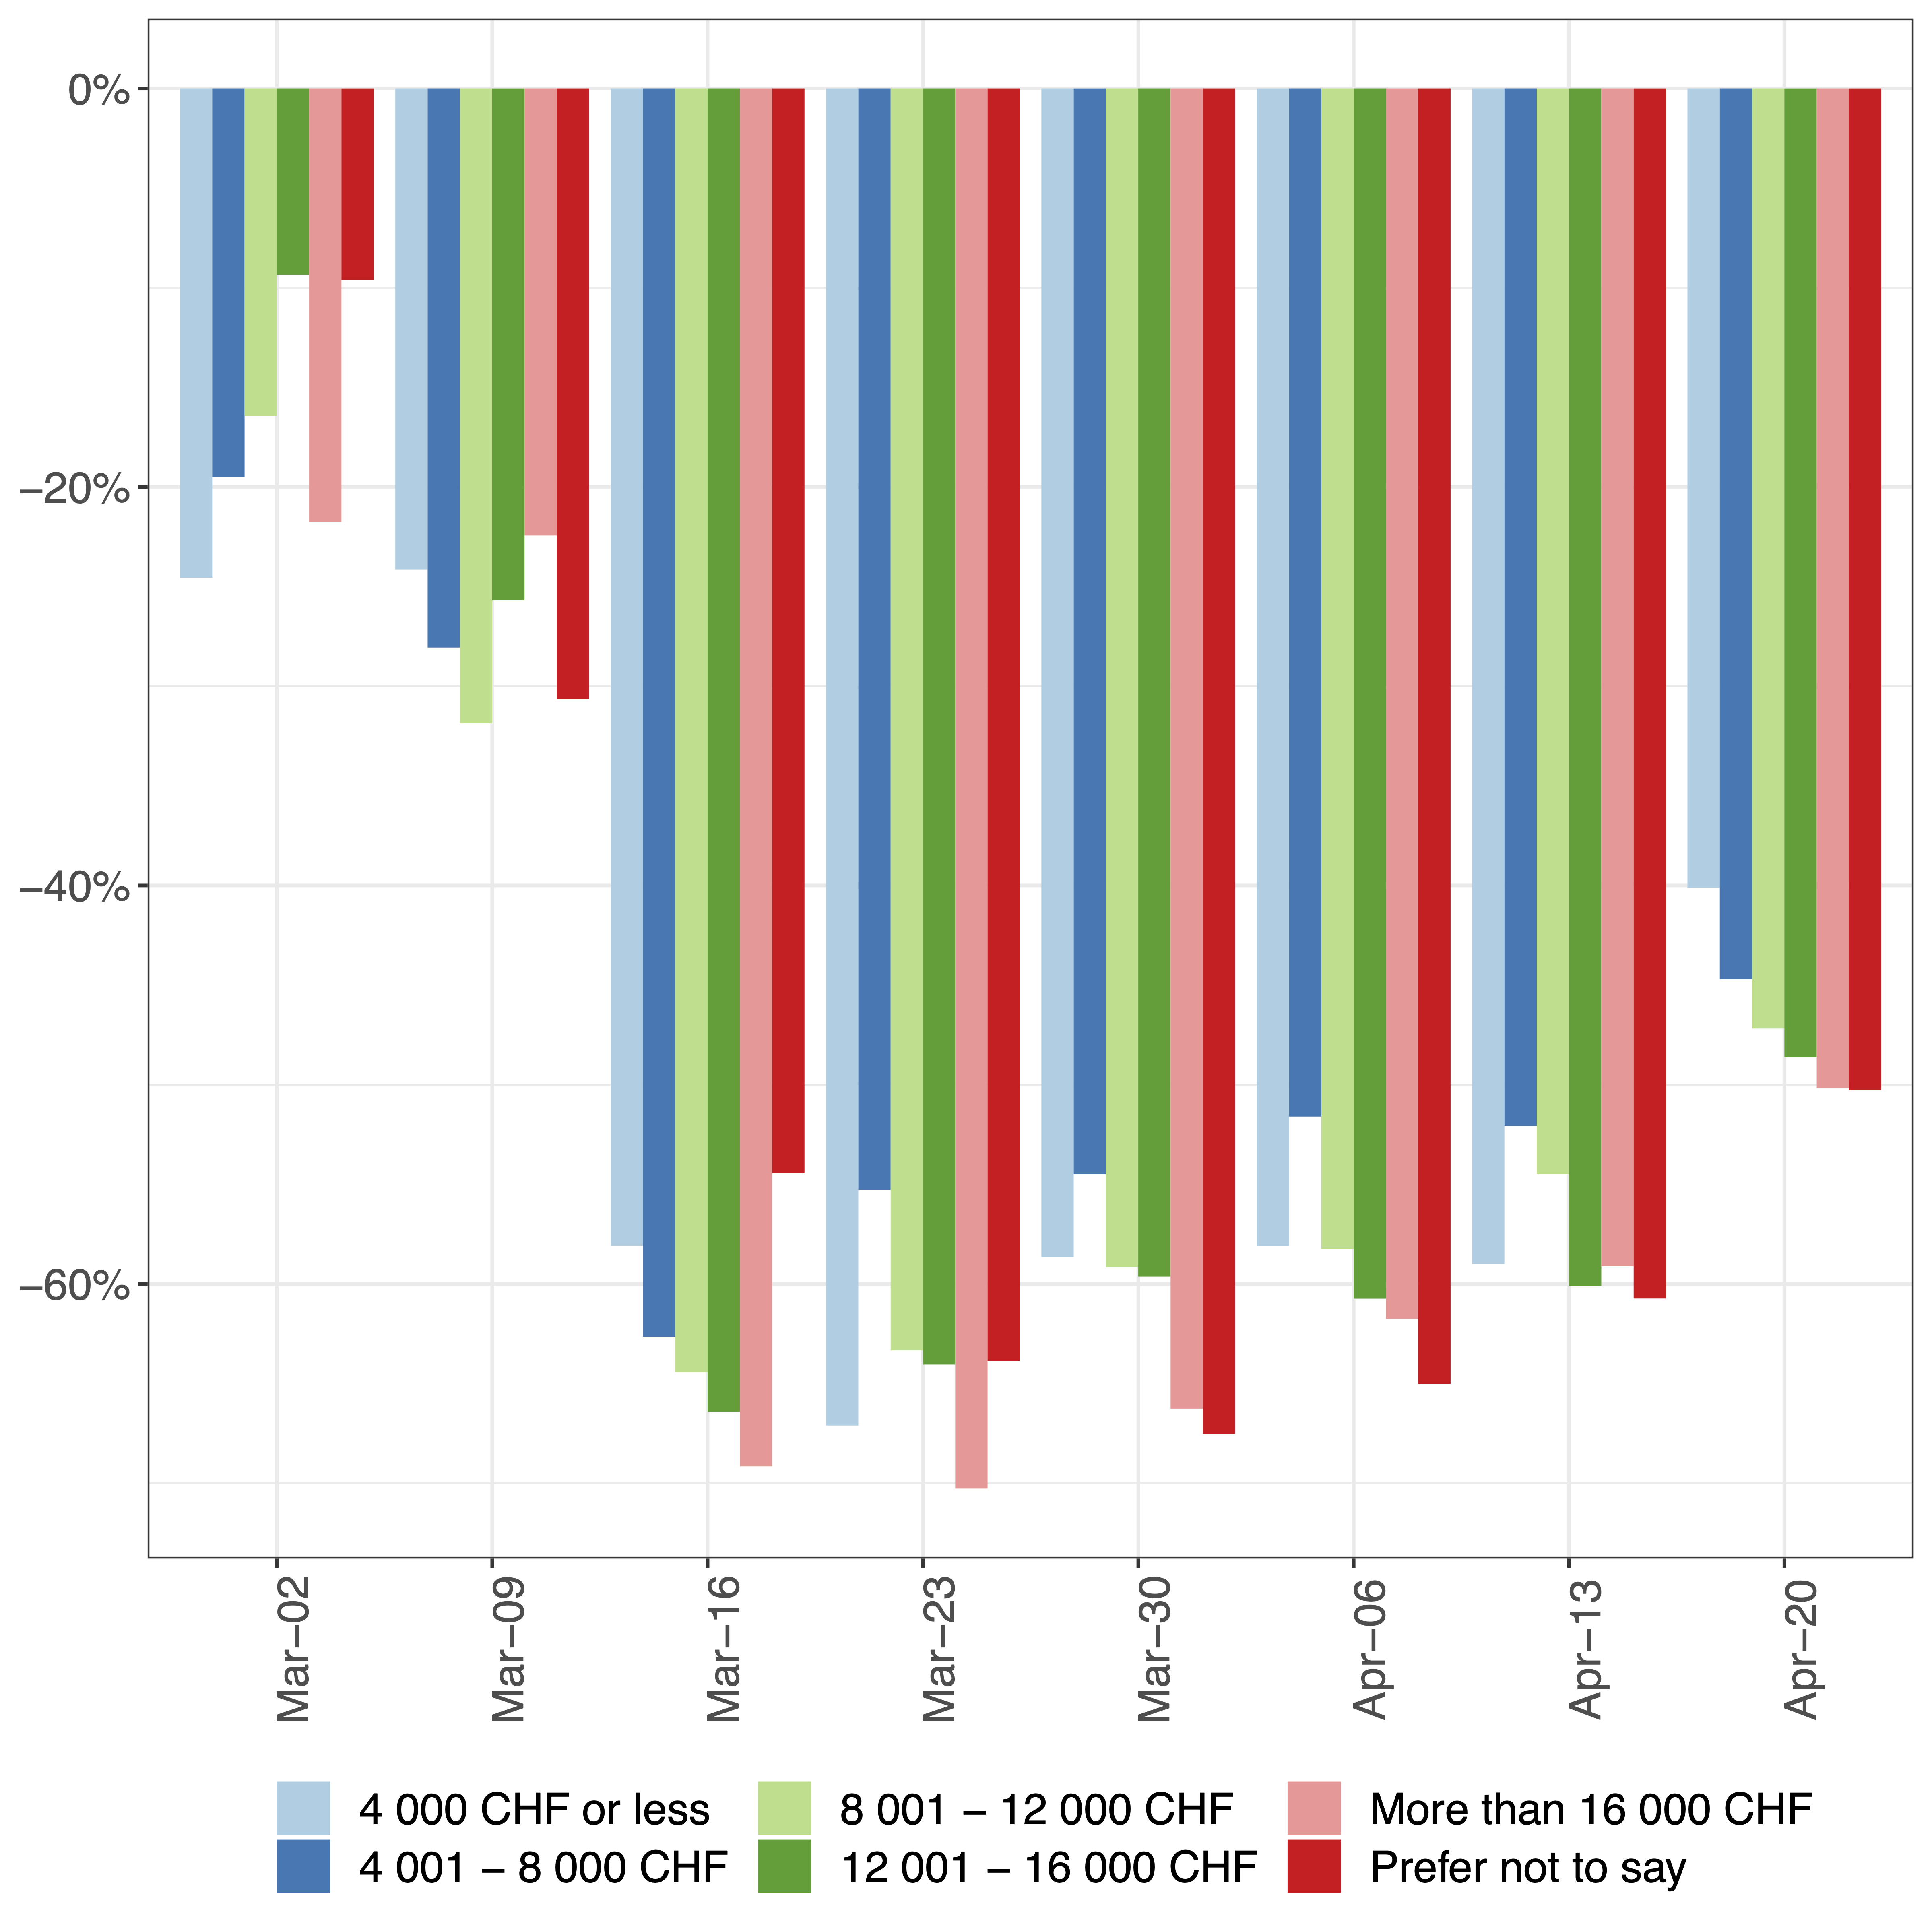
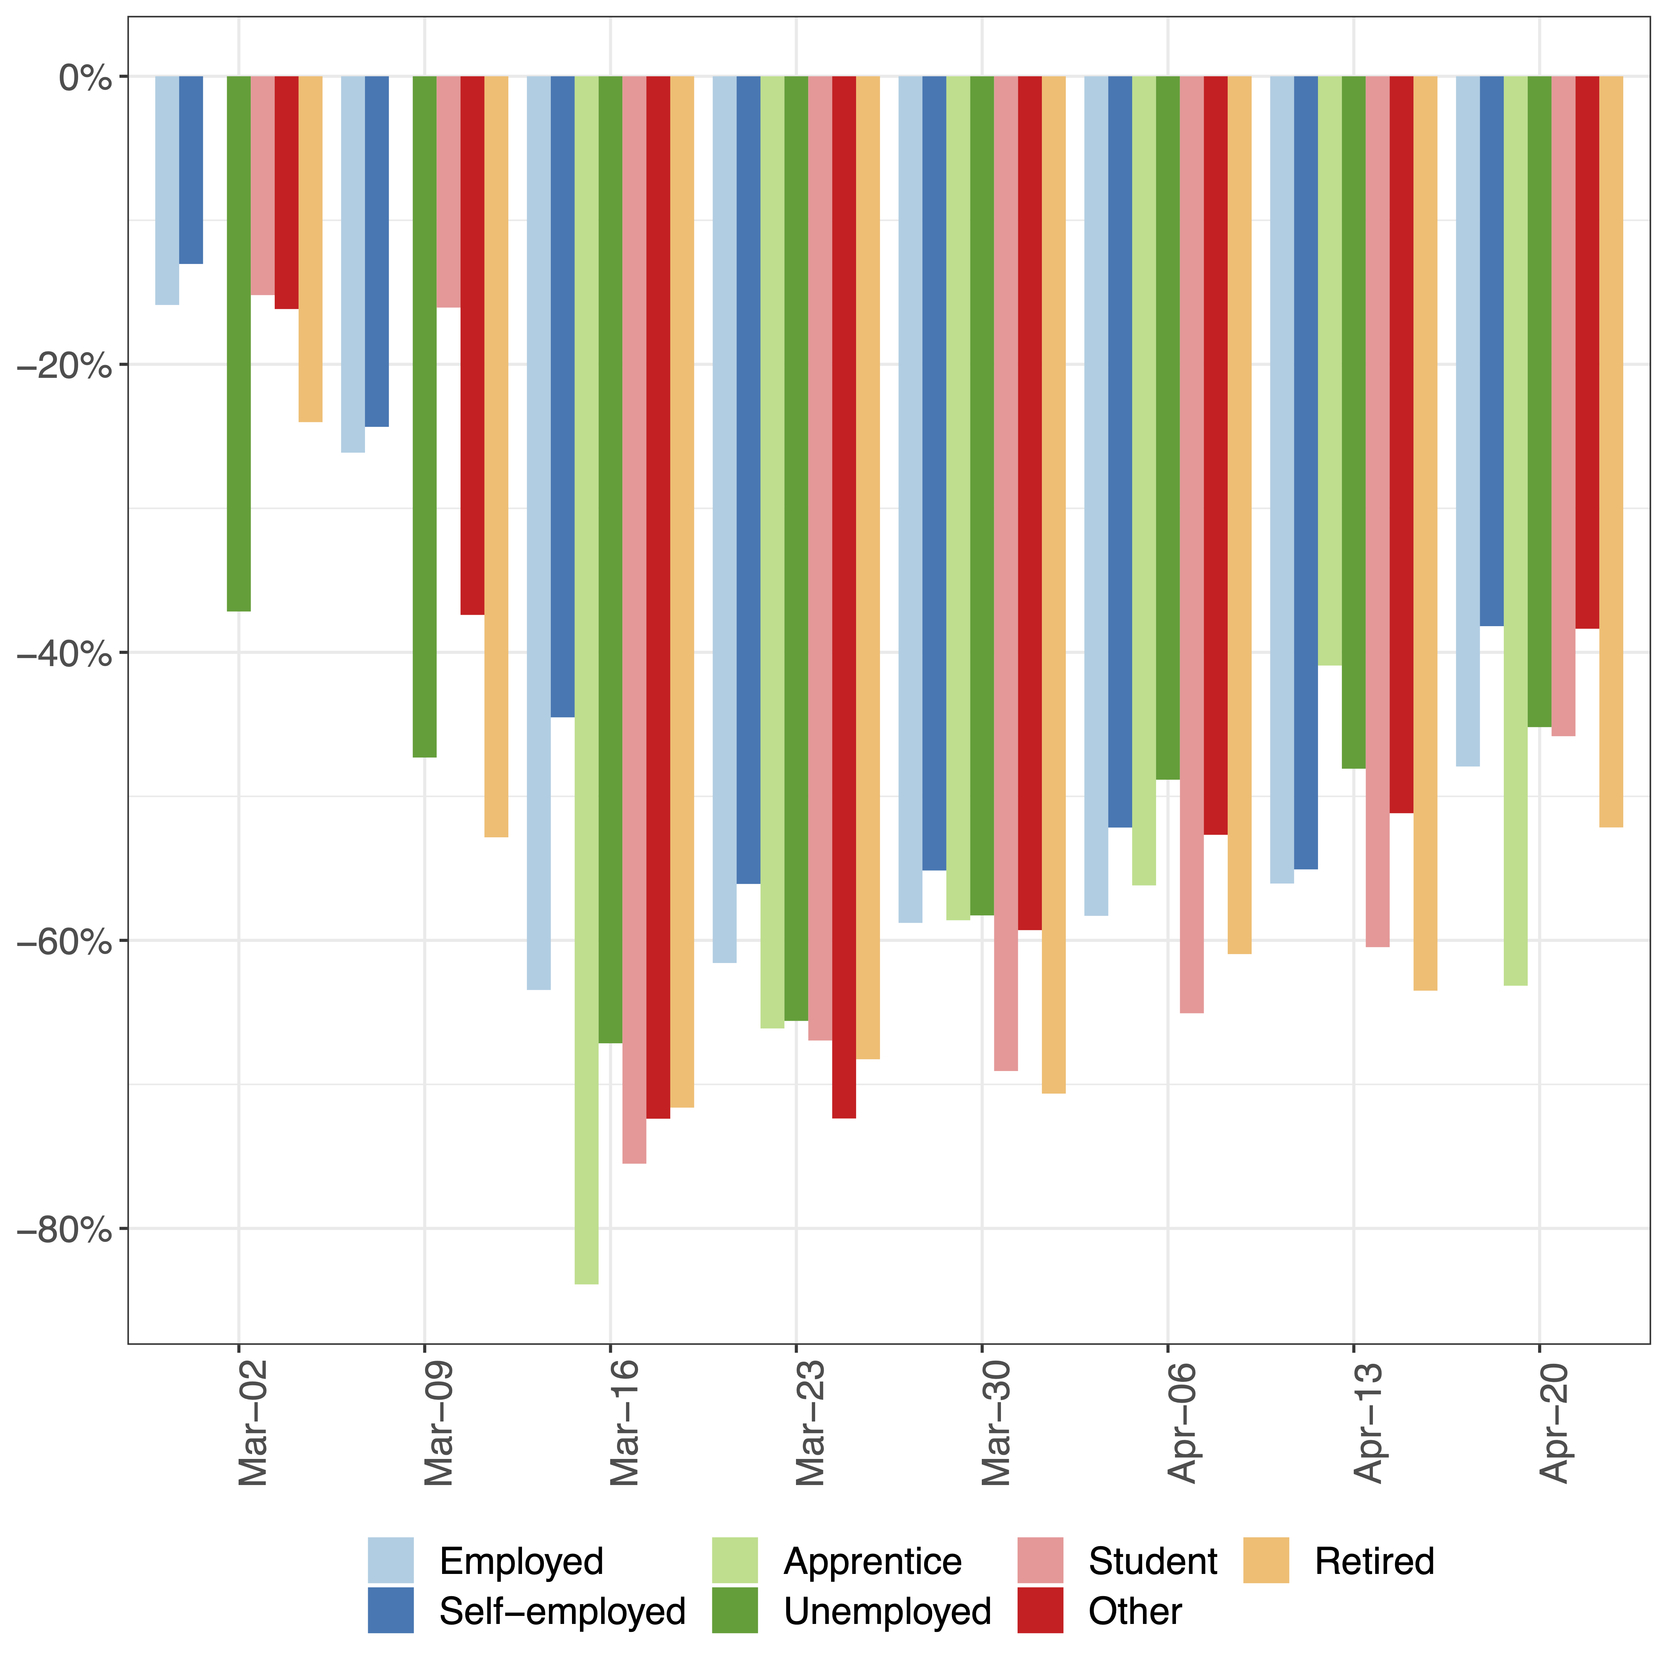
We present a first set of results highlighting some first insights from the data. The focus will be on the changes for participants by their income and by the basic accessibility of their home locations. Table 1 compares our sample with socio-demographics of the last national travel diary in 2015, but note in particular the difference between the studies with regards to the employment status, i.e. being employed, in an apprenticeship or being self-employed.

Table 1:Comparison with the last national travel diary Mikrozensus (MZ) 2015
N %
Variable Value MOBIS MZ MOBIS MZ
Access to car No 13 2,587 0.8 6.2
Yes 1,480 31,824 90.4 75.8
Sometimes 144 7,584 8.8 18.1
Age under 18 - 7,546 - 13.2
(18,25] 259 5,126 16.9 9.0
(25,35] 272 8,117 17.7 14.2
(35,45] 314 8,789 20.4 15.4
(45,55] 359 9,560 23.4 16.7
(55,65] 333 7,384 21.7 12.9
66+ - 10,568 - 18.5
Language de 1,191 39,023 72.8 68.4
fr 446 14,450 27.2 25.3
Italian - 3,617 - 6.3
Education Mandatory 96 9,954 5.9 19.3
Secondary 758 25,594 46.3 49.5
Higer Ed. 783 16,124 47.8 31.2
Gender female 828 28,928 50.6 50.7
male 809 28,162 49.4 49.3
Household Size 1 209 19,439 12.8 34.0
2 546 20,222 33.4 35.4
3 331 7,400 20.2 13.0
4 417 7,133 25.5 12.5
5 or more 134 2,897 8.2 5.1
Monthly Income 4 000 CHF or less 92 10,139 5.6 17.8
4 001 - 8 000 CHF 470 18,728 28.7 32.8
8 001 - 12 000 CHF 495 9,945 30.3 17.4
12 001 - 16 000 CHF 267 3,878 16.3 6.8
More than 16 000 CHF 168 2,593 10.3 4.5
Prefer not to say 143 11,807 8.7 20.7
Employment Status Employed 1,196 27,521 73.1 48.2
Self-employed 111 4,133 6.8 7.2
Apprentice 10 1,488 0.6 2.6
Unemployed 59 1,423 3.6 2.5
Student 83 2,114 5.1 3.7
Other 110 9,421 6.7 16.5
Retired 68 10,990 4.2 19.3
Nationality Other 120 13,743 7.3 24.1
Switzerland 1,517 43,347 92.7 75.9

Source: For the Mikrozensus 2015 see Federal Office of Statistics (2017)

The comparison with the population representative Intervista panel in Fig. 1 shows that our panel matches it in its response. In advance of the lock-down the distance travelled was decreasing, but the effect of its imposition is clearly visible in that week. In the following weeks travel rebounds with a dip for the Easter weekend. Males continue to travel more than the females in both studies. The differences between the studies become much smaller under the constrained conditions.

Figure 1
Figure 1:Weekly Person kilometres travelled by gender and study

Source: Including data from Intervista AG (2020)

The general level of accessibility of the home location influences the total kilometers travelled and the reductions observed during the lockdown, as seen in Fig. 3. In the before period we see clear differences by accesibility-quintiles of the home locations, which become less pronounced in the restricted period.

Figure 2
Figure 2:Change in average kilometers travelled. Weekly observations with less than 5 participants removed.

(a) by employment status

Figure 3
Figure 3:Weekly change in person kilometres travelled by general accessibility quintiles

(b) by monthly income

Figure 3
Figure 3:Weekly change in person kilometres travelled by general accessibility quintiles

Source: The general accessibility values are the main factor of a factor analysis of car and transit accessibilities for both employment and population by municipality or district with the larger cities (See Loder and Axhausen (2018))

The activity space is a convenient summary measure of the range and scope of the activities of the persons (See Schönfelder and Axhausen (2010)). These collapse together with the number of trips per days, but more so. The number of trips per workday shrink to 60% of their previous about 5 trips per day, and the activity spaces to 20% of their previous size, as seen in Table 2. Trip duration remains relatively constant except for bicycle use, with difference between genders (Table 3). Striking is the increase in bicycle use. We have compared the trend against the numbers of last national travel diary and see that this increase is above and beyond the usual increase in spring time. Further analysis, not shown here, reveals that the increase is due to weekend afternoon use, suggesting a clear sporting, fitness, leisure motivation.

Table 2:Weekly Change in the size of median activity space (ha) by type of day and age class
Age Mar-02 Mar-09 Mar-16 Mar-23 Mar-30 Apr-06 Apr-13 Apr-20
(18,25] Weekday 35.9 48.1 6.9 2.6 3.0 5.7 7.9 10.6
Weekend 5.8 9.8 0.6 0.9 0.8 1.2 1.3 2.4
(25,35] Weekday 85.2 42.6 2.3 4.9 4.6 7.4 6.1 10.5
Weekend 14.5 3.3 0.4 0.6 1.3 2.3 1.8 2.6
(35,45] Weekday 36.4 75.0 6.8 3.3 7.6 8.2 10.8 11.3
Weekend 29.9 20.5 0.4 1.6 0.8 1.4 1.5 4.2
(45,55] Weekday 40.5 53.8 4.0 3.1 4.4 7.0 5.2 10.0
Weekend 13.3 7.0 0.7 1.2 1.6 1.6 2.3 4.0
(55,65] Weekday 64.0 46.4 7.3 2.8 5.8 5.1 7.1 8.6
Weekend 9.1 8.7 0.1 1.2 1.1 1.2 3.8 3.1
Table 3:Median trip duration by gender and mode in minutes
Mode Gender Mar-02 Mar-09 Mar-16 Mar-23 Mar-30 Apr-06 Apr-13 Apr-20
Bicycle Female 15 16 14 19 27 31 39 27
Male 14 15 25 24 28 36 33 30
Bus Female 7 8 4 5 6 5 6 5
Male 8 9 7 7 6 7 7 6
Car Female 41 38 36 36 36 37 36 38
Male 47 42 34 34 35 35 35 35
Train Female 31 35 19 28 28 16 18 29
Male 25 33 12 26 23 19 25 23
Tram Female 13 16 8 14 14 9 7 12
Male 20 17 12 11 13 12 11 12
Walk Female 22 21 19 18 21 21 21 19
Male 20 20 16 18 20 21 21 19

Source: Note that we employ the mode imputation as offered by the app, which has only been validated by a subset of the participants

Formal modelling of these behaviours, especially to see if there is a change in the preference structures, will begin with the end of the restrictions. It will be interesting to see, firstly, how different socio-economic groups respond, and if this shock is able to break routines or if they will reassert themselves again.

Acknowledgements

We are grateful for the willingness of the 1610 volunteers who continue to track themselves allowing us to understand in detail the impact of the Sars-CoV-2 crisis on Swiss travel behaviour. This work is a spin-off of the MOBIS project funded by SCEER and the Swiss Federal Office of Roads, which also provided some extra funding for this unexpected continuation for which we are especially thankful. The results and their interpretations are our own.

The contribution of the full MOBIS team is very much appreciated. The reviewers’ comments helped to improve the paper substantially. All remaining errors are our own.


  1. https://www.google.com/covid19/mobility/

  2. published together with other statistics by the Kanton Zürich (https://statistik.zh.ch/internet/justiz_inneres/statistik/de/covid19.html

References

Federal Office of Statistics. 2017. Verkehrsverhalten Der Bevölkerung. Ergebnisse Des Mikrozensus Mobilität Und Verkehr 2015 [Mobility Behaviour of the Population. Results of the Microcensus Mobility and Transport 2015]. Neuchâtel: Bundesamt für Statistik.
Google Scholar
Intervista AG. 2020. “Mobilitäts-Monitoring Covid-19, Online Report Published by Statistical Office of Kanton.” Zürich, Zürich. https:/​/​statistik.zh.ch/​internet/​justiz_inneres/​statistik/​de/​aktuell/​mitteilungen/​2020/​covid_mobilitaetsverhalten.html.
Loder, Allister, and Kay Werner Axhausen. 2018. “Mobility Tools and Use: Accessibility’s Role in Switzerland.” Journal of Transport and Land Use 11 (1). https:/​/​doi.org/​10.5198/​jtlu.2018.1054.
Google Scholar
Schönfelder, S., and K.W. Axhausen. 2010. Urban Rhythms and Travel Behaviour: Spatial and Temporal Phenomena of Daily Travel. Ashgate Publishing, Ltd.
Google Scholar

This website uses cookies

We use cookies to enhance your experience and support COUNTER Metrics for transparent reporting of readership statistics. Cookie data is not sold to third parties or used for marketing purposes.

Powered by Scholastica, the modern academic journal management system