Loading [Contrib]/a11y/accessibility-menu.js
Findings
  • Menu
  • Articles
    • Resilience Findings
    • Transport Findings
    • Urban Findings
    • All
  • For Authors
  • Editorial Board
  • About
  • Blog
  • search

    Sorry, something went wrong. Please try your search again.
    ×

    • Articles
    • Blog posts

RSS Feed

Enter the URL below into your favorite RSS reader.

https://findingspress.org/feed
×
Transport Findings
May 20, 2020 AEST

Comparison of the Person Flow on Cycle Tracks vs Lanes for Motorized Vehicles

Yerko Calquin, Alejandro Tirachini,
cycling road space traffic flow right-of-way cycle tracks
Copyright Logoccby-nc-4.0 • https://doi.org/10.32866/001c.12874
Findings
Calquin, Yerko, and Alejandro Tirachini. 2020. “Comparison of the Person Flow on Cycle Tracks vs Lanes for Motorized Vehicles.” Findings, May. https://doi.org/10.32866/001c.12874.
Save article as...▾
  • PDF
  • XML
  • Citation (BibTeX)
Data Sets/Files (8)
Download all (8)
  • Table 1: Description of the counting locations. MV: motor vehicles
    Download
  • Figure 1a: On-street cycle track Eleuterio Ramirez
    Download
  • Figure 1b: On-street cycle track Rosas
    Download
  • Figure 1c: Off-street cycle track Andrés Bello
    Download
  • Table 2: Person flow in bicycles and motor vehicles
    Download
  • Table 3: Person flow in bicycles and motor vehicles, divided by the width of lanes (meters).
    Download
  • Figure 2a: Ratio of person flow in bicycles to person flow in motor vehicles (Q indexes) and ratio of person flow in bicycles to person flow in motor vehicles per lane width (F indexes)
    Download
  • Figure 2b: Ratio of person flow in bicycles to person flow in motor vehicles (Q indexes) and ratio of person flow in bicycles to person flow in motor vehicles per lane width (F indexes)
    Download

Sorry, something went wrong. Please try again.

If this problem reoccurs, please contact Scholastica Support

Error message:

undefined
×

View more stats

Abstract

We compare the person flow on cycle tracks and lanes for motorized traffic on seven streets in Santiago, Chile. In peak periods, we find that most streets have a higher person flow rate per lane using motor vehicles than riding bicycles. However, when the consumption of road space is considered, the conclusion is reversed as most cycle tracks achieve a greater person flow per meter of width than the lanes for motor vehicles in the same street. An analysis of transport capacity for car and cycle lanes provides results in line with our empirical findings.

RESEARCH QUESTION AND HYPOTHESIS

Cycling improves riders’ health and counteracts traffic externalities such as congestion and pollution. City authorities are, therefore, actively seeking ways to increase bicycle use in cities. Even though well-designed cycle tracks enhance riders’ comfort (Blanc and Figliozzi 2016) and safety (Rossetti et al. 2018; Ling et al. 2020), the provision of cycling infrastructure remains a complex issue given the limited road space available in cities. Because of this, it is common for planners to design new cycle lanes that occupy space previously allocated to car traffic, parking, and sidewalks. In this paper, we analyze the intensity of cycle lane use by comparing the person flow in cycle lanes with the person flow in the adjacent motor vehicle lanes. The objective is to provide empirical evidence to ascertain the efficiency of the use of road space. This is achieved by determining whether cycle lanes are used by a greater number of travelers than the lanes for motor vehicles, first in absolute numbers (flow), and then as a function of the road space (width) allocated to lanes for bicycles and motorized traffic. A variable that measures the flow per unit of road width is used, in line with the flux concept proposed by Levinson et al. (2017). Simple as it is, such a comparison is usually missing in the assessment of cycle lanes after they are introduced on roads.

METHODS AND DATA

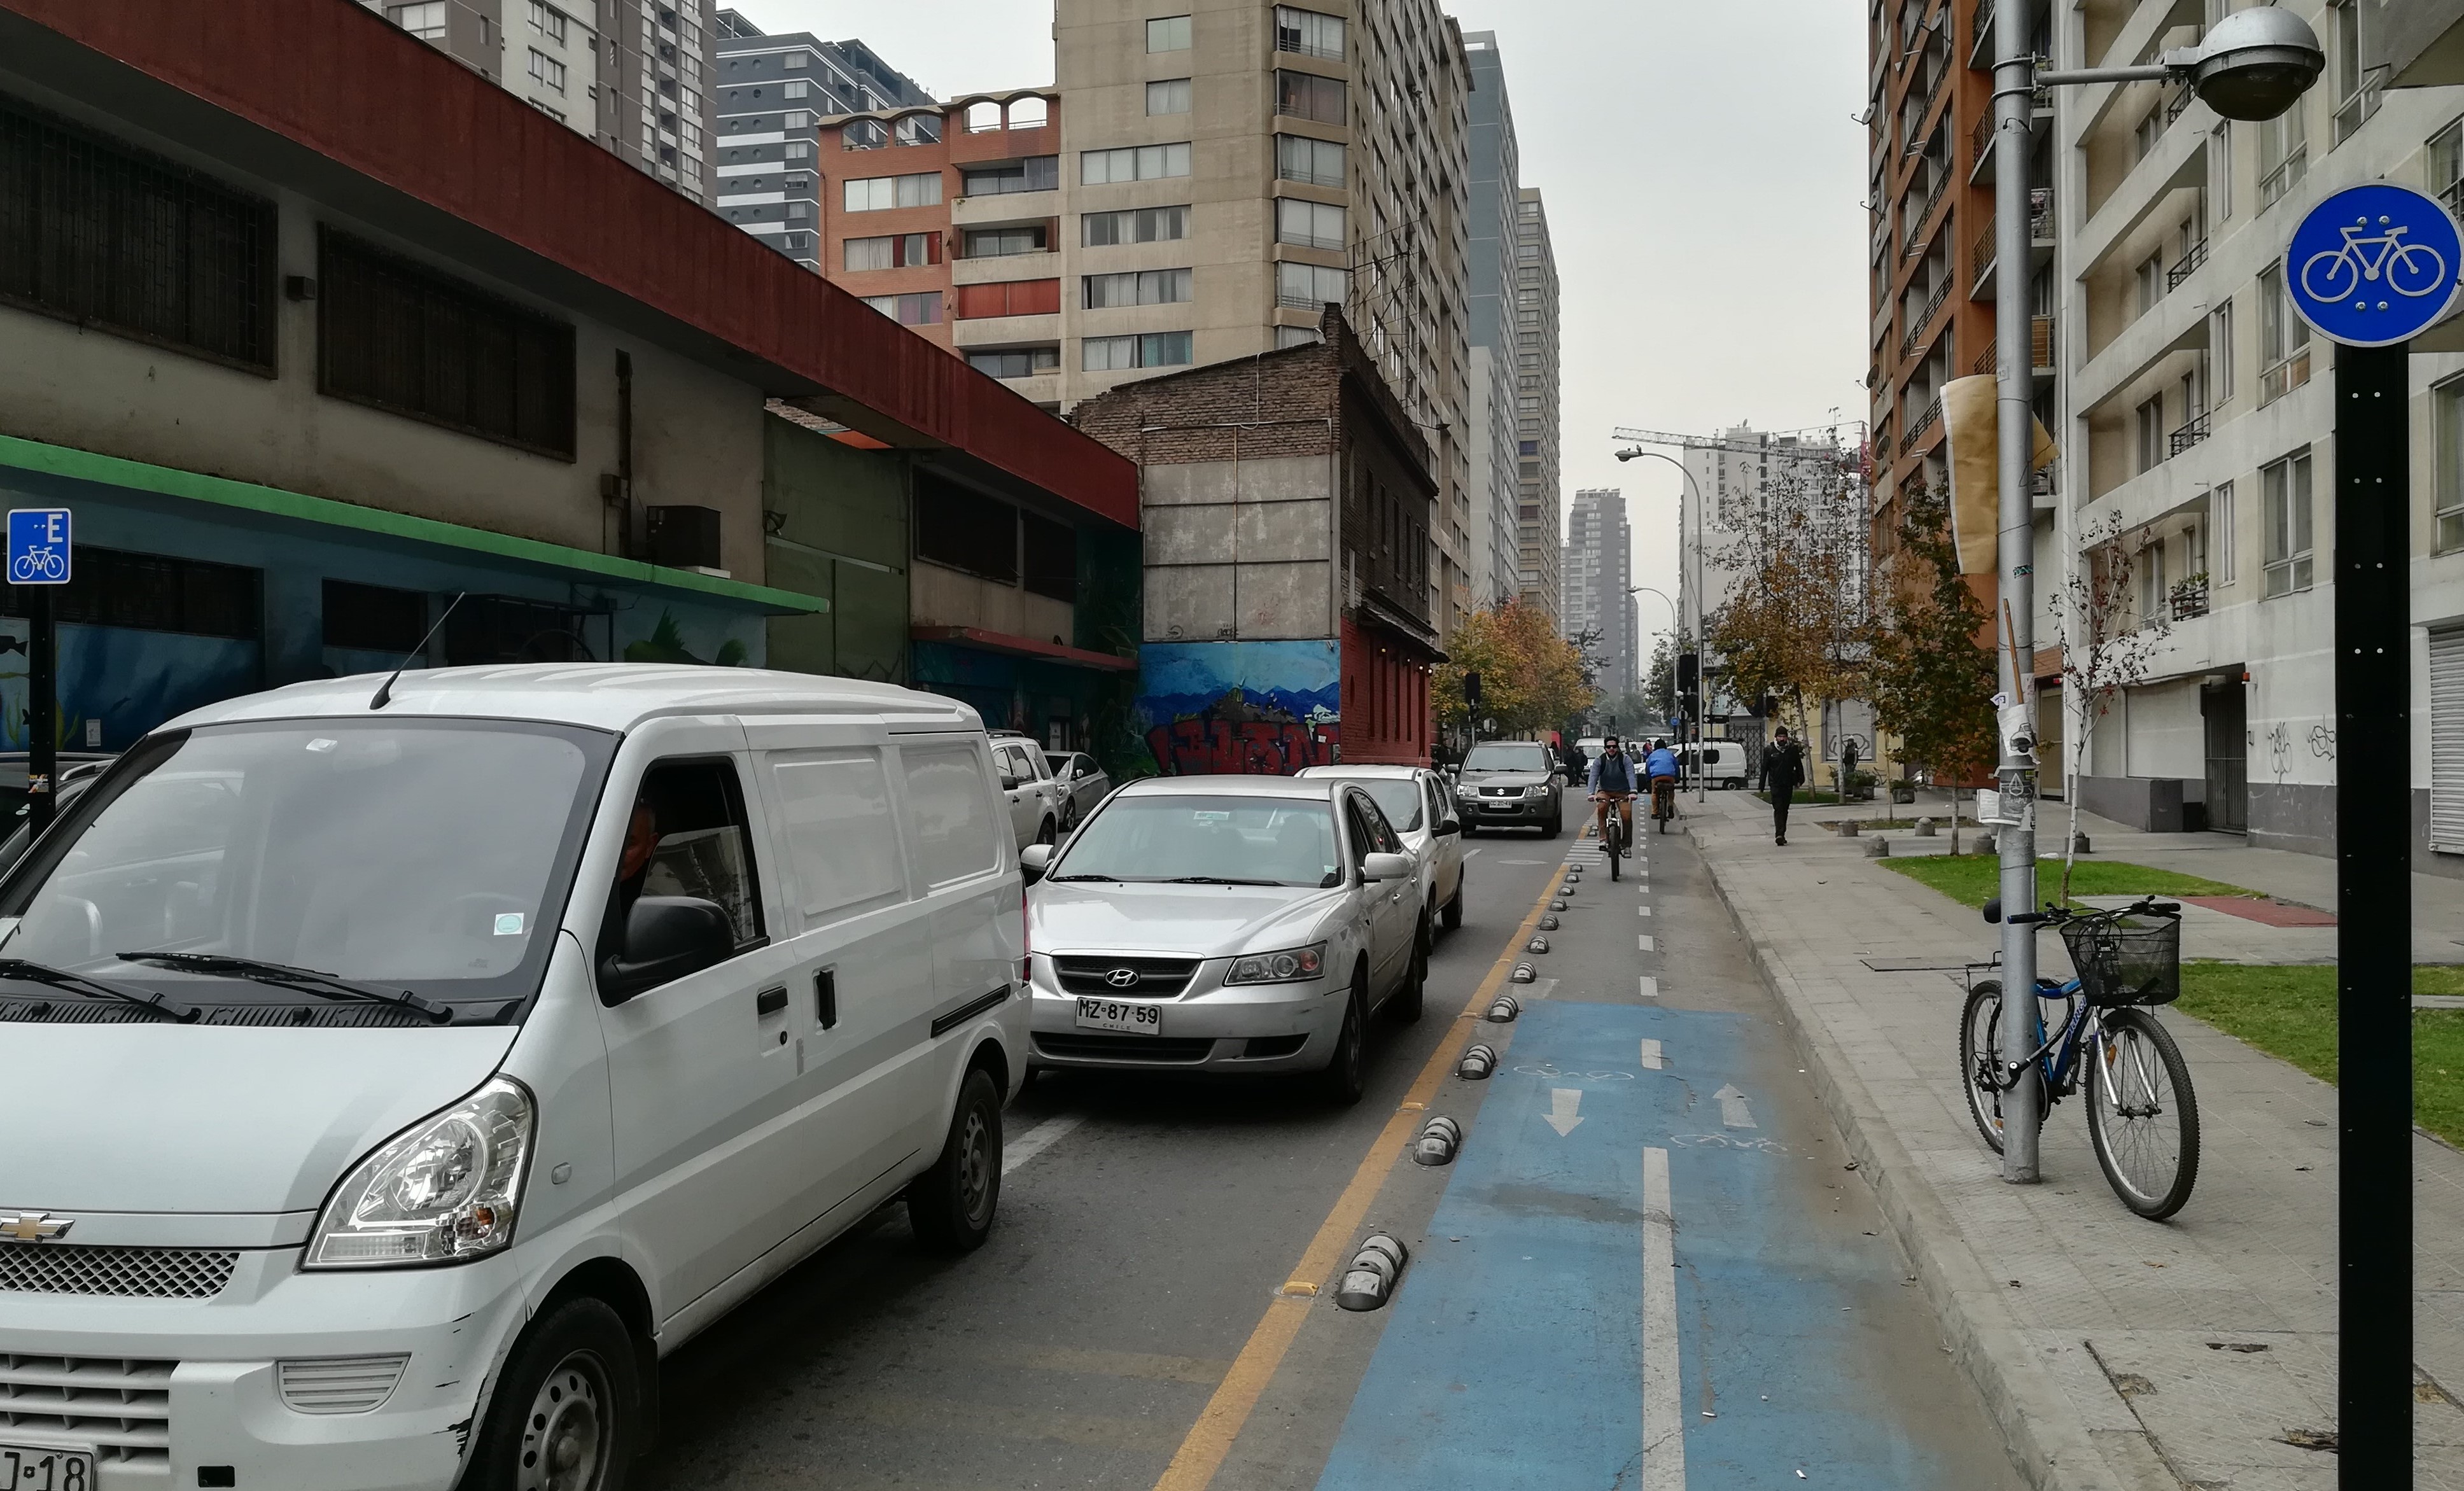
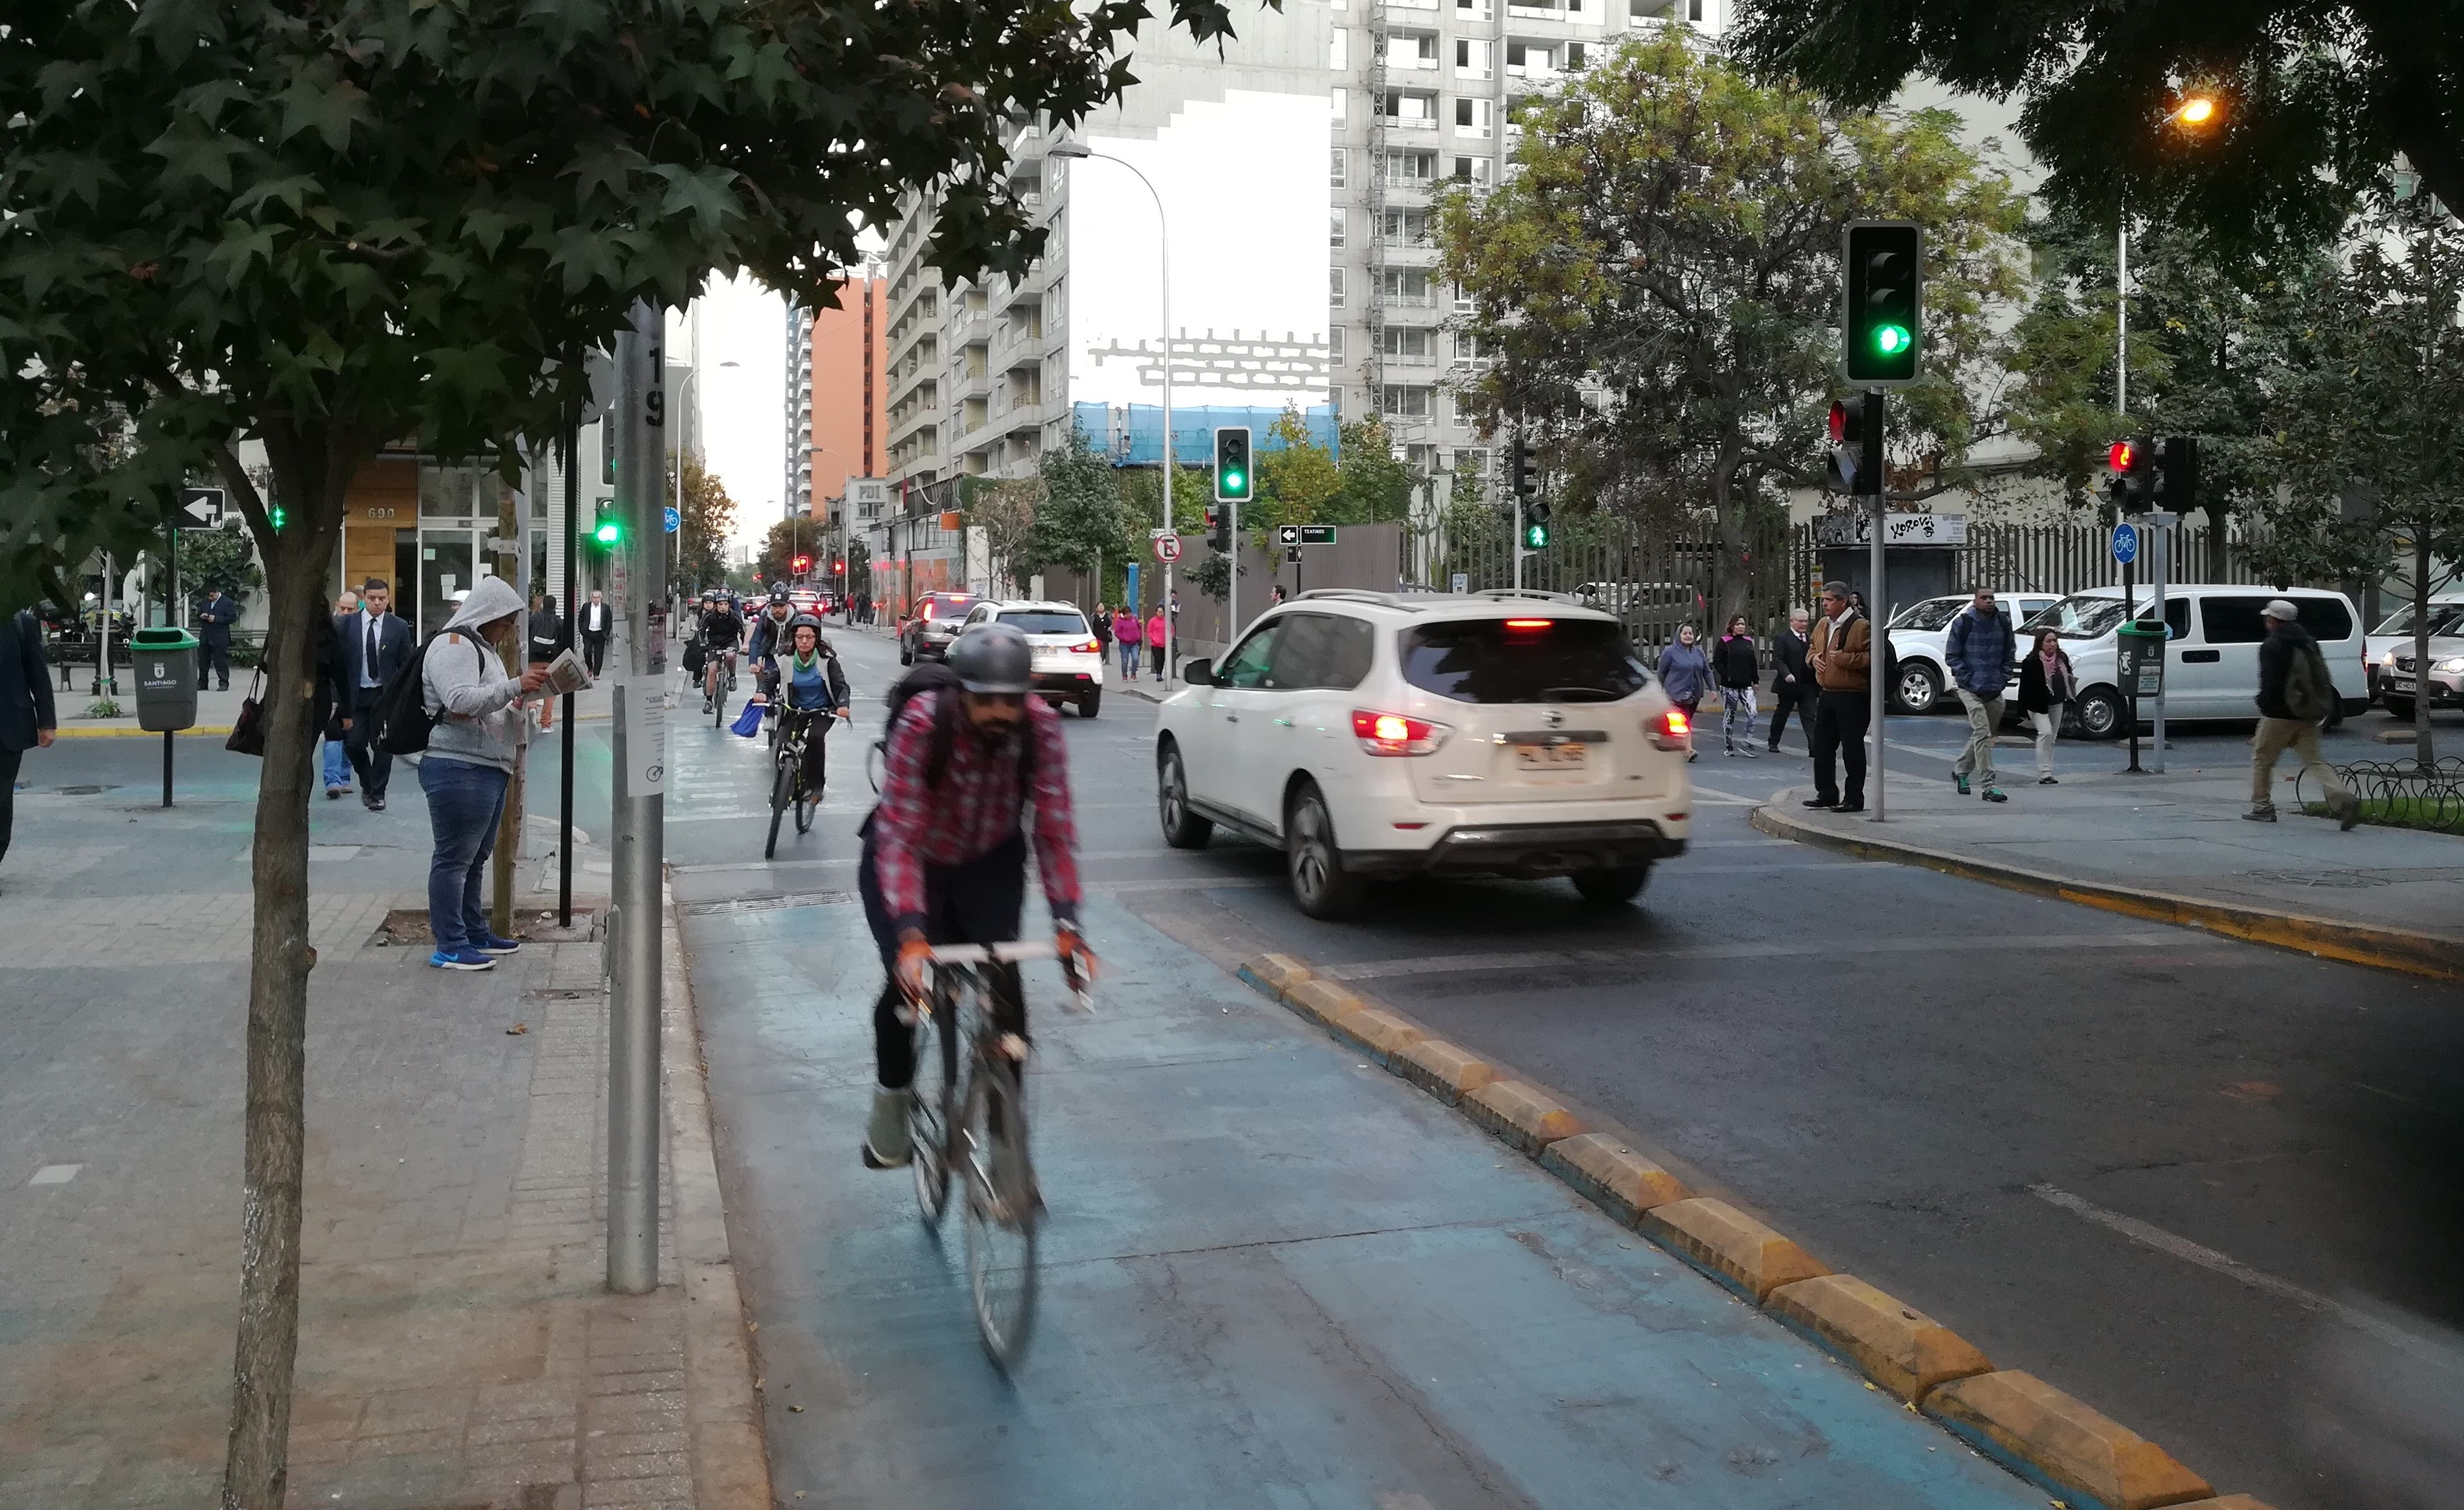
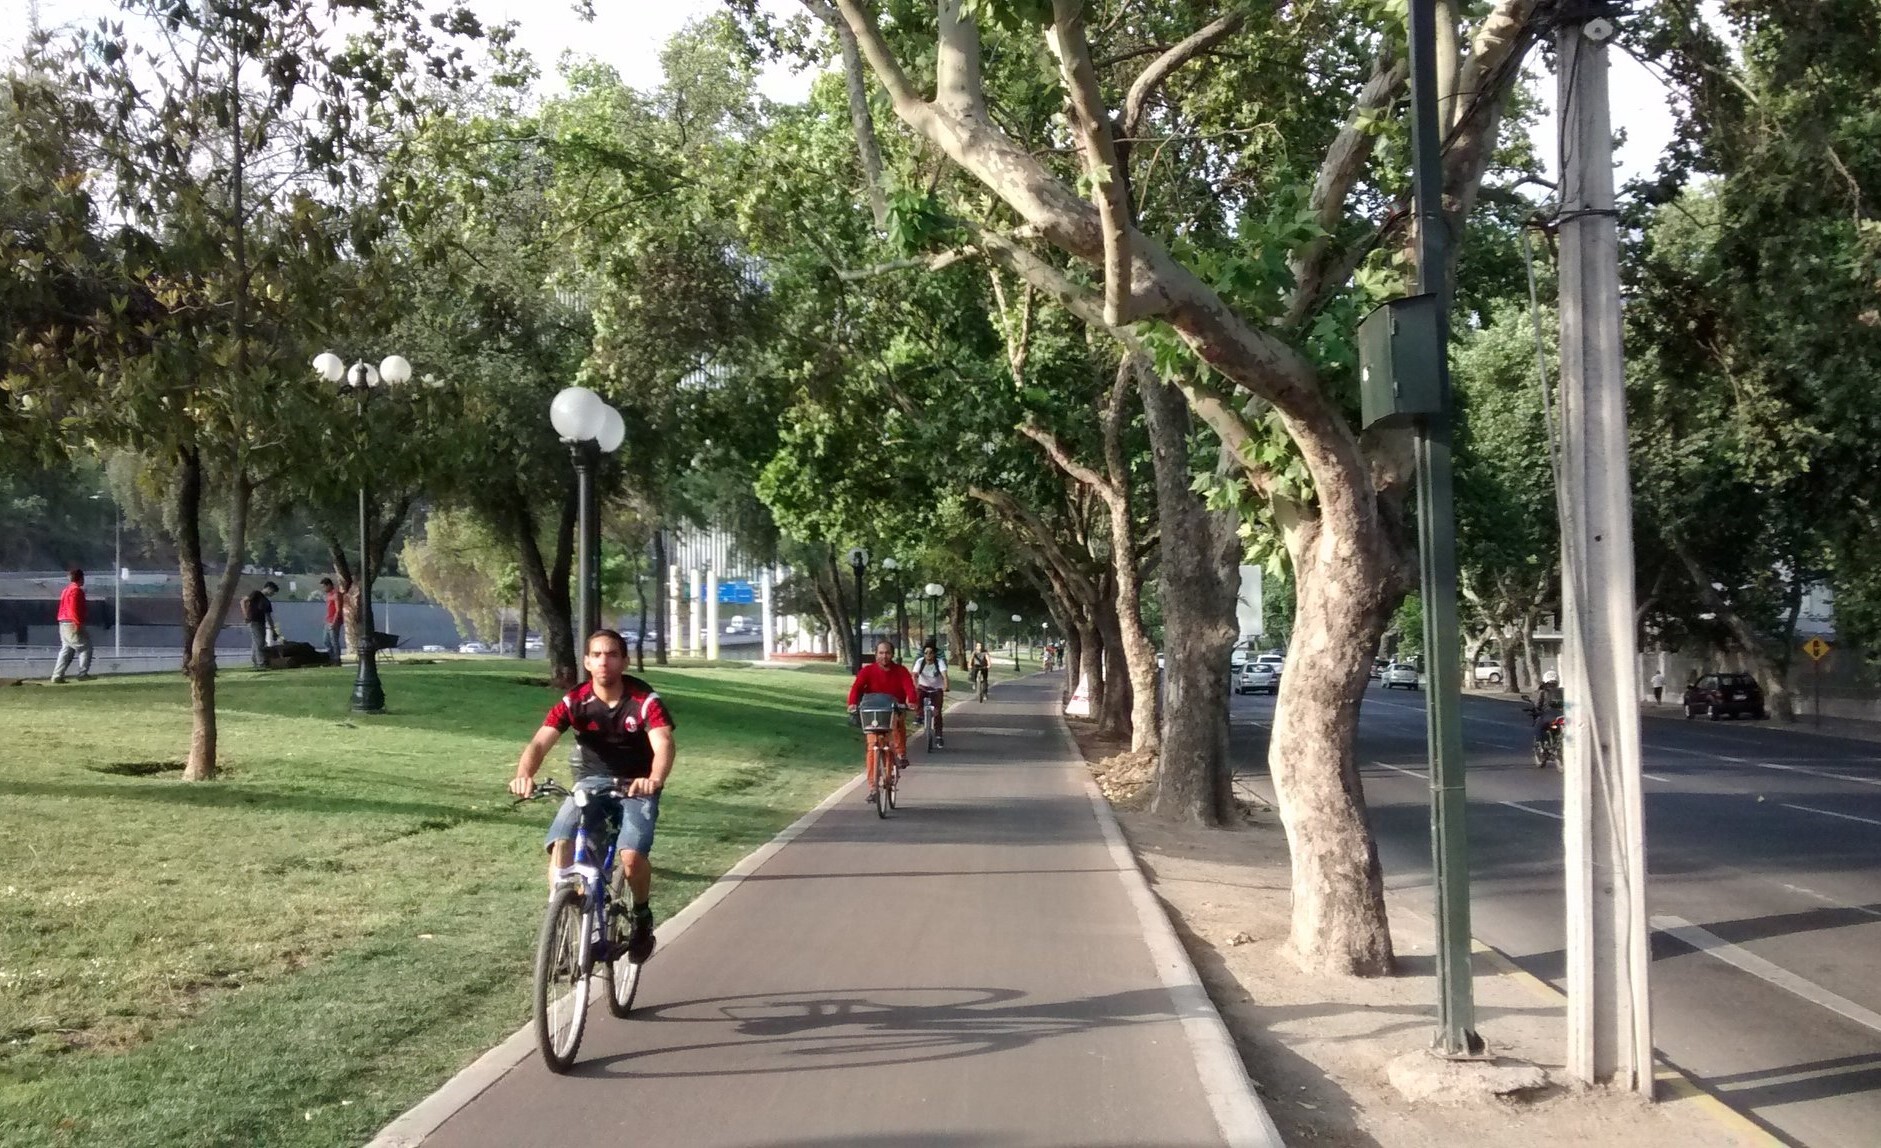
The study is carried out in seven streets that have exclusive cycle tracks in Santiago, Chile. Travelers on bicycles and inside motor vehicles are counted, either during the morning peak period (8 AM to 10 AM) or during the afternoon peak period (5:30 PM to 8:00 PM). Only one location per street is observed. In three cases, the sites observed are at the intersection of two cycle tracks. The fourth site is on Andrés Bello Avenue, which is likely to have the highest bicycle flow rate in the city. Though the site selection is arbitrary, the aim is to represent a variety of situations including newer cycle tracks (no more than two years old, such as Arturo Prat and Eleuterio Ramírez), more mature cycle tracks (between three and five years old, such as Rosas, Teatinos and Ricardo Lyon), and older cycle tracks (more than five years old, such as Pocuro and Andrés Bello). Five of the cycle tracks are on-street; Pocuro and Andrés Bello are off-street. All streets are one-way for motor vehicles, whereas all cycle tracks are bidirectional. There is no public transport on the streets selected. The description of each site is shown in Table 1, and three cycle tracks (two on-street and one off-street) are shown in Figure 1: Eleuterio Ramírez (top), Rosas (middle) and Andrés Bello (bottom).

Table 1:Description of the counting locations. MV: motor vehicles
Street Intersection Municipality Number of MV lanes MV road width (m) Cycling lane width (m) Measurement period Days of data collection
Eleuterio Ramírez Arturo Prat Santiago 1 4.5 1.6 8:00 - 10:00 h 3, 4, 5 April 2017
Arturo Prat Eleuterio Ramírez Santiago 2 5.3 2.0 8:00 - 10:00 h 3, 4, 5 April 2017
Rosas Teatinos Santiago 1 4.5 2.4 17:30 - 20:00 h 17, 18, 24 April 2017
Teatinos Rosas Santiago 2 6 2.4 17:30 - 20:00 h 17, 18, 24 April 2017
Pocuro Ricardo Lyon Providencia 2 6 2.0 8:00 - 10:00 h 4, 10, 11 April 2017
Ricardo Lyon Pocuro Providencia 2 5.8 2.6 8:00 - 10:00 h 4, 10, 11 April 2017
Andrés Bello Pedro de Valdivia Providencia 7 21 2.6 17:30 - 20:00 h 4, 10, 11 April 2017
Figure 1a
Figure 1a:On-street cycle track Eleuterio Ramirez
Figure 1b
Figure 1b:On-street cycle track Rosas
Figure 1c
Figure 1c:Off-street cycle track Andrés Bello

The data is drawn from on-field measurements recorded by a single observer with a video camera. The counting of passengers inside motor vehicles is done in real-time by the observer, while cyclists are counted using the recorded videos. The data collection took place over three working days at each point; thus, there are 6 hours of recording for morning peak locations and 7.5 hours for afternoon peak locations, as detailed in Table 1. The flow of motor vehicles is represented per lane. The weather conditions during the data collection were mild (around 20°C) with no rain.

We calculate the person flow (\(q_{i}\)) and the person flow per meter (m) of road width \(f_{i}\), for motor vehicles (\(i = a\)) and bicycles (\(i = b\)), for flows aggregated every 30 minutes (0.5h). Based on these indicators, we built the following ratios to compare the flows of bicycles vs. motor vehicles:

\[Q = \frac{q_{b}}{q_{a}} = \frac{cycle\ lane\ flow\ \left\lbrack pax/(0.5h) \right\rbrack}{motorized\ vehicles\ flow\ \left\lbrack pax/(0.5h) \right\rbrack}\ (1)\]

\[F = \frac{f_{b}}{f_{a}} = \frac{cycle\ lane\ flow\ per\ lane\ width\ \left\lbrack pax/(0.5h)/m\right\rbrack} {motorized\ vehicles\ flow\ per\ lane\ width\ \left\lbrack pax/(0.5h)/m \right\rbrack}\ (2)\]

FINDINGS

The measurements of person flow are presented in Tables 2 and 3. Because cycle tracks are bidirectional and motorized traffic is unidirectional in all cases, we calculate bicycle flow in the same direction as motor vehicles (b1), counterflow (b2), and total (btot). Figure 2 presents the calculation of indices \(Q\) and \(F\) for motor vehicles relative to bicycles running in the same direction as motor vehicles (indices \(Q_{1}\) and \(F_{1})\) and total (in both directions, indices \(Q_{\text{tot}}\) and \(F_{\text{tot}}\)).

Table 2:Person flow in bicycles and motor vehicles
Street Period Persons in motor vehicles (qa) Bicycle riders in cycle lanes
Same direction (qb1) Counterflow (qb2) Total (qbtot)
Rosas 17:30 - 18:00 274 90 63 153
18:00 - 18:30 284 133 223
18:30 - 19:00 293 176 90 266
19:00 - 19:30 276 194 70 264
19:30 - 20:00 271 164 52 216
Total 1398 757 365 1122
Teatinos 17:30 - 18:00 250 45 49 94
18:00 - 18:30 204 48 89 137
18:30 - 19:00 188 46 97 143
19:00 - 19:30 206 47 72 119
19:30 - 20:00 229 36 53 89
Total 1077 222 360 582
Andrés Bello 17:30 - 18:00 284 86 169 255
18:00 - 18:30 259 114 318 432
18:30 - 19:00 298 140 331 471
19:00 - 19:30 254 143 326 469
19:30 - 20:00 211 120 207 327
Total 1306 603 1351 1954
Eleuterio Ramírez 8:00 - 8:30 420 90 31 121
8:30 - 9:00 393 82 31 113
9:00 - 9:30 409 85 22 107
9:30 - 10:00 393 62 16 78
Total 1615 319 100 419
Arturo Prat 8:00 - 8:30 84 10 28 38
8:30 - 9:00 89 9 30 39
9:00 - 9:30 90 16 19 35
9:30 - 10:00 99 14 14 28
Total 362 49 91 140
Ricardo Lyon 8:00 - 8:30 364 216 32 248
8:30 - 9:00 373 235 26 261
9:00 - 9:30 288 151 25 176
9:30 - 10:00 320 95 59 154
Total 1345 697 142 839
Pocuro 8:00 - 8:30 339 184 151 335
8:30 - 9:00 333 118 166 284
9:00 - 9:30 313 77 106 183
9:30 - 10:00 353 60 83 143
Total 1338 439 506 945
Average flow [veh/h] All streets 526 193 177 370
Table 3:Person flow in bicycles and motor vehicles, divided by the width of lanes (meters).
Street Period Persons in motor vehicles (qa) Bicycle riders in cycle lanes
Same direction (qb1) Counterflow (qb2) Total (qbtot)
Rosas 17:30 - 18:00 61 75 53 64
18:00 - 18:30 63 111 75 93
18:30 - 19:00 65 147 75 111
19:00 - 19:30 61 162 58 110
19:30 - 20:00 60 137 43 90
Total 311 631 304 468
Teatinos 17:30 - 18:00 83 38 41 39
18:00 - 18:30 68 40 74 57
18:30 - 19:00 63 38 81 60
19:00 - 19:30 69 39 60 50
19:30 - 20:00 76 30 44 37
Total 359 185 300 243
Andrés Bello 17:30 - 18:00 95 66 130 98
18:00 - 18:30 86 88 245 166
18:30 - 19:00 99 108 255 181
19:00 - 19:30 85 110 251 180
19:30 - 20:00 70 92 159 126
Total 435 464 1039 752
Eleuterio Ramírez 8:00 - 8:30 9 113 39 76
8:30 - 9:00 87 103 39 71
9:00 - 9:30 91 106 28 67
9:30 - 10:00 87 78 20 49
Total 275 399 125 262
Arturo Prat 8:00 - 8:30 32 10 28 19
8:30 - 9:00 34 9 30 20
9:00 - 9:30 34 16 19 18
9:30 - 10:00 37 14 14 14
Total 137 49 91 70
Ricardo Lyon 8:00 - 8:30 126 166 25 95
8:30 - 9:00 129 181 20 100
9:00 - 9:30 99 116 19 68
9:30 - 10:00 110 73 45 59
Total 464 536 109 323
Pocuro 8:00 - 8:30 113 184 151 168
8:30 - 9:00 111 118 166 142
9:00 - 9:30 104 77 106 92
9:30 - 10:00 118 60 83 72
Total 446 439 506 473
Average flow [veh/h-m] All streets 154 169 151 160
Figure 2a
Figure 2a:Ratio of person flow in bicycles to person flow in motor vehicles (Q indexes) and ratio of person flow in bicycles to person flow in motor vehicles per lane width (F indexes)
Figure 2b
Figure 2b:Ratio of person flow in bicycles to person flow in motor vehicles (Q indexes) and ratio of person flow in bicycles to person flow in motor vehicles per lane width (F indexes)

When only considering bicycle flows in the same direction as motor vehicles, \(Q_{1}\) ranges from 0.10 to 0.70, with mean and median values of 0.35 and 0.30, respectively. When including total bicycle flow for the cycle track, the \(Q\) index ranges from 0.20 to 1.85, with mean and median values of 0.72 and 0.61, respectively. In other words, in the seven streets observed, for every 100 people traveling in motor vehicles, 72 people ride bicycles. Andrés Bello is the only street in which more people per lane travel by bicycle than by motor vehicle (see the second column in Figure 2: in the period 18:00-20:00 hours, between 55% and 85% more people travel on the cycle lane than on each motor vehicle lane).

The \(F\) index portrays a different picture, with five out of the seven streets experiencing a higher flow rate of people riding bicycles than using motor vehicles, per meter of road width. The minimum, maximum, mean, and median values for \(F_{1}\) are 0.27, 2.64, 1.03, and 1.02, respectively. If cyclists traveling in a counterflowing direction are also accounted for, the same four indices are 0.37, 2.13, 1.02, and 0.81 respectively \({(F}_{\text{tot}})\). Therefore, on average, for every 100 people traveling in motor vehicles, 102 people ride bicycles, per unit of road width.

In synthesis, on the streets observed, lanes for motor vehicles typically have a higher person flow rate; however, several cycle tracks do have a larger person flow per meter of width. The question is whether these results are generalizable. In principle, these findings are site-specific. However, we can determine whether such results hold in general, with cycle tracks and lanes for motor vehicles running at full capacity.

On the one hand, the base saturation flow has been estimated to be between 1933 and 2292 pcu/h-lane in Santiago (Gibson, Bartel, and Coeymans 1997; UOCT 2011), where “pcu” stands for passenger car unit. Car occupancy rates in our data are between 1.3 and 1.6 pax/veh, depending on the street observed. Thus, the maximum person flow in cars is estimated to be between 2513 and 3667 pax/h-lane. On the other hand, the saturation flow for bicycles has been estimated as 2000 bicycles/h for the 1-meter wide cycle lane in Pocuro street in Santiago (Seriani, Fernandez, and Hermosilla 2015). Then, when comparing a 1-meter wide cycle lane with a 3-meter wide car lane at full capacity, the person flow in the cycle lane is found to be between 55% and 80% of the person flow in the car lane.[1] However, if the flow per unit of road width is considered, a cycle lane has a capacity that is between 164% and 239% of the person flow capacity of the car lane. In conclusion, for very high flow rates of bicycles and cars, the empirical result of our paper is also obtained: car lanes move more people than cycle tracks, but the opposite result is found if the road space (width) required by bicycles and cars is considered.

Acknowledgments

We acknowledge support by CONICYT Chile (Grant PIA/BASAL AFB180003). The comments of two anonymous referees are appreciated.


  1. The bicycle saturation flow rate would have to be in the range 2500-3700 bicycles/h for a 1-meter wide lane in order to equal the person flow of cars on a 3-meter wide lane. Bicycle saturation flows in that range have indeed been estimated in other countries (Allen et al. 1998).

References

Allen, D. Patrick, Nagui Rouphail, Joseph E. Hummer, and Joseph S. II Milazzo. 1998. “Operational Analysis of Uninterrupted Bicycle Facilities.” Transportation Research Record: Journal of the Transportation Research Board 1636 (1): 29–36. https://doi.org/10.3141/1636-05.
Google Scholar
Blanc, Bryan, and Miguel Figliozzi. 2016. “Modeling the Impacts of Facility Type, Trip Characteristics, and Trip Stressors on Cyclists’ Comfort Levels Utilizing Crowdsourced Data.” Transportation Research Record: Journal of the Transportation Research Board 2587 (1): 100–108. https://doi.org/10.3141/2587-12.
Google Scholar
Gibson, J., G. Bartel, and J.E. Coeymans. 1997. “Redefinición de Los Parámetros de Capacidad de Una Intersección Semaforizada Bajo Condiciones de Tráfico Mixto (in Spanish).” In Proceedings of the VIII Chilean Conference of Transport Engineering.
Google Scholar
Levinson, D.M., W. Marshall, and K. Axhausen. 2017. Elements of Access: Transport Planning for Engineers, Transport Engineering for Planners. Network Design Lab.
Google Scholar
Ling, Rebecca, Linda Rothman, Marie-Soleil Cloutier, Colin Macarthur, and Andrew Howard. 2020. “Cyclist-Motor Vehicle Collisions before and after Implementation of Cycle Tracks in Toronto, Canada.” Accident Analysis & Prevention 135 (February): 105360. https://doi.org/10.1016/j.aap.2019.105360.
Google Scholar
Rossetti, Tomás, C. Angelo Guevara, Patricia Galilea, and Ricardo Hurtubia. 2018. “Modeling Safety as a Perceptual Latent Variable to Assess Cycling Infrastructure.” Transportation Research Part A: Policy and Practice 111 (May): 252–65. https://doi.org/10.1016/j.tra.2018.03.019.
Google Scholar
Seriani, Sebastian, Rodrigo Fernandez, and Esteban Hermosilla. 2015. “Experimental Study for Estimating Capacity of Cycle Lanes.” Transportation Research Procedia 8: 192–203. https://doi.org/10.1016/j.trpro.2015.06.054.
Google Scholar
UOCT. 2011. Manual de Programación y Modelación de Semáforos (in Spanish). Unidad Operativa de Control de Tránsito, Chile.
Google Scholar

Powered by Scholastica, the modern academic journal management system