Research Questions and Hypotheses
Researchers have proposed that ridehailing, such as Uber and Lyft, can extend the catchment area of public transit (Shaheen and Chan 2016). Others propose ridehailing can improve accessibility by transit and thus improve equity (Boarnet et al. 2017). Others have explored the environmental effects of car access to transit (Hoehne and Chester 2017). Despite such claims, there have been few independent studies of the prevalence of ridehailing for first mile access to transit. Furthermore, ridehailing may also be combined with transit at the tour level—with people taking transit for some trips and ridehailing for others within a single tour. There is evidence of this for taxicabs (King, Peters, and Daus 2012). We use travel survey data to examine how for-hire vehicles are used as a first mile/last mile solution for public transit access, as well as how these modes are combined with others in multimodal tours. Our research questions are:
-
To what extent are for-hire vehicle trips combined with other modes, either on a single trip or within a tour?
-
To what extent are for-hire vehicle trips associated with transfers to public transit?
-
To the extent for-hire vehicles are used in combination with non-car modes, are there differences by time of day?
Methods and Data
To explore these questions, we use data from the 2017 National Household Travel Survey (NHTS). The NHTS was the first large, national survey to ask respondents about ridehailing use. About one percent of the respondents use taxicabs or ridehailing (collectively, for-hire vehicles) on any given day, and about ten percent use ridehailing in any given month (Conway, Salon, and King 2018). This suggests that while taxi or ridehailing trips are a small share of trips overall, a non-trivial number of travelers do use the services regularly. We first evaluate to what extent for-hire vehicle are combined with other modes to form home-to-home tours—e.g., taking transit somewhere and ridehailing back. Tours are constructed by grouping the trips for each respondent, starting a new tour each time they arrive at home (based on a “return home” or “work from home” trip purpose in the national sample, and the location identifier in the California subsample described below). Loop trips are excluded.
Ridehailing is often used by people who are out-of-town, who may not report a return-home trip during the travel day even if they returned to where they were staying. Thus, multiple round-trips may be considered a single tour. About nine percent of tours including a for-hire vehicle were taken by people out of town the entire travel day.
Unfortunately, the nationwide NHTS does not allow evaluation of how often for-hire vehicles are used for first mile transit access, because the variable identifying for-hire vehicles as an access/egress mode for transit trips has been combined with several other modes, including bicycling. However, the California add-on subsample of the NHTS (Transportation Secure Data Center 2019) does allow for direct evaluation of first mile access because access/egress modes are reported separately. Analysis of first mile access uses this California dataset.
We identify first mile trips to access transit in one of two ways. “Known” transfers between the modes are when a transit or for-hire trip had a recorded access or egress mode of for-hire vehicle or transit, respectively. These first mile access legs do not appear as separate trips, and are omitted from the national data. “Likely” transfers are when a for-hire vehicle trip and a transit trip on the same tour were separated by twenty minutes or less, or when the first trip had a purpose of “to change mode” and the trips were separated by 60 minutes or less. All of the analysis herein is based on person-trips; two respondents traveling together are counted as two trips. All analysis reporting percentages uses the weights provided by the NHTS, while sample sizes are based on unweighted data. Margins of error are 95% confidence intervals constructed by multiplying standard errors estimated using NHTS replicate weights by 1.96.
Findings
Table 1 uses the national sample to show which other modes are included in tours that include at least one for-hire vehicle leg. Because the for-hire vehicle access mode variable is not included in the national data, this table does not reflect first mile connections, but rather the use of different modes for different trips within a tour. Tours that include for-hire vehicles are likely to be multimodal. Tours with for-hire vehicles are most likely to include a walking trip (about 30 % of tours). Transit is included on roughly 27 % of tours that include for-hire vehicles.
Table 2 shows the results from the California add-on data, where respondents were asked specifically about use of for-hire vehicles to access transit. There were 44 tours where a for-hire vehicle was used to access or egress from transit. Overall, just under three percent of recorded tours with any transit use used a for-hire vehicle to access or egress from transit. About 40% of all tours that include both transit and ridehailing feature for-hire vehicles used for access or egress. This means nearly 60% of all tours with for-hire vehicles and transit usage used for-hire vehicles not to access transit, but for a different trip in the tour. Most substantially, nearly 11% of all tours with a for-hire vehicle did use a for-hire vehicle to access or egress from transit.
Of the for-hire vehicle and transit tours in California (n=530), 66% happened in the San Francisco-Oakland-Fremont metro area, followed by 15% in Los Angeles, eight percent in San Diego, four percent in Sacramento and the remaining elsewhere in the state. This distribution is consistent with expectations based on where ridehailing is most used, as the Bay Area has the highest share of residents who use ridehailing in any month at 31% (Conway, Salon, and King 2018). About half (56%) of all tours with for-hire and transit modes feature subway, commuter rail, private or intercity buses as the transit service, with the balance using local bus.
The California add-on data also allows for spatial analysis of the starting and ending points of for-hire vehicle trips. We used these geolocated data to assess the frequency of for-hire vehicle trip origin or destination within 400m or 800m of rail transit station computed using OpenStreetMap data (OpenStreetMap Contributors 2019) and the OSRM routing engine (OSRM Contributors 2019). Of all for-hire vehicle trips that did not include a known or likely transfer to transit (n=658), about seven percent start or end within 400m of a rail station, and about 15% start or end within 800m of a station. Using a for-hire vehicle to access transit is most practical when one end of the trip is transit-accessible on foot, and the for-hire vehicle is used at the other end; these results show that most for-hire trips could not use transit at either end.
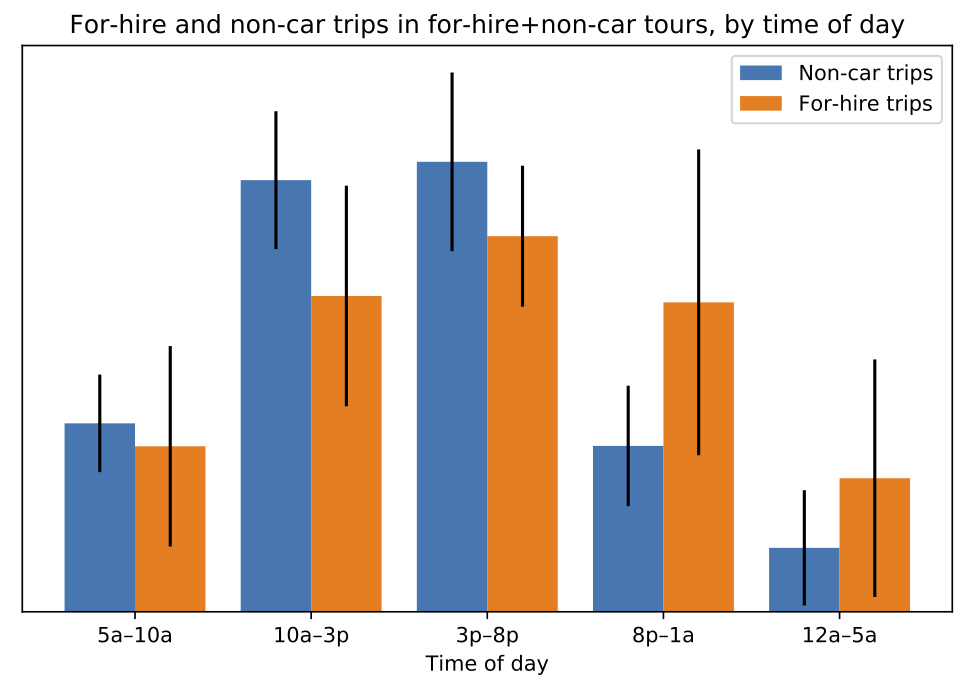
Lastly, we examined differences by time of day. Figure 1 shows the distribution of non-car trips (walking, cycling and transit) and for-hire vehicle trips by time of day, on tours that included both. Of note from this figure is that for-hire vehicles are reported less often during daytime hours than non-car modes, and more frequently during evening hours, when transit service is reduced and nonmotorized modes may be more dangerous. This figure excludes tours including air travel.

These findings suggest that for-hire vehicles can act as complements to other modes both for individual trips, such as first mile access, and at the tour level, where for-hire vehicles may be used for some trips in conjunction with other modes within a travel day. Tour-level complementarity is more prevalent than trip-level complementarity, however. The findings presented do come with caveats. There are few sources of data available to test claims of first mile access to transit. The data used here have small sample sizes and the results have wide confidence intervals. The point estimates should be used with caution. The NHTS survey can be improved by asking more directly about ridehailing (as well as other emerging modes such as e-scooters) and providing in the national sample the same disaggregate data on access modes that was included in the 2017 California sample.
Acknowledgements
The authors gratefully acknowledge partial support from the Center for Teaching Old Models New Tricks (TOMNET), a University Transportation Center sponsored by the US Department of Transportation through Grant No. 69A3551747116. We also thank Caltrans for their assistance with the California add-on to the NHTS.