

1. Questions
Many cities and states around the United States are considering zoning reforms that would increase the allowable density in single-family zoning districts (Pendall, Lo, and Wegmann 2022). These zones, often referred to as “R-1,” are typically the most common zone in any given city as measured by land area (Wegmann 2019). San Jose, California, for example, has zoned 94 percent of its residential land as R-1 (“Opportunity Housing,” n.d.). The low-density nature of these zoning districts makes it difficult for cities to plan for more homes as housing costs rise. Parking is a barrier to these reforms. Community members in many cities have expressed concern that increasing the number of homes in their area will cause parking demand to exceed capacity, both along the curb and in driveways (Volker and Thigpen 2022). This study has two research questions, one about parking capacity and use, and the other about methodology. They are:
-
Does parking demand in upzoned neighborhoods exceed supply, lending credence to concerns about adding units to R-1 zoning districts?
-
Is it possible to develop a low cost, straightforward method for measuring parking capacity in low-density neighborhoods that could be used by local transportation planners?
2. Methods
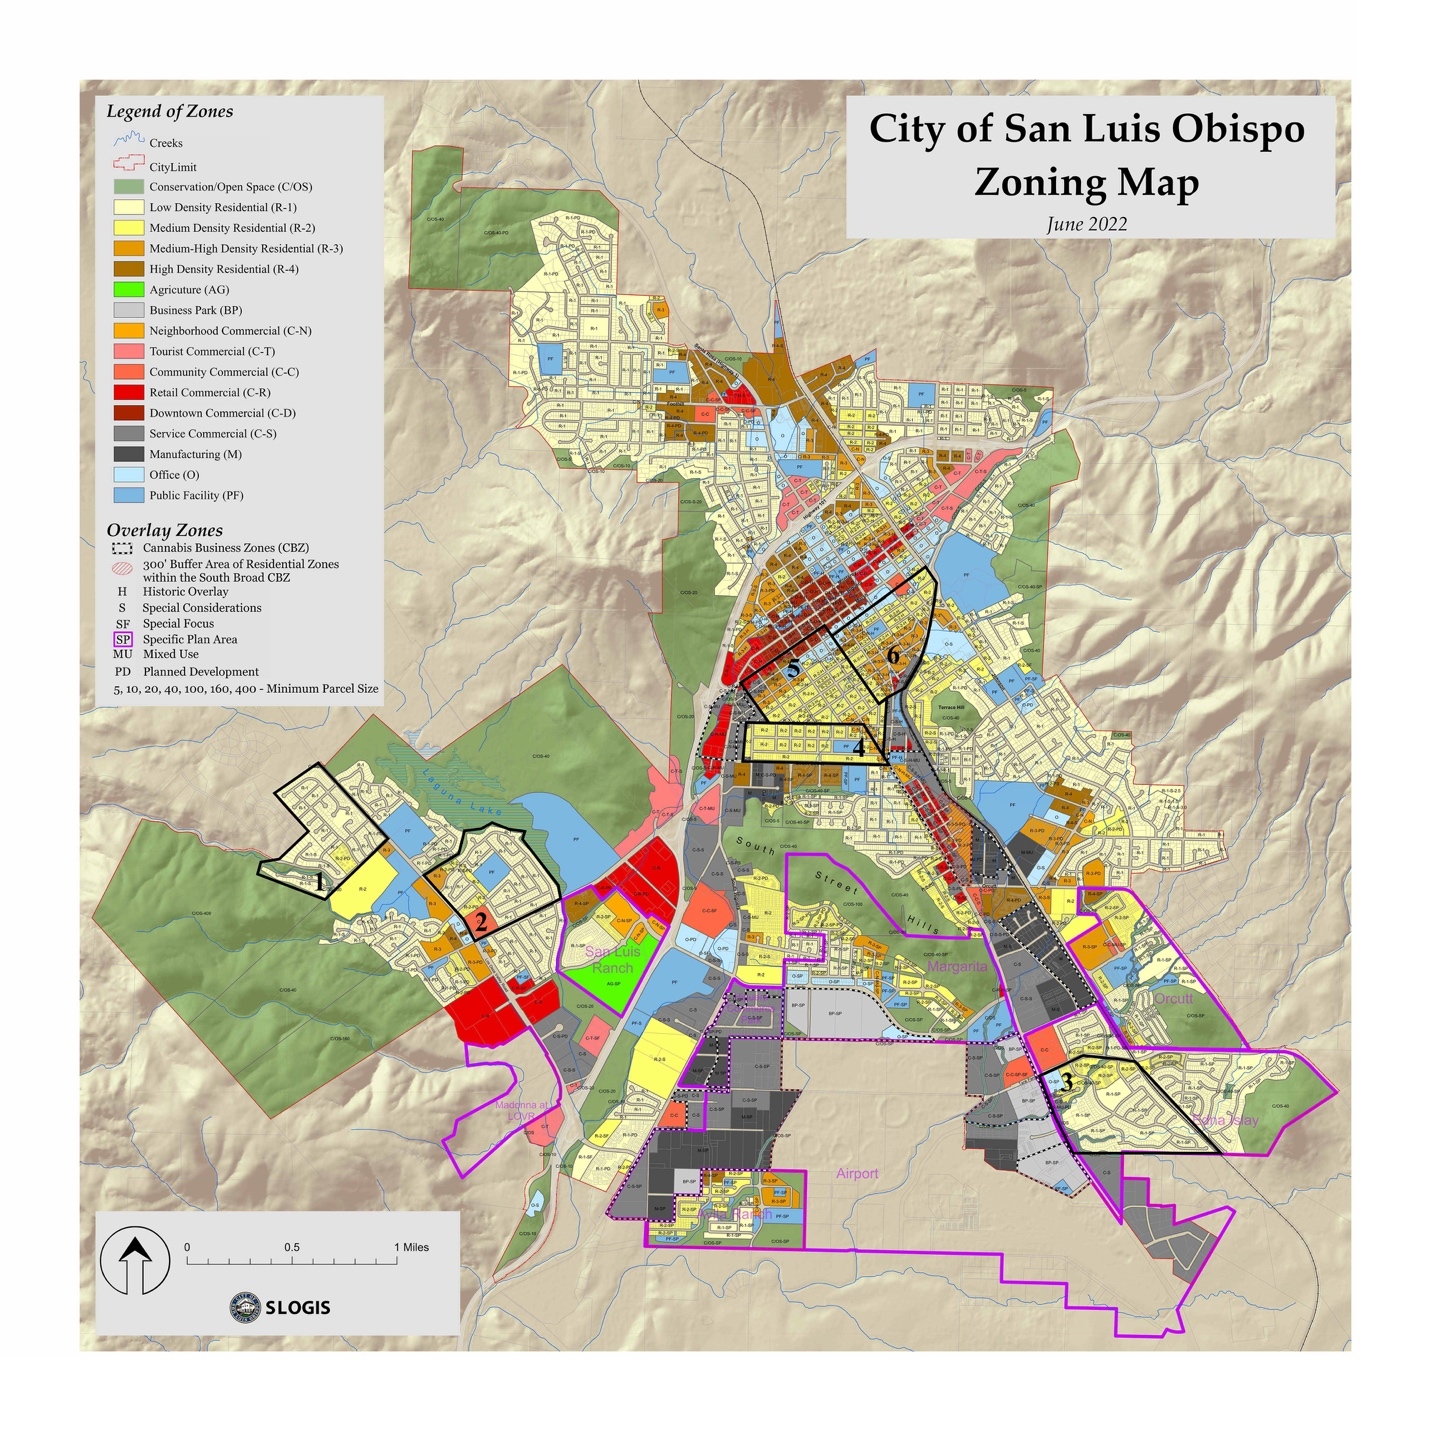
Transportation planners and engineers commonly consult The Institute for Transportation Engineers’ “Parking Generation Manual” when estimating parking demand for new development projects. This guide provides general parking estimates for single-family residential areas. The method presented in this article allows planners to measure their community directly. I led a team of graduate students who counted parking spaces and cars, both on-street and off-street, in three neighborhoods primarily zoned “R-1” and three primarily zoned “R-2.” The R-2 neighborhood is a stand-in for an R-1 neighborhood that has added more units due to zoning reform. If these R-2 neighborhoods still had parking supply available, we could assume that increasing density in R-1 areas would also have parking supply available. We chose neighborhoods away from the campus of Cal Poly, San Luis Obispo to avoid complications due to student housing (see Figure 1). Each neighborhood consists of linear blocks, which were the primary geographic unit we used within a neighborhood. We only surveyed blocks that had our desired zone (R-1 or R-2) on both sides of the street. No blocks had parking permits or paid parking.
The neighborhoods surveyed had different allowable residential densities. The R-1 zone allows 7 dwelling units per acre (17.3/ha) and a minimum lot area of 6,000 square feet (557.4 square meters). The R-2 zone allows for 12 dwelling units per acre (29.5/ha) and a minimum lot area of 5,000 square feet (464.5 square meters). We did a spot check of actual residential densities by comparing to representative blocks and counting the actual units per acre (figure 2). Residential density was lower in the R-1 block than the R-2 block.

Students used and extended an emerging method for measuring parking capacity and demand (Schlossberg and Amos 2015; Thigpen and Volker 2017). They began by estimating the number of on-street and off-street parking spaces. They used GIS to measure each block’s length, then subtract length for driveways, and finally divide the remaining length by 18 feet (5.5 meters), the standard length of a parking space. They applied a “fudge factor” to avoid overestimating the number of parking spaces. This is the equation for estimating on-street parking spaces:
Parking spaces = (2*[length of street]) – (18 feet x [number of driveways] x 1.5)/18 feet
Students estimated off-street parking supply by reviewing Google Earth imagery of driveway and garage spaces. Students randomly double-checked 10 percent of another team’s count to ensure estimates were similar across all neighborhoods. We assumed all garages could accommodate cars for this study, though another study found that only 63 percent of homeowners with garages use them for their intended purpose (Volker and Thigpen 2022).
Students then counted the cars themselves. Neighborhoods were sized so that a team could finish a count in one hour. They worked in groups of two. This was for safety, and to ensure one surveyor could drive and another could count. They surveyed each neighborhood three times, twice in the evening between the hours of 9:00 PM and 10:00 PM and once between the morning hours of 6:00 AM and 7:00 AM. These times were chosen to maximize the amount of people at home, thereby increasing the likelihood of counting the maximum number of parked vehicles. Teams counted during a two-week period from the end of May and early June 2023, and only counted on Tuesdays, Wednesdays, or Thursdays, to avoid any possibility of different patterns for weekends and holidays. Students did not count motorcycles, as they were small and rarely seen. They did count recreational vehicles, as they were larger and more permanent in nature. Students assigned each block an identification number and printed out a map with those numbers on them when counting. They then used pencil and paper to record their counts and transferred them to a spreadsheet the next day.
3. Findings
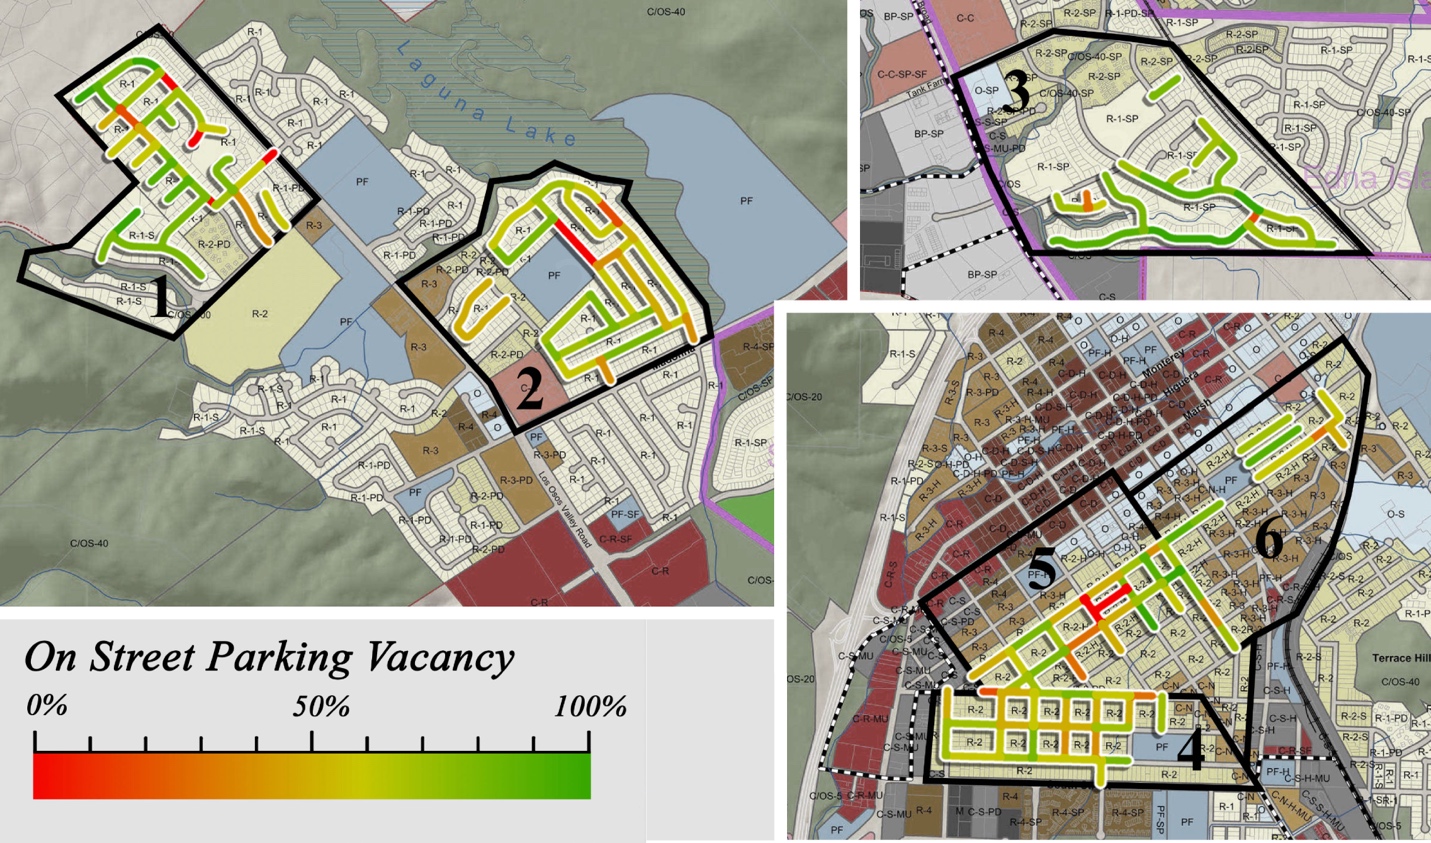
The students averaged the results of the three counting times and produced aggregate vacancy rates for off-street and on-street parking in each of the neighborhoods (Table 1).
The cumulative vacancy rates for all R-1 neighborhoods were higher than for all R-2 neighborhoods, but the R-2 neighborhoods still had significant vacancy, both on-street and off-street. The parking capacity for all neighborhoods is similar, suggesting that increasing density to R-2 levels (12 dwelling units per net acre/SI) will not overburden neighborhood parking (see Figure 3). There was some vacancy variation among blocks withing neighborhoods. This can be attributed to blocks with few available parking spaces to begin with and homes with higher-than-expected parking demand. This is common in college towns with unrelated individuals living together, like San Luis Obispo.

This study also proves that this kind of parking study can be done with little effort and expense. Any city with interns can complete a study like this. The only software required is GIS to measure block lengths, Google Earth (or other aerial photography) to estimate off-street parking, and spreadsheet software to calculate the results. Planning practitioners can provide interns with this article and areas that need surveyed, and the interns could largely manage this project themselves.
This study is valuable because it is a low-cost yet accurate way of measuring parking supply and demand in low-density neighborhoods. It can be used in communities to dispel any concerns about parking availability after zoning reforms. This can make it easier for communities to meet their housing goals and increase the supply of affordable housing.
Acknowledgements
I’d like to thank the Spring 2023 class of CRP 513 for their work gathering the data for this article.