
1. QUESTIONS
In the summer of 2023, Stavanger City Council decided that their residents would receive free public transport tickets within Nord-Jæren fare zone (Stavanger and the neighboring municipalities) starting from July 3rd, 2023. Stavanger is a municipality on the West Coast of Norway and the largest city in the county of Rogaland with a population of approximately 150,000 (see map in figure 1). The local free-fare policy applied to all local public transport services, i.e. buses, boats, and trains. [1] To travel for free on public transport, residents needed a valid ticket. Only those registered as residents in Stavanger municipality were entitled to a free ticket. Other travelers had to pay regular fares[2]. The aim of this paper is to quantify the change in public transit boardings caused by the introduction of free public transport for Stavanger residents.
.jpg)
Free public transit has been implemented in several cities. Most studies find large increases in passenger numbers as a result of free public transit (Fearnley 2013; Kębłowski 2020). Cats, Susilo, and Reimal (2017) find that in Tallinn, there is a 14 % increase in the use of public transport as a result of the introduction of free public transport for its citizens. Using data from Templin in Germany, Storchmann (2003), finds several hundred percent increases in passenger numbers caused by free public transit. Also, in Aubagne in France they observe substantial increases in public transport after the introduction of free public transit (Volinski 2012). However, there are some exceptions. For example, in Luxembourg, where free public transport was introduced in 2020, most preliminary studies indicate that the usage of public transport (and car) has remained almost unchanged as a result (Duxfield 2022).
Two features distinguish the present paper from a majority of existing studies. First, our difference-in-differences (DiD) design implies measuring both treatment and control groups before and after the intervention. This contrasts a before-after design with no control, which several studies have used. Furthermore, our data are generated by automated traffic counters (APC), thereby reducing the problems of self-selection which may create bias in survey data.
2. METHODS
In our study, we utilized data from APC systems, which record the number of passengers boarding and alighting buses throughout Rogaland. These APC data are essential for evaluating the impact of free public transport on the entire population, as they provide detailed data on boardings per stop on an hourly basis for each bus line in Rogaland. The dataset includes information such as the date, bus line number, stop name and number, municipality, and the number of boardings per hour. The dataset comprises approximately 39 million observations (i.e., the number of boardings per stop per hour), covering the period from January 2022 to end of 2023.
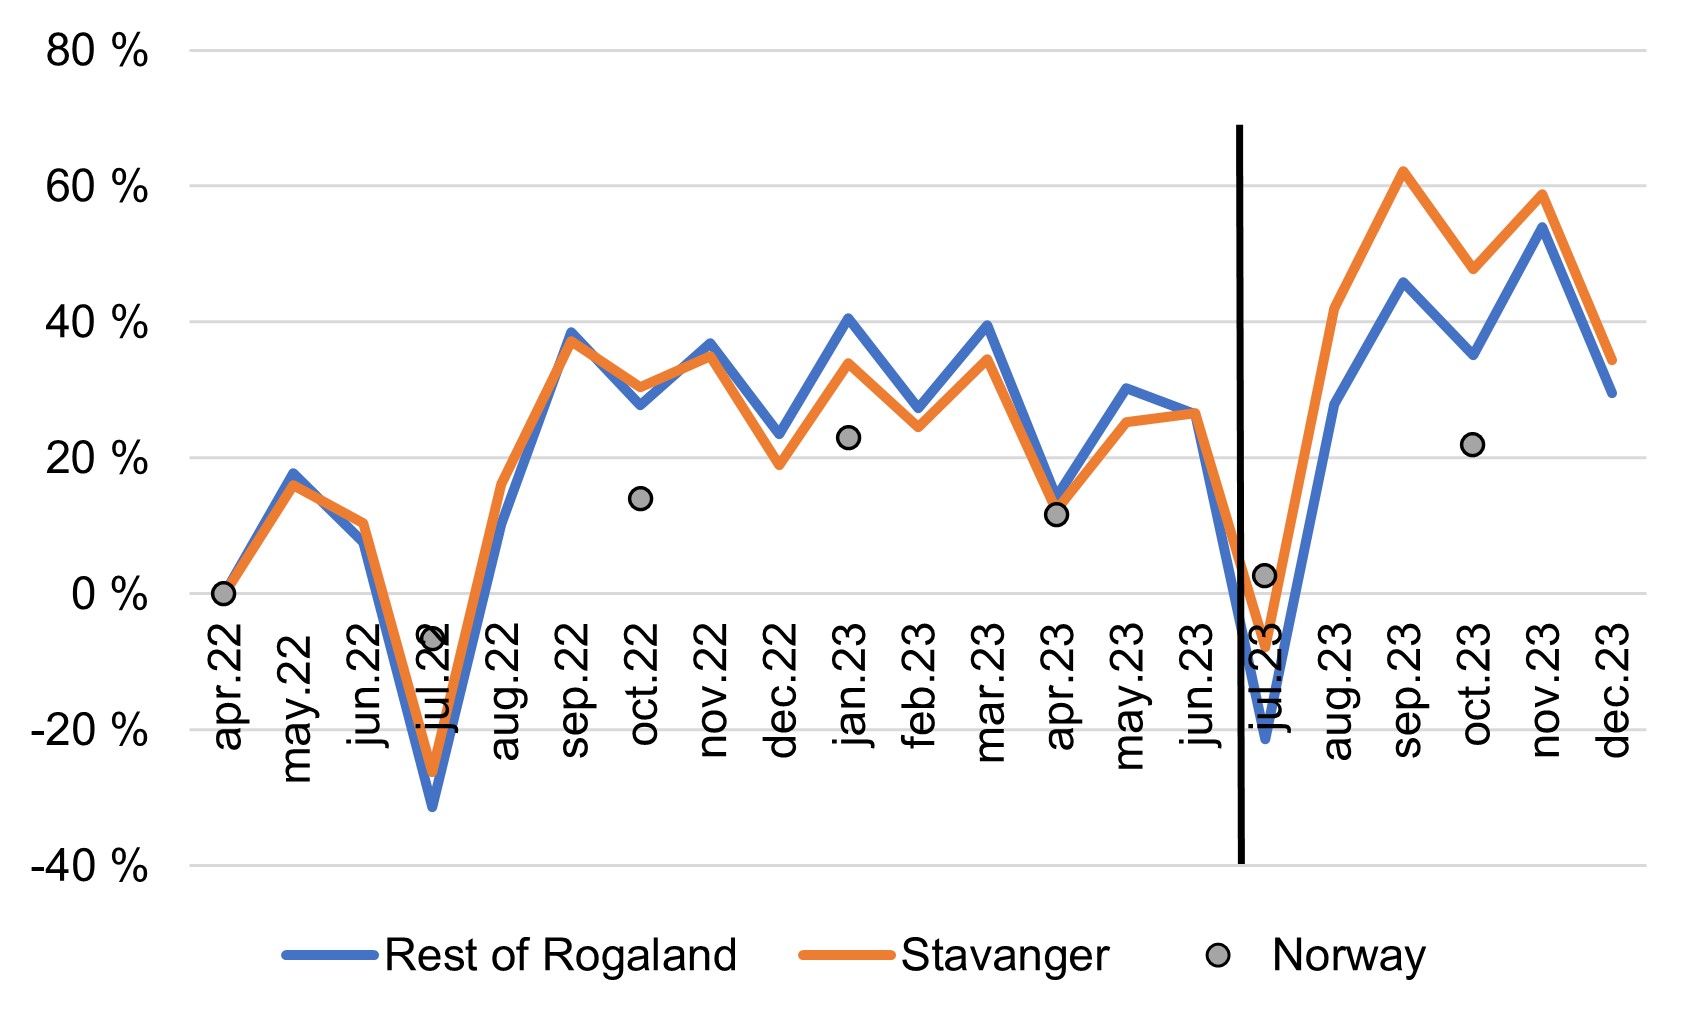
Figure 2 illustrates the percentage change in the number of boardings on bus in Stavanger and the rest of the county (Rogaland) compared to April 2022 in each of the regions. The figure indicates that Stavanger and the rest of Rogaland follow similar trends until the introduction of free public transport in July 2023. From the introduction of free public transport, Stavanger has more boardings per month compared to April 2022 than the rest of Rogaland. The figure also includes data for Norway as a whole[3].

Given that many factors influence travel behavior change over time — such as the drop in public transport usage during the pandemic followed by a gradual recovery — we employed Rogaland (the rest of the county) as control group to isolate the effect of the free public transport initiative. This approach allows us to compare changes among residents of Stavanger with those in the control group, thus accounting for any time-specific factors that affect all units of observation. Importantly, this includes seasonal and weather fluctuations as well as societal and policy changes that might affect both groups similarly. More specifically, we apply panel data with fixed effects. When we use this DiD design (e.g., Angrist and Pischke 2010), the DiD estimate equals the interaction between the treatment group (here: Stavanger) and the post-treatment period (observations made while the free-fare policy was in force).
3. FINDINGS
Table 1 presents the results from two regression analyses, showing the percentage increase in public transport usage in Stavanger per day due to the introduction of free public transport. The first column, labeled “Whole Day,” indicates a 7.5 % increase in daily boardings in Stavanger attributable to the initiative. Since we cannot identify the residence of passengers from the APC data, we conducted an additional validation analysis focusing on morning peak hours (06:00-09:00). We assume that boardings during these hours are predominantly by residents of the municipality. This analysis revealed an 9.1 % increase in boardings in Stavanger during the morning peak (Table 1).
In summary, our analysis indicates a general 7.5 % increase (significant), and a 9.1 percent increase during the am peak (not significantly different from zero), in daily boardings in Stavanger attributable to the initiative of free public transit. The inclusion of a control group has made it possible to control for the fact that public transport in the whole of Norway has steadily increased after the covid-19 pandemic and for seasonal effects. A future expansion of this study may be to include a synthetic control making the trends in the before period even more identical in the treatment and control groups.
Declarations of interest
The paper is funded by Norwegian Research council project number 309392 and Norwegian Research council project number 326814. The public transport provider in Rogaland Kolumbus has also sponsored part of the analysis with funding and given access to the data.
Buses produce the vast majority of public transport trips in Rogaland and Stavanger, with about 34 million passengers in 2023 (https://www.kolumbus.no/aktuelt/arsrapport2023/utvikling-i-tall). This is followed by local train, with about 5 million trips in 2023 (https://www.ssb.no/statbank/table/10484).
Regular adult fares for those who were not entitled to free public transport: One zone single ticket NOK 42 (EUR 3.57), 30-day tickets NOK 630 (EUR 53.55); two zones single ticket NOK 77 (EUR 6.55), 30-day tickets NOK 1030 (EUR 87.55); three or more zones single ticket NOK 112 (EUR 9.52), 30-day tickets NOK 1430 (EUR 121.55). Children, old age pensioners, students and military personnel pay half price.
Statistics Norway Public; Norwegian public transport with bus table 06670, quarterly data, https://www.ssb.no/statbank/table/06670/.