
1. QUESTIONS
People report dissatisfaction with free-floating shared micromobility (bikes and e-scooters) parking (City of Atlanta 2020; Klein, Brown, and Thigpen 2023), spurring many cities to implement strategies to encourage proper parking. One prominent effort includes cities designating corrals for parked devices. While research documents that dedicated parking should be provided every 200 meters to maximize compliance (Meng et al. 2024) and that app-based messaging and wayfinding interventions may marginally contribute to parking compliance (Klein, Brown, and Thigpen 2023), no research to date has examined if corral design can affect parking behaviors. This research therefore asks: can parking design attract more riders to park in designated parking locations or encourage them to park more tidily within designated spaces? We hypothesize that increasing designated parking space visibility and providing visual cues within corrals will increase in-corral and tidy parking, respectively.
2. METHODS
We collected field observations and trip data in June 2024 across three US cities: Denver, CO; Grand Junction, CO; and Washington, DC. The three cities represent different contexts including city size, program start date, micromobility fleet, and parking requirements (see Supplemental Information).
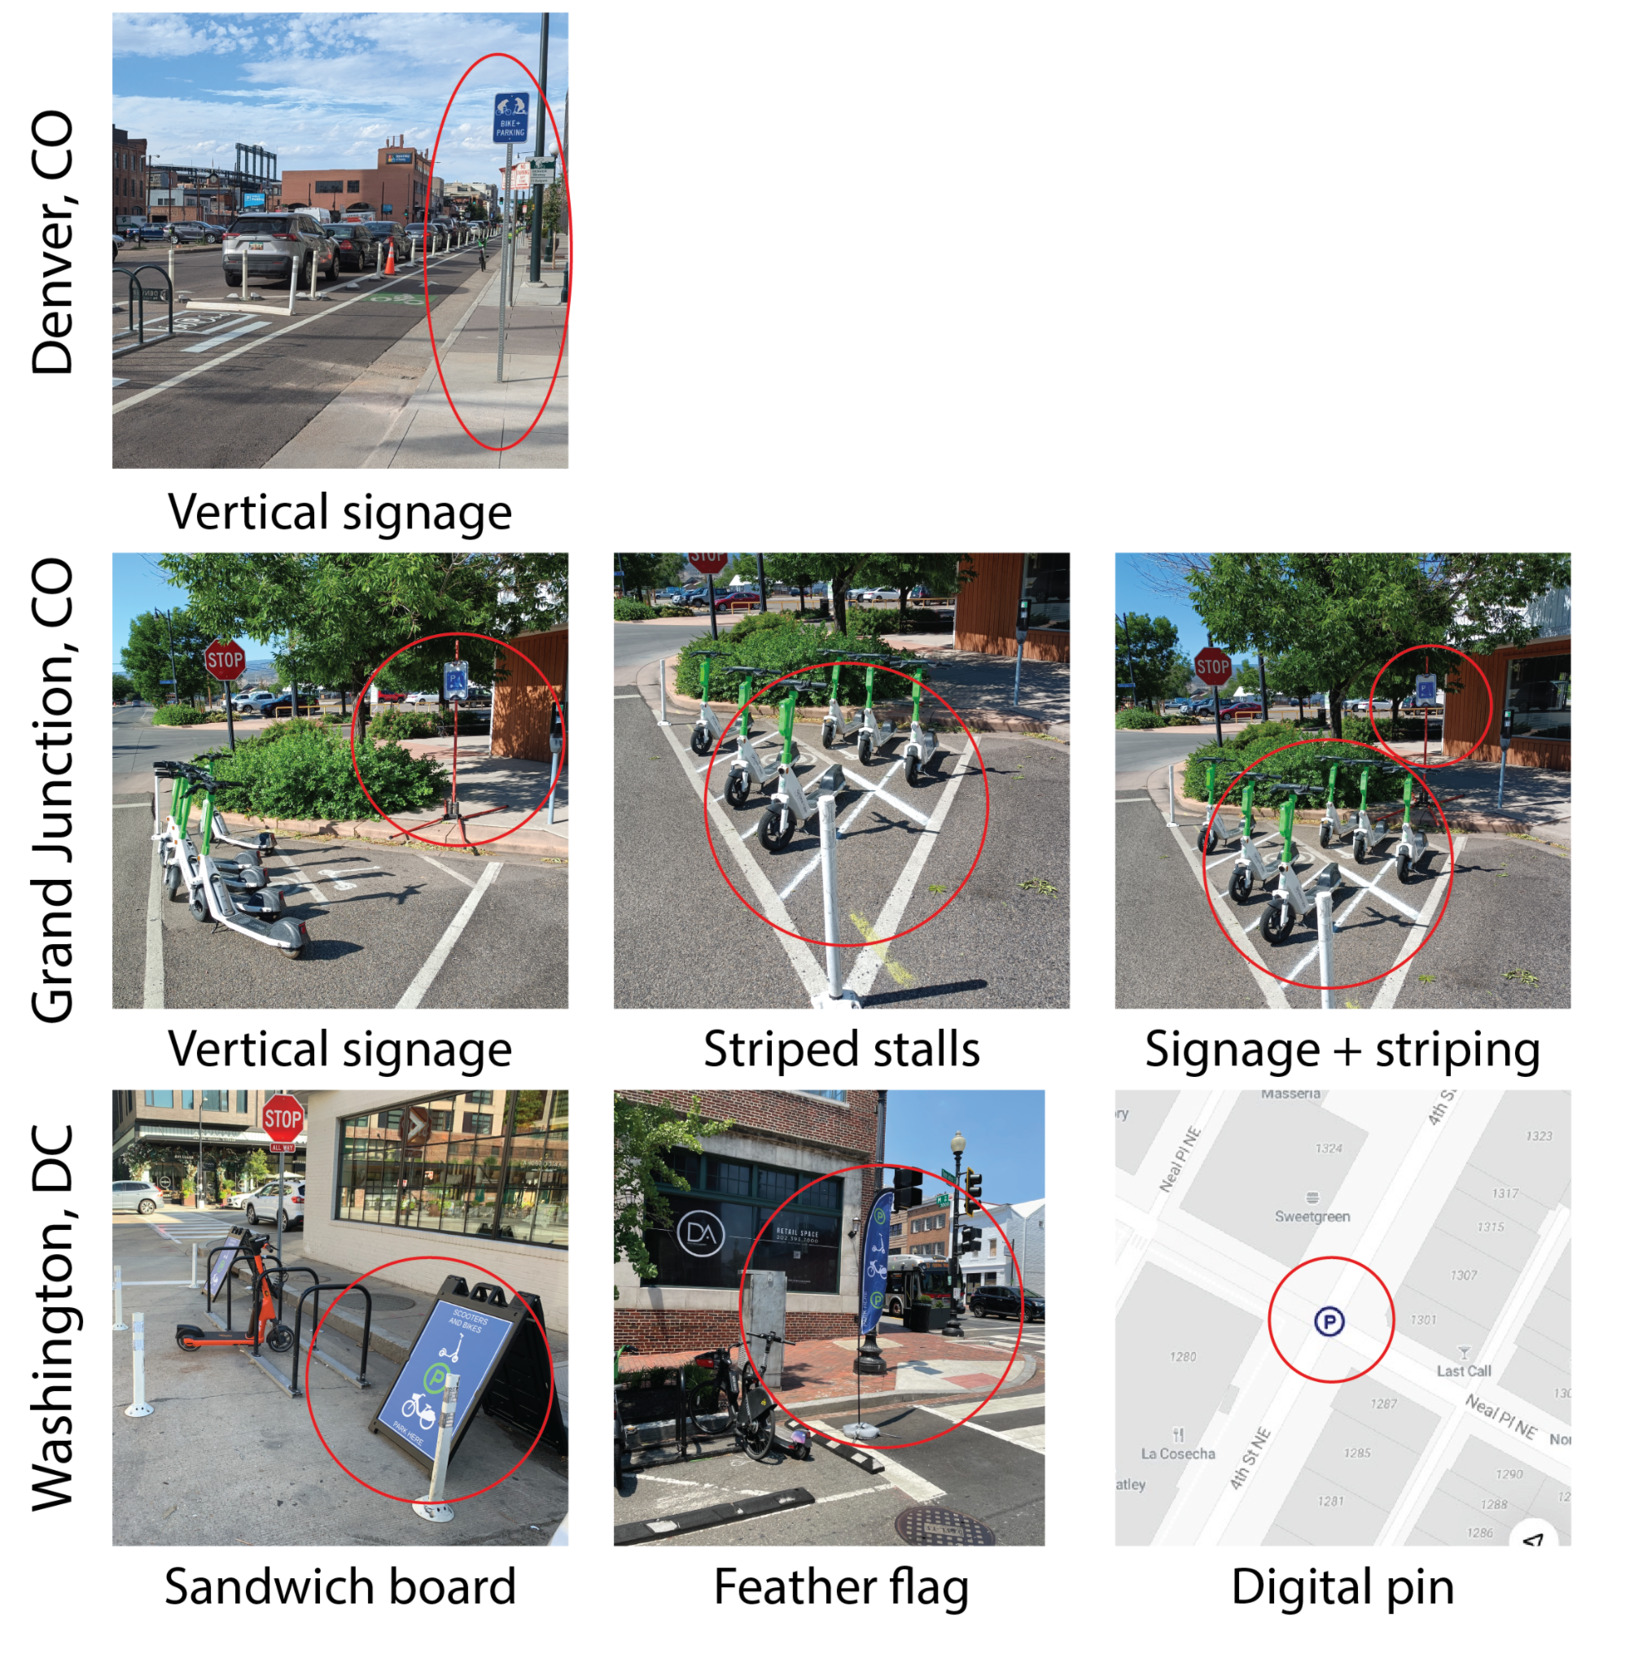
City staff identified both study locations and interventions (see Table 1). Each city included one control location that remained unchanged throughout the project, and two experimental locations that received identical treatments. All study corrals were in busy commercial areas and popular parking locations based on existing trip data. Treatments included vertical signage in all three cities alongside several stand-alone interventions in individual cities. Grand Junction installed painted scooter stalls to test if markings changed how people parked (i.e., parallel or perpendicular to other scooters) within corrals. DC tested a virtual parking pin as digital wayfinding. Interventions were removed at the end of each phase and before subsequent interventions were installed to ensure a single treatment per time period, with the exception of the final week of experiments in Grand Junction. Timing for treatments and observations were consistent both within and across cities. Figure 1 shows all corral treatments across the three cities.
To measure how scooters park, research assistants collected observational field data within each city, experimental phase, and study corral. Observation times balanced worker schedules alongside efforts to capture data across multiple days of the week (including weekends) and times of day (peak and off-peak). Overall, we aimed to maximize sample sizes while also accounting for behavioral differences that may occur across times or days of week. In sum, workers collected data for about 150 hours. Research assistants recorded the location of all micromobility vehicles within 20 meters of study corrals, including vehicles parked in corrals when a work shift began, and vehicles that parked during the observation period. Assistants recorded the parking location, if a vehicle was upright or tipped over, its orientation relative to other bikes or scooters in the group, and company/vehicle ID to ensure vehicles were not double counted. Photos of each vehicle provided data validation. The Supplemental Information includes the field data collection instrument.
In sum, we observed 661 parked vehicles across all the locations and study periods (286 in Grand Junction, 252 in Denver, and 125 in DC). Eighty-seven percent (86.7%) of observed vehicles were shared scooters, 9.4% were shared bikes, and 3.8% were and personal bikes. Small sample sizes reflect limitations of observing a dynamic mode in which activity may not be concentrated at the exact time or location of the observation periods. For example, about one trip per hour ended in our study corrals on average, challenging large-sample field observations.
Because field observations were limited in time and duration, we used trip data from Lime (which operates in all three study cities) to calculate the share of micromobility vehicles parked within the study corrals. Trips were assigned to a station area if they ended within 150 meters of a study corral. We categorized them as parked within a corral if they fell within 20 meters of a study corral. A 20 meter buffer accounts for GPS drift, which may be up to 30 meters (Nivel 2022).
We used trip dates to assign each trip end to a study period (e.g., control, treatment A, treatment B, etc.). We then calculated the share of trips within each catchment area parked within the corral during each study period.
We designed our experiment to enable evaluation of whether the interventions led to increased parking at the corrals and increased tidy parking within the corrals through difference-in-differences (DID) statistical tests (see Wing, Simon, and Bello-Gomez (2018)). Supplemental Information includes additional detail on the DID methodology.
Study limitations include a small sample, which likely led to a lack of statistical power to detect small effect sizes. Additionally, some of the interventions were pilots (e.g. feather flags, sandwich boards) rather than long-term, official implementations, which may have affected their effect. Long-term interventions could have different impacts for several reasons: different, more permanent, materials may affect outcomes; and riders’ behavior may take longer to change than the one-week periods examined in this research. This study also focused on minor “design” changes to existing parking corrals, rather than broader planning decisions, such as the location of a corral – midblock versus intersection, on the sidewalk versus in the street. Finally, GPS drift may reduce the accuracy of coding vehicles in versus outside of corrals; we may have inadvertently coded some vehicles as inside the corral that were in fact outside the corral. However, using a smaller buffer could likewise engender measurement errors as vehicles inside of corrals could show up as outside due to GPS drift.
3. FINDINGS
Table 2 shows how the share of vehicles parked within the corral area changed both over the study period and between control versus experimental areas. In sum, we observed 17,488 trip ends across the study areas and periods. Shaded areas represent the treatments that we hypothesized would affect where people park their shared bikes or scooters. Some of the clearest differences exist across cities, particularly the share of scooters parked within corrals in Grand Junction—which requires parking in mandatory zones—versus Denver and Washington, DC, which have recommended but not mandated parking corrals. Data also highlight clear differences between control and experimental locations, even at baseline, despite corrals being situated in similar (dense, commercial) built environments within each city. Results from the difference-in-difference analysis suggest that the piloted design treatments did not lead to statistically significant differences in whether riders parked inside the study corrals (see Supplemental Information).
Table 3 shows the orientation of bikes and scooters relative to other nearby micromobility vehicles across all cities and study periods. Overall, 80% of vehicles were parked parallel to adjacent vehicles, which the public interprets as both tidy and properly parked (Klein, Brown, and Thigpen 2023). Except for painted scooter stalls tested in Grand Junction (indicated by shaded cells in Table 3), we did not anticipate treatments to affect the orientation of parked vehicles within micromobility corrals.
The share of scooters parked parallel to adjacent vehicles in Grand Junction during the baseline week was 64% in the treatment corrals and 78% in the control corral; the share increased to over 95% in the treatment corrals in both intervention weeks, but never exceeded 90% in the control corrals. These differences were marginally significant for treatment corrals during experimental weeks (see Supplemental Information), suggesting that painted scooter stalls produce encouraging albeit marginal effects in tidy parking measured as parallelly-parked scooters.
ACKNOWLEDGEMENTS
Kathryn Skeen, Megan Harbaugh, Olivia Simard, Jessica Allen, Edwin Kurjak, and Jacob Kiefer collected field data. Henry Brown, Nathan Pope, Ted Randell, and Greg Matlesky supported the field experiment. The Mui Ho Center for Cities at Cornell University funded this work.