Loading [Contrib]/a11y/accessibility-menu.js
Skip to main content
null
Findings
  • Menu
  • Articles
    • Energy Findings
    • Resilience Findings
    • Safety Findings
    • Transport Findings
    • Urban Findings
    • All
  • For Authors
  • Editorial Board
  • About
  • Blog
  • covid-19
  • search

RSS Feed

Enter the URL below into your favorite RSS reader.

http://localhost:45269/feed
Transport Findings
December 17, 2024 AEST

Gender, Weather, and Time of Day: Active Travel Observations in Greater Sydney

Yuting Zhang, Jingyi Shao, John D. Nelson, Jennifer L. Kent, Sotiris Vardoulakis,
active travel behaviourtraffic countwalkingcyclinggenderweathertime of dayapparent temperature
Copyright Logoccby-sa-4.0 • https://doi.org/10.32866/001c.127019
Findings
Zhang, Yuting, Jingyi Shao, John D. Nelson, Jennifer L. Kent, and Sotiris Vardoulakis. 2024. “Gender, Weather, and Time of Day: Active Travel Observations in Greater Sydney.” Findings, December. https:/​/​doi.org/​10.32866/​001c.127019.
Save article as...▾
Download all (3)
  • Figure 1. Photos of the three sites.
    Download
  • Figure 2. Locations of observers
    Download
  • Supplemental Information
    Download

Sorry, something went wrong. Please try again.

If this problem reoccurs, please contact Scholastica Support

Error message:

undefined

View more stats

Abstract

This paper examines how weather and time of day affect the way males and females use walking and cycling infrastructure in Sydney, Australia. Using observational data from three dedicated walking and cycling paths, the results show that more males than females engaged in walking and cycling, with cycling showing a greater gender disparity. While active travel volumes were influenced by weather and time of day, no significant gender differences were observed in how these factors affected the number of active travel users.

1. Questions

Adverse weather conditions deter walking and cycling (Burchfield, Fitzhugh, and Bassett 2012; Guo, Wilson, and Rahbee 2007). Furthermore, the weather-cycling relationship can be moderated by gender (de Kruijf et al. 2021), and day of week / time of day (Singhal, Kamga, and Yazici 2014; Zhao et al. 2018).

In many cities, the provision of infrastructure for active travel (defined here as walking and cycling) is a key component of programs to encourage walking and cycling (Jáuregui et al. 2021; Marshall 2022). There has, however, been a lack of in-depth studies examining the way active transport infrastructure interacts with weather, time of day, and gender, in the context of the uptake of active transport modes in Australia. We address this gap by focusing on specific infrastructure, allowing for a detailed examination of how these factors affect active travel use.

We conducted comprehensive manual observations of active travel behaviours at selected active travel infrastructure interventions in Greater Sydney, Australia. The following research questions are addressed:

  • How do weather and time of day affect the behaviour of cyclists and pedestrians at observation sites?

  • Is there a gender difference in the usage of active travel infrastructure?

2. Methods

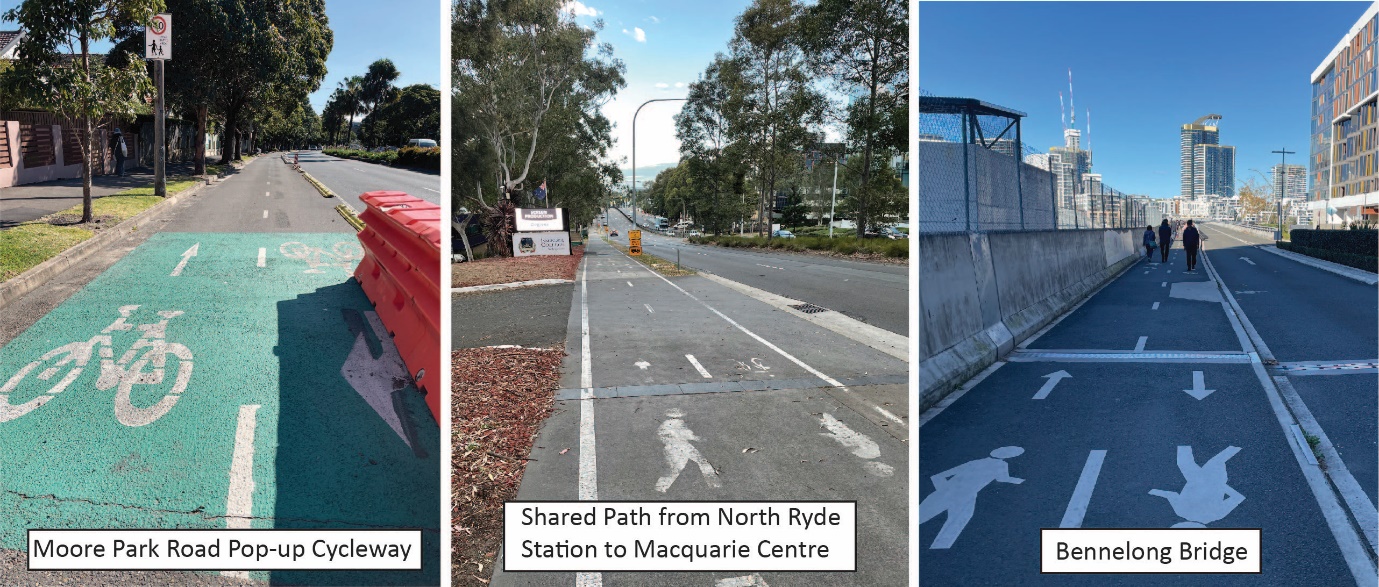
This study is focussed on three selected instances of active travel infrastructure in Greater Sydney (Table 1). These cases represent three different types of infrastructural interventions: on-road cycleway, off-road shared path; and a bridge that only allows for walking and cycling (on a shared path) and for buses (on a bus lane), but not for car traffic.

Active traffic volume was observed for walking (including people who walk, run, and walk with dogs or prams) and cycling (including people who ride bikes and e-bikes). The traffic count was recorded in both directions, noting gender differences (based on observation, where gender was considered as a binary variable) and weather conditions, including sunny/rainy status. Five observation sessions were conducted at each site: two on weekday mornings, two on weekday afternoons, and one on a Saturday morning. Each session lasted two hours (see Table 1) and sessions were conducted in late February and March 2024.

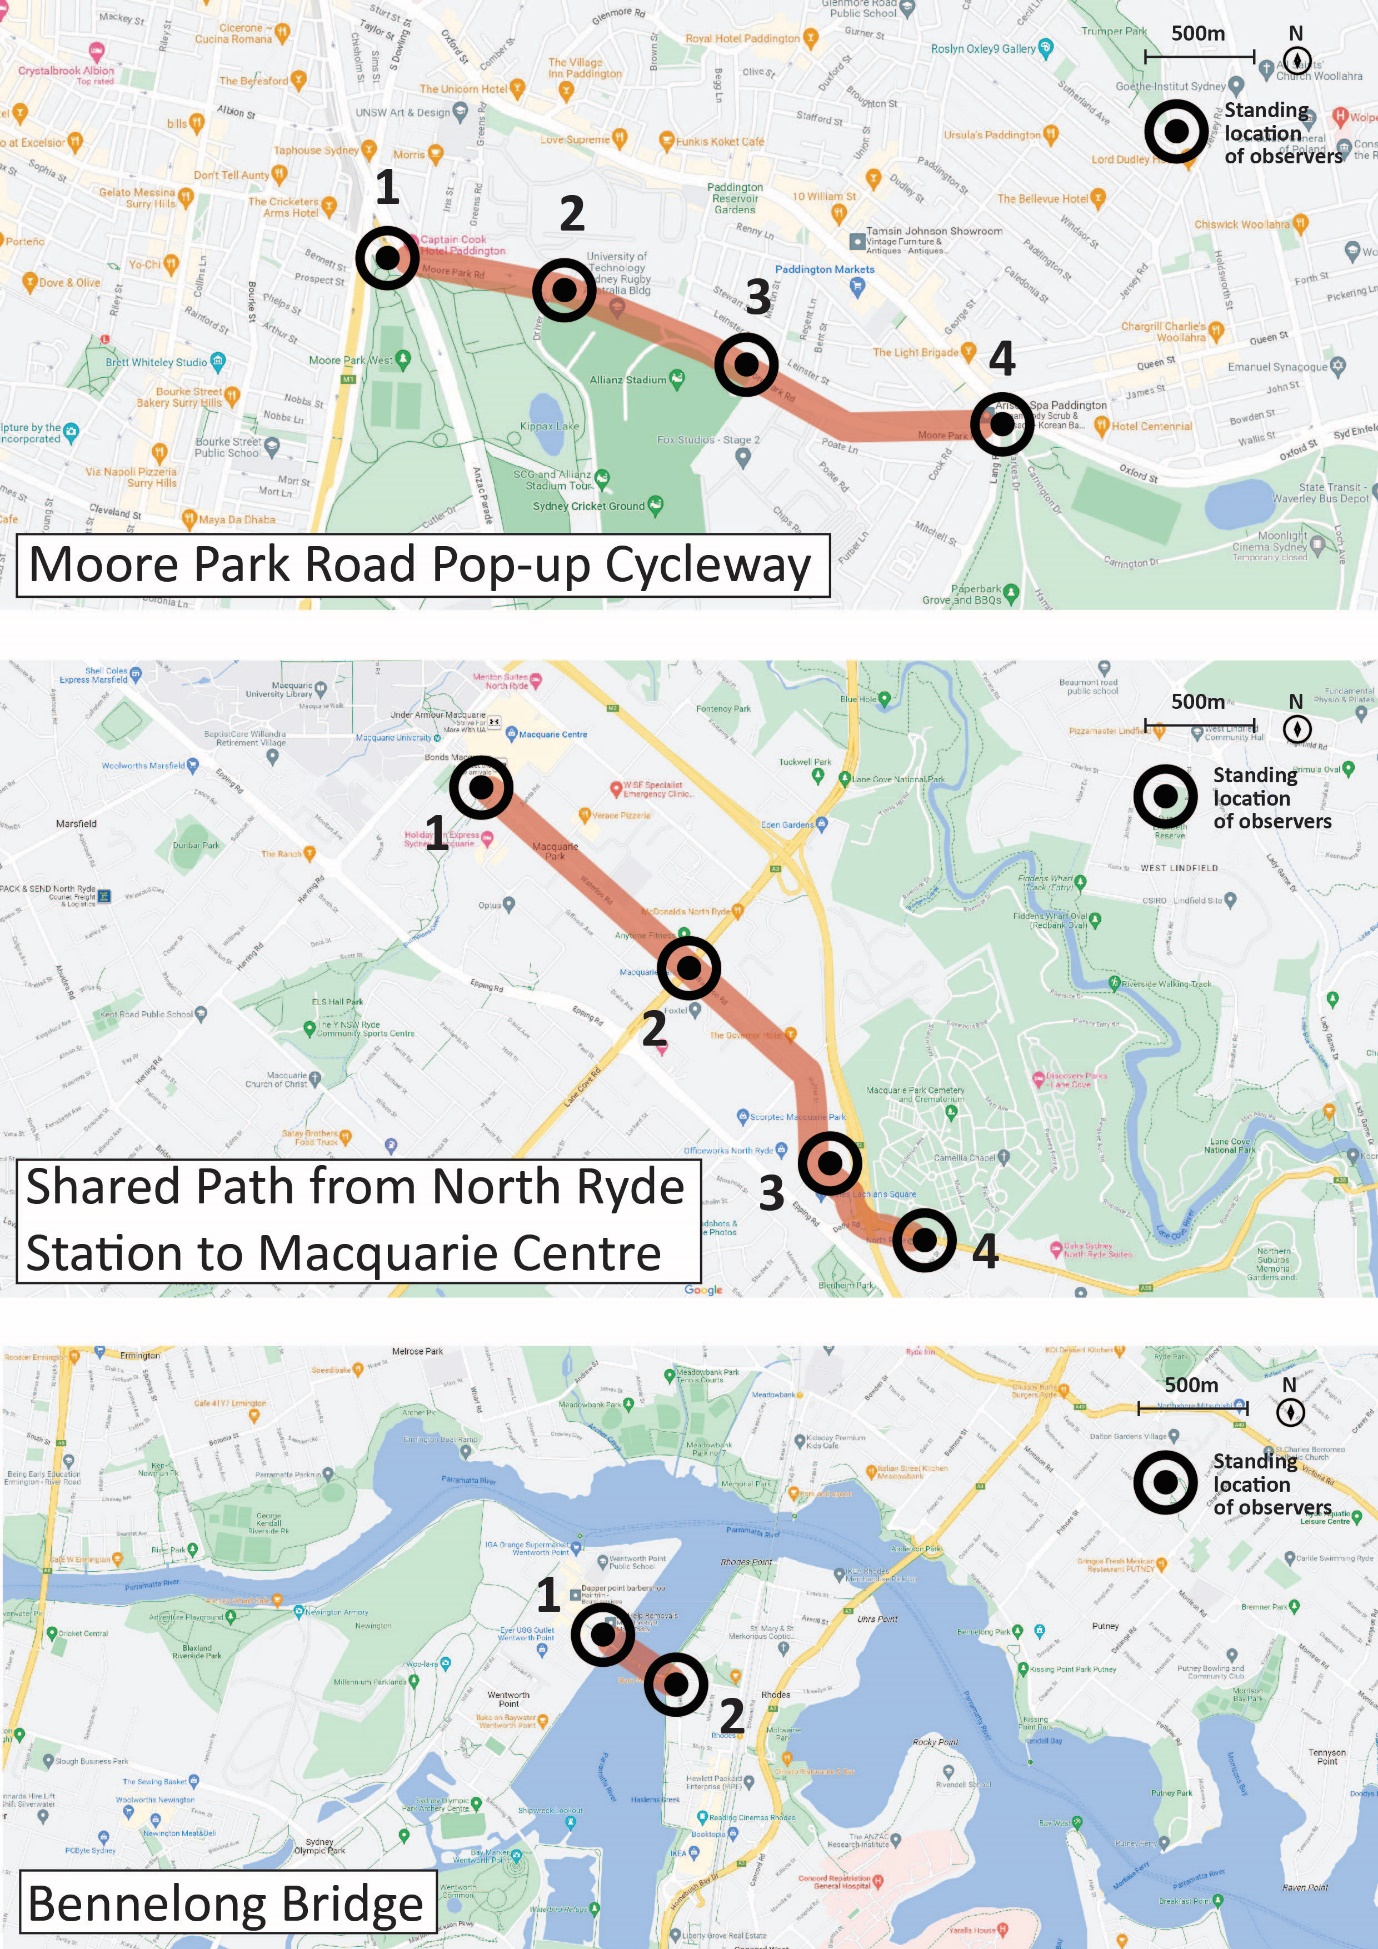
Each session involved multiple people positioned at different locations along the infrastructure at the same time. Figure 1 shows photos of the three sites. Figure 2 illustrates the standing locations of observers, which is consistent for every observation session. All observers received standardised training before the observation sessions and were instructed to follow specific guidelines to ensure consistency in data recording. During each session, the fieldwork leader visited all observation sites to verify that observers were adhering to the set standards, ensuring data reliability.

The apparent (“feels like”) temperature (Steadman 1994) was considered in the data analysis. The apparent temperatures during mornings and afternoons were calculated respectively based on the temperature (℃), relative humidity (%) and wind speed (m/s) at 9am and 3pm from the nearest weather stations, drawing data from Australian Government Bureau of Meteorology (2024). Therefore, the apparent temperature is the human perceived temperature, including an adjustment for humidity and wind speed.

Descriptive analysis was conducted. Then, given the over-dispersion of the active travel count data, multivariable negative binomial regression analyses were used to assess the effects of the weather conditions and time of day on active travel counts, stratified by gender and observation sites. All statistical analyses were performed using the software R.

Table 1.Traffic observation sites and observation arrangement
Site name Moore Park Road pop-up cycleway Shared Path from North Ryde Station to Macquarie Centre Bennelong Bridge (Homebush Bay Bridge)
Nature of infrastructure Two-way cycleway (on the roadway)
*The current governmental decision is to retain the cycleway until 2026
Two-way shared path for cyclists and pedestrians (partially on the roadway and partially off the roadway) Two-way bus lanes & two-way shared path for cyclists and pedestrians
* Emergency vehicles are also permitted.
Context of infrastructure Connecting the Eastern suburbs to Sydney CBD (i.e., Bondi Junction to Surry Hills). The nearby land use is primarily residential and public recreational areas. An east link to the Macquarie Shopping Centre and the area. It connects three metro stations and services commuters. The nearby land use is primarily mixed use, commercial core, business park, and residential (low and high). Connecting the suburbs of Rhodes (Canada Bay Council) and Wentworth Point (City of Parramatta Council), providing convenient access to Marina Square, Rhodes train station, and Rhodes Waterside and Rhodes Central. The nearby land use is primarily mixed use, high density residential, local centre, and some public recreation.
Local Government Area City of Sydney Ryde Canada Bay, Paramatta
Month of opening August 2020 July 2020 May 2016
Length of infrastructure (km) 1.3 2.7 0.3
Number of observers 4 4 2
Observation date 22/02/2024, 02/03/2024, 07/03/2024, 09/03/2024, 13/03/2024, 14/03/2024, 16/03/2024, 21/03/2024, 28/03/2024
Observation time period Weekday 1 (morning)
Morning peak session: 7:30 am – 9:30 am
Morning off-peak session: 10:00 am – 12:00 am

Weekday 2 (afternoon)
Afternoon peak session: 5:00 pm – 7:00 pm
Afternoon off-peak session: 1:30 pm – 3:30pm

Saturday
Morning 10:00 am -12:00 am
Figure 1
Figure 1.Photos of the three sites.

Source: The authors.

A map of a city Description automatically generated
Figure 2.Locations of observers

Source: The authors, based on Google Maps.

3. Findings

There are slightly more cyclists than pedestrians at Moore Park Road Pop-up Cycleway, and substantially more pedestrians than cyclists using the Shared Path from North Ryde Station to Macquarie Centre, as well as the Bennelong Bridge. Detailed data is provided in Table S1 of the Supplemental Information. Generally, more males than females engage in walking and cycling at the observation sites, with the gender imbalance being most pronounced among cyclists—male cyclists outnumber female cyclists by approximately three to one.

Weather effects on gender

The apparent temperature ranges from 10.95 to 29.58 ℃, with a median of 23.43 ℃ during the nine observation days. Table 2 provides a summary of the weather effects on active travel by gender. There are more cyclists and pedestrians on sunny days compared to cloudy or rainy days.

Time of day effects on gender

On weekdays, the number of cyclists and pedestrians is higher during peak hours than during off-peak hours. Detailed data is provided in Table S1 of the Supplemental Information.

Table 2.Data summary of weather effects on gender
Weather Number of observation entries
(each observer in each observation session can only have one entry)
Total cyclist count (%)
(64.1% regular bikes, 35.9% e-bikes)
Total pedestrian count (%)
Female Male Female Male
Cloudy/rainy 8 44 (19.3%) 184 (80.7%) 1069 (53.5%) 928 (46.5%)
Sunny 42 634 (21.7%) 2284 (78.3%) 3468 (47.7%) 3803 (52.3%)
Total 50 678 2468 4537 4731

Regression analyses are shown in Table 3, and to explore the gender effect, in Tables S2-3 in the Supplemental Information. The number of male and female cyclists decreased significantly with increasing apparent temperature. There are significantly more cyclists on weekday afternoons, particularly during peak hours, compared to mornings or Saturdays. There are more users on Saturdays than weekday morning off-peak hours. More pedestrians are observed during peak hours than off-peak hours on weekday afternoons for both genders.

To enhance the statistical power of the analysis, we combined the data from Moore Park Road Pop-up Cycleway and Shared Path from North Ryde Station to Macquarie Centre, as both represent infrastructure situated along existing roads. In this case, the effect of apparent temperature and time of day on cyclists counts becomes larger and more significant than in the all-site analysis. More cyclists are observed during weekday morning peak hours than morning off-peak hours. The significant associations remain for both genders with stronger effects for females, and more female cyclists are observed during weekday afternoon off-peak hours than morning peak hours.

When combining the data from the Shared Path from North Ryde Station to Macquarie Centre and Bennelong Bridge, which are both shared paths, the effects of apparent temperature and time of day on cyclists also become stronger than in the all-site analysis, with largest effects for females. Markedly more cyclists are observed on weekday afternoons, especially in peak hours for females, followed by Saturdays and weekday mornings. Additionally, there are significantly more pedestrians during weekday afternoon peak hours than weekday off-peak hours, for both females and males. The number of male rather than female pedestrians decreases with increased apparent temperature.

We conducted a formal test (Wald test) to determine whether the coefficients from the two regressions (for males and females) differ significantly. The results indicate no significant difference between genders in the relationship between weather/time of day and the number of active travel users. Detailed data is provided in Table S4-6 of the Supplemental Information.

Overall, the data suggest that people prefer cycling and walking during weekday afternoon peak hours especially at cool temperatures in the summer / autumn season, however cycling appears to be less desirable during weekday morning off-peak hours than it is on Saturdays. Female cyclists seem to be more sensitive to weather variations and time of day than males, while male pedestrians using the Shared Path from North Ryde Station to Macquarie Centre and Bennelong Bridge may be more likely to be affected by apparent temperature than females. However, it should be acknowledged that the small sample size in this study may influence the accuracy of our estimates as indicated by the large confidence intervals.

Table 3.The effects of weather and time of day on active travel volume
IRR (95% CI) for cyclist IRR (95% CI) for pedestrian
All sites
(n=50)
MP+MQ (n=40) MQ+BB
(n=30)
All sites (n=50) MQ+BB (n=30)
Weather
Apparent temperature (per 1 ℃ increase) 0.92*
(0.85, 0.98)
0.88***
(0.82, 0.95)
0.33***
(0.23, 0.49)
1.07
(0.99, 1.16)
0.74
(0.54, 1.02)
Time of day
Reference: weekday morning peak session
Weekday morning off-peak session 0.46
(0.19, 1.10)
0.28**
(0.11, 0.71)
0.65
(0.25, 1.69)
0.54
(0.20, 1.46)
0.55
(0.25, 1.21)
Weekday afternoon off-peak session 1.51
(0.49, 4.69)
2.48
(0.77, 7.98)
11.90***
(3.19, 44.48)
0.34
(0.09, 1.22)
0.90
(0.30, 2.70)
Weekday afternoon peak session 4.16*
(1.34, 12.91)
7.22***
(2.25, 23.17)
28.66***
(7.73, 106.29)
0.95
(0.26, 3.42)
2.52
(0.84, 7.59)
Saturday session 1.40
(0.57, 3.43)
1.11
(0.36, 3.40)
6.61**
(2.13, 20.50)
0.69
(0.25, 1.93)
1.11
(0.42, 2.94)
Reference: weekday morning off-peak session
Weekday afternoon off-peak session 3.29*
(1.05, 10.30)
8.89***
(2.70, 29.26)
18.37***
(4.84, 69.68)
0.63
(0.17, 2.26)
1.63
(0.54, 4.92)
Weekday afternoon peak session 9.08***
(2.91, 28.34)
25.88***
(7.88, 84.96)
44.23***
(11.75, 166.53)
1.75
(0.48, 6.32)
4.60**
(1.53, 13.83)
Saturday session 3.05*
(1.23, 7.54)
3.98*
(1.29, 12.34)
10.19***
(3.25, 32.00)
1.28
(0.46, 3.58)
2.03
(0.77, 5.36)
Reference: weekday afternoon off-peak session
Weekday afternoon peak session 2.76*
(1.15, 6.58)
2.91*
(1.17, 7.26)
2.41
(0.95, 6.10)
2.80*
(1.04, 7.54)
2.81*
(1.27, 6.23)
Reference: weekday afternoon peak session
Saturday session 0.34*
(0.11, 0.98)
0.15**
(0.04, 0.58)
0.23**
(0.08, 0.70)
0.73
(0.22, 2.49)
0.44
(0.17, 1.13)

Notes: IRR, incidence rate ratio. CI, confidence interval. MP, Moore Park Road Pop-up Cycleway. MQ, Shared Path from North Ryde Station to Macquarie Centre. BB, Bennelong Bridge. ***, p<0.001. **, p<0.01. *, p<0.05. Statistically significant results (p<0.05) are shown in bold.

To summarise, at the observation sites, there are more males than females engaged in walking and cycling. Cyclists exhibited a greater gender difference compared to the number of pedestrians. Weather affects active traffic volume: active travel volumes decrease with increased apparent temperature, and this is particularly significant for cyclists, indicating that cycling is very sensitive to weather conditions. Time of day also affects active traffic volume: afternoon peak hours have more traffic volume than all weekday off-peak hours, indicating that cycling and walking are both sensitive to time of day. Future studies with longer observational duration and multiple sites are needed to confirm these findings.


Acknowledgements

The work reported in this paper is funded by an Australian Research Council Linkage grant with Transport for New South Wales (LP210100272).

We would like to acknowledge Prof Theo Niyonsenga from the University of Canberra for his valuable advice on statistical analysis.

Submitted: August 05, 2024 AEST

Accepted: December 06, 2024 AEST

References

Australian Government Bureau of Meteorology. 2024. “Climate Data Online.” http:/​/​www.bom.gov.au/​climate/​data/​#mapoption.
Burchfield, R. A., E. C. Fitzhugh, and D. R. Bassett. 2012. “The Association of Trail Use With Weather-Related Factors on an Urban Greenway.” Journal of Physical Activity and Health 9 (2): 188–97. https:/​/​doi.org/​10.1123/​jpah.9.2.188.
Google Scholar
de Kruijf, J., P. van der Waerden, T. Feng, L. Böcker, D. van Lierop, D. Ettema, and M. Dijst. 2021. “Integrated Weather Effects on E-Cycling in Daily Commuting: A Longitudinal Evaluation of Weather Effects on e-Cycling in the Netherlands.” Transportation Research Part A-Policy and Practice 148:305–15. https:/​/​doi.org/​10.1016/​j.tra.2021.04.003.
Google Scholar
Guo, Z., N. H. M. Wilson, and A. Rahbee. 2007. “Impact of Weather on Transit Ridership in Chicago, Illinois.” Transportation Research Record 2034 (1): 3–10. https:/​/​doi.org/​10.3141/​2034-01.
Google Scholar
Jáuregui, A., E. V. Lambert, J. Panter, C. Moore, and D. Salvo. 2021. “Scaling up Urban Infrastructure for Physical Activity in the COVID-19 Pandemic and Beyond.” The Lancet 398 (10298): 370–72. https:/​/​doi.org/​10.1016/​S0140-6736(21)01599-3.
Google Scholar
Marshall, A. 2022. “The Pandemic Bike Boom Survives—in Cities That Stepped Up.” Wired. https:/​/​www.wired.com/​story/​the-pandemic-bike-boom-survives-in-cities-that-stepped-up/​.
Singhal, A., C. Kamga, and A. Yazici. 2014. “Impact of Weather on Urban Transit Ridership.” Transportation Research Part A: Policy and Practice 69:379–91. https:/​/​doi.org/​10.1016/​j.tra.2014.09.008.
Google Scholar
Steadman, R. G. 1994. “Norms of Apparent Temperature in Australia.” Aust. Met. Mag 43:1–16.
Google Scholar
Zhao, J. B., J. Wang, Z. M. Xing, X. Luan, and Y. Jiang. 2018. “Weather and Cycling: Mining Big Data to Have an in-Depth Understanding of the Association of Weather Variability with Cycling on an off-Road Trail and an on-Road Bike Lane.” Transportation Research Part A-Policy and Practice 111:119–35. https:/​/​doi.org/​10.1016/​j.tra.2018.03.001.
Google Scholar

This website uses cookies

We use cookies to enhance your experience and support COUNTER Metrics for transparent reporting of readership statistics. Cookie data is not sold to third parties or used for marketing purposes.

Powered by Scholastica, the modern academic journal management system