Loading [Contrib]/a11y/accessibility-menu.js
Skip to main content
null
Findings
  • Menu
  • Articles
    • Energy Findings
    • Resilience Findings
    • Safety Findings
    • Transport Findings
    • Urban Findings
    • All
  • For Authors
  • Editorial Board
  • About
  • Blog
  • covid-19
  • search

RSS Feed

Enter the URL below into your favorite RSS reader.

https://findingspress.org/feed
Transport Findings
December 31, 2024 AEST

Home neighborhood, Driving Exposure and Safety among Older Adults: a Mediation Analysis from the LongROAD Study

Xiao Shi, Lawrence D. Frank, Linda L. Hill, David Strogatz,
older adultsdriving safetytravel patternbuilt environmenthome neighborhoodmediation analysishigh-speed travel
Copyright Logoccby-sa-4.0 • https://doi.org/10.32866/001c.126669
Findings
Shi, Xiao, Lawrence D. Frank, Linda L. Hill, and David Strogatz. 2024. “Home Neighborhood, Driving Exposure and Safety among Older Adults: A Mediation Analysis from the LongROAD Study.” Findings, December. https:/​/​doi.org/​10.32866/​001c.126669.
Save article as...▾
Download all (3)
  • Figure 1. Multiple Mediation Analysis on Urbanicity using SEM for (a) Very High-Speed Driving, (b) Rapid Deceleration, (C) Right-to-Left Turn Ratio.
    Download
  • Figure 2. Multiple Mediation Analysis on Built Environment Features using SEM for (a) Very High-Speed Driving, (b) Rapid Deceleration, (C) Right-to-Left Turn Ratio.
    Download
  • Supplement Material Table S1-S3
    Download

Sorry, something went wrong. Please try again.

If this problem reoccurs, please contact Scholastica Support

Error message:

undefined

View more stats

Abstract

Despite the growing number of older adult drivers, knowledge on factors influencing their driving safety from device-collected behavior data in naturalistic driving environment is limited. This study utilizes GPS tracked driving data of 1,200 older adults in the US to examine the link between home neighborhood environment, driving exposure, and driving safety behaviors. Structural equation model results show that urban older adults exhibited more frequent events of very high-speed driving (>80 mile/h, 130 km/h), rapid decelerations, and higher right-to-left turn ratios than their suburban and rural counterparts. This is partially explained by differences in driving exposure (i.e., more trips on high-speed roads, during nighttime, and shorter distances). Notably, living in neighborhoods with higher auto-oriented road densities and more nighttime destinations contribute substantially to unsafe driving behaviors.

1. QUESTIONS

Driving allows older adults to maintain mobility and independence (Musselwhite and Hebba 2010, 2018), yet age-related functional decline compromises driving abilities and leads to increased crash risks (Anstey et al. 2005; Langford and Koppel 2006; Rubin et al. 2007). In the US, older drivers have the highest crash rates among all adult drivers, with the number of older drivers continuing to grow (Cicchino and McCartt 2014). Home neighborhood where older adults reside can influence driving safety by impacting how much they drive, as well as when, where, and under what conditions (i.e. driving exposure) (Hirsch et al. 2014; Molnar et al. 2018; Yang et al. 2018). Despite the potential to inform safety programs and aging-friendly neighborhood design, such impacts are rarely quantified (Boot, Stothart, and Charness 2013; Molnar et al. 2018; Payyanadan, Lee, and Grepo 2018). Using global positioning system (GPS) driving data on 1,200 older drivers in the US over two years, we examined the following questions:

  1. Are there differences in driving safety behaviors among older adults living in urban, suburban, and rural neighborhoods?

  2. To what extent does driving exposure (e.g. more trips on high-speed roads, during nighttime) explain such differences?

  3. What built environment factors in home neighborhood matter for driving safety for older adults?

2. METHODS

Study Design

This paper used data from the San Diego, CA and Cooperstown, NY study sites of the Longitudinal Research on Aging Drivers (LongROAD) prospective cohort study, with details described elsewhere (Hill et al. 2020; the LongROAD Research Team et al. 2017). Six hundred drivers aged 65-79 years were recruited at each site between July 2015 and March 2017. Demographic information was collected by self-report at baseline interview. Health and functional assessments were conducted during in-person visits. Following informed consent, two years of driving data were collected using GPS devices installed in participants’ vehicles. Census block group level measures of built environment features were obtained from the National Environmental Database (NED)[1] and the Smart Location Database (SLD)[2] and linked to participants based on home address (Chapman et al. 2021; Wali et al. 2021). Both study sites exhibited built environment characteristics representative of a sprawled, car-dependent urban context, where highways traversing urban centers.

Variables

The unit of analysis was the participant. Three driving safety behavior outcomes derived from GPS data were studied, including very high-speed driving (number of events >80 mph for at least 8 seconds per 1000 miles driven; equivalently >130 kmph for 8 seconds per 1600 km), rapid deceleration (number of deceleration events ≥0.35 g per 1000 miles driven; or equivalently 1600km driven); and right-to-left turn ratio, a measure indicating avoidance of challenging situations (i.e., left turns across incoming traffic).

The main predictor, urbanicity was intrazonal activity zone type defined using activity density (i.e., households and jobs) and was categorized into three levels: urban (>6 units/acre or equivalently 15 units/hectare), suburban (0.5-6 units/acre or equivalently 1-15 units/hectare ), and rural (<0.5 units/acre or equivalently 1units/hectare)(Chapman et al. 2021). Built environment factors hypothesized to impact older adult driving exposures(Lym, Kim, and Chen 2022) were tested as secondary predictors, including daytime destinations, nighttime destinations, healthcare facilities, and auto-oriented road density. Definitions are detailed in Table 1.

Table 1.Participant Driving Patterns, Driving Safety, and Home Neighborhood Built Environment Characteristics.
RURAL SUBURBAN URBAN Overall
(N=487) (N=430) (N=283) (N=1200)
DRIVING SAFETY BEHAVIORS
Very High-Speed Driving Number of events with speed >80mph (130kmph) for at least 8 seconds per 1000 miles (1600km) driven
Mean (SD) 0.539 (0.794) 1.45 (1.29) 1.67 (1.34) 1.13 (1.23)
Median [Min, Max] 0.129 [0, 3.98] 1.18 [0, 4.77] 1.49 [0, 5.10] 0.635 [0, 5.10]
Missing 2 (0.4%) 0 (0%) 1 (0.4%) 3 (0.3%)
Rapid Decelerations Number of deceleration events ≥0.35 g per 1000 miles (1600km) driven
Mean (SD) 1.18 (0.616) 1.65 (0.763) 1.85 (0.766) 1.51 (0.761)
Median [Min, Max] 1.09 [0, 3.99] 1.51 [0, 4.39] 1.79 [0, 4.20] 1.41 [0, 4.39]
Missingness 2 (0.4%) 0 (0%) 1 (0.4%) 3 (0.3%)
Right-to-left Turn Ratio The ratio of right turns versus left turns
Mean (SD) 0.875 (0.113) 0.915 (0.130) 0.935 (0.118) 0.904 (0.123)
Median [Min, Max] 0.861 [0.547, 1.25] 0.903 [0.483, 1.39] 0.930 [0.594, 1.38] 0.897 [0.483, 1.39]
Missingness 2 (0.4%) 0 (0%) 1 (0.4%) 3 (0.3%)
TRAVEL PATTERNS
Total Trips Total number of trips in year
Mean (SD) 1340 (648) 1350 (659) 1270 (609) 1330 (643)
Median [Min, Max] 1270 [4.50, 6160] 1300 [15.0, 3740] 1220 [21.5, 3750] 1260 [4.50, 6160]
Missingness 3 (0.6%) 0 (0%) 1 (0.4%) 4 (0.3%)
Total Miles Total number of miles driven in year (1 mile = 1.61km)
Mean (SD) 10700 (5560) 8060 (4730) 7030 (4390) 8890 (5240)
Median [Min, Max] 10400 [48.0, 38200] 7450 [137, 34500] 6150 [45.5, 24200] 8120 [45.5, 38200]
Missingness 3 (0.6%) 0 (0%) 1 (0.4%) 4 (0.3%)
Total Minutes Total minutes of driving in year
Mean (SD) 19700 (9640) 17400 (8800) 16700 (9320) 18200 (9350)
Median [Min, Max] 18700 [69.2, 77400] 16700 [293, 56600] 15300 [163, 67500] 17300 [69.2, 77400]
Missingness 3 (0.6%) 0 (0%) 1 (0.4%) 4 (0.3%)
Trip Distance Total number of miles driven in year divided by total number of trips in year (1 mile = 1.61km)
Mean (SD) 8.29 (2.92) 6.10 (2.48) 5.62 (2.58) 6.88 (2.94)
Median [Min, Max] 7.94 [1.75, 18.6] 5.68 [1.52, 16.6] 5.18 [1.57, 19.4] 6.49 [1.52, 19.4]
Missingness 2 (0.4%) 0 (0%) 1 (0.4%) 3 (0.3%)
Trip Duration Total driving minutes in month divided by total number of trips in year
Mean (SD) 15.1 (4.16) 13.2 (3.42) 13.3 (3.88) 14.0 (3.96)
Median [Min, Max] 14.8 [5.68, 34.5] 12.7 [5.79, 24.1] 13.0 [6.15, 41.2] 13.5 [5.68, 41.2]
Missingness 2 (0.4%) 0 (0%) 1 (0.4%) 3 (0.3%)
% Trips at Night Percentage of trips during which at least 80% of trip was during nighttime in year, where nighttime was defined as civil twilight or a solar angle greater than 96 degrees
Mean (SD) 5.09 (4.16) 6.98 (5.09) 7.48 (5.93) 6.33 (5.06)
Median [Min, Max] 4.38 [0, 33.6] 5.90 [0, 38.0] 6.44 [0, 49.6] 5.26 [0, 49.6]
Missingness 2 (0.4%) 0 (0%) 1 (0.4%) 3 (0.3%)
% Trips in AM Peak Percentage of trips in year during 7-9 AM on weekdays
Mean (SD) 7.40 (5.03) 7.86 (5.31) 7.71 (4.86) 7.63 (5.09)
Median [Min, Max] 6.48 [0, 44.1] 6.96 [0, 38.5] 6.95 [0, 29.2] 6.77 [0, 44.1]
Missingness 2 (0.4%) 0 (0%) 1 (0.4%) 3 (0.3%)
% Trips in PM Peak Percentage of trips in year during 4-6 PM on weekdays
Mean (SD) 8.76 (4.34) 9.36 (4.23) 8.86 (3.95) 9.00 (4.22)
Median [Min, Max] 8.37 [0, 36.9] 8.90 [0.312, 33.1] 8.72 [0, 19.5] 8.66 [0, 36.9]
Missingness 2 (0.4%) 0 (0%) 1 (0.4%) 3 (0.3%)
% Trips on High-Speed Roads Percentage of trips in year where 20% of distance travelled was at a speed of 60 mph (97km) or greater
Mean (SD) 8.66 (7.65) 17.2 (12.1) 20.6 (11.5) 14.5 (11.5)
Median [Min, Max] 6.75 [0, 41.8] 14.7 [0, 61.0] 19.3 [0.159, 58.6] 11.5 [0, 61.0]
Missingness 2 (0.4%) 0 (0%) 1 (0.4%) 3 (0.3%)
% Trips near Home Percent of trips traveled in month within 15 miles (24 km) of home
Mean (SD) 74.8 (14.0) 83.4 (11.2) 85.7 (10.6) 80.4 (13.1)
Median [Min, Max] 76.5 [15.1, 95.5] 87.1 [35.5, 100] 89.5 [35.1, 98.1] 84.1 [15.1, 100]
Missingness 2 (0.4%) 0 (0%) 1 (0.4%) 3 (0.3%)
BUILT ENVIRONMENT CHARACTERISTICS
Daytime Destinations Public administration, and education employment density (jobs/acre) on unprotected land
Mean (SD) 0.00888 (0.0206) 0.477 (0.587) 3.27 (10.6) 0.947 (5.31)
Median [Min, Max] 0.00178 [0, 0.243] 0.204 [0, 2.31] 0.781 [0, 108] 0.0727 [0, 108]
Nighttime Destinations Retail, food, and entertainment employment density (jobs/acre) on unprotected land
Mean (SD) 0.00632 (0.0122) 0.329 (0.448) 2.86 (4.28) 0.796 (2.39)
Median [Min, Max] 0.00168 [0, 0.0700] 0.0885 [0, 1.88] 1.20 [0, 24.6] 0.0230 [0, 24.6]
Health Facilities Health care employment density (jobs/acre) on unprotected land
Mean (SD) 0.00225 (0.00606) 0.204 (0.361) 2.27 (8.11) 0.609 (4.05)
Median [Min, Max] 0.000414 [0, 0.0725] 0.0667 [0, 2.30] 0.407 [0, 88.5] 0.0322 [0, 88.5]
Auto-oriented Road Density Network density: miles of auto-oriented links per square mile
Mean (SD) 0.632 (0.286) 1.49 (2.27) 2.47 (3.17) 1.37 (2.18)
Median [Min, Max] 0.581 [0, 2.15] 0.531 [0, 13.1] 0.930 [0, 21.1] 0.581 [0, 21.1]

Driving patterns include total trips, total miles, total minutes, trip distance, trip duration, percentage of trips at night, percentage of trips in AM peak, percentage of trips in PM peak, percentage of trips on high-speed roads, and percentage of trips near home, Table 1. Covariates include age, gender, race, education, marriage status, work status, physical health, and cognitive function, Table 1.

Statistical Analysis

Ordinary Least Squares regression (OLS) analysis was used to assess associations between urbanicity, driving patterns, and safety outcomes. Observations with missing values (8.6%) were dropped from the analysis, resulting in a final sample of 1096. Due to skewed distributions, deceleration and high-speed driving events were log-transformed. Coefficients were reported as relative rates (for high-speed driving and decelerations) or relative ratios (for right-to-left turns), showing the percentage change in the outcome associated with one unit change in the predictor. Only driving exposure variables with significant association with outcomes in addition to urbanicity, indicating potential of mediation effects, were kept (Shrout and Bolger 2002). Structural equation modeling (SEM) was used to conduct the mediation analysis, with results reported and visualized in path diagrams. Bootstrap resampling with 95% bias-corrected confidence intervals was used (Kline 2023). Percentage of contribution is derived by dividing standardized coefficients by total effects. All models controlled for participant sociodemographic characteristics, physical and cognitive health. All statistical analyses were conducted in R studio environment.

3. FINDINGS

Driving Exposure and Safety Differ among Urban, Suburban, and Rural Older Adults

Older adults living in urban neighborhoods, on average, had more frequent events of very high-speed driving (RR=2.75, p<0.001), more frequent rapid decelerations (1.72, p<0.001), and higher right-to-left turn ratio (RR=1.06, p<0.001) than their counterparts living in rural neighborhoods, Table 2. Similar patterns were observed in older adults living in suburban locations (2.12; 1.42; 1.04).

Table 2.Model-based Relationship between Urbanicity and Driving Outcomes, Adjusted for Covariatesa
Very High-speed Drivingb Rapid Decelerationb Right-to-Left Turn
RR p RR p RR p
Urban 2.75 <0.001 1.72 <0.001 1.06 <0.001
Suburban 2.12 <0.001 1.42 <0.001 1.04 <0.001
Rural Reference Reference Reference
R2 19.18% 19.45% 5.2%

a. Models adjusted for participant age, gender, race, education, income, work status, marriage status, physical and cognitive health. b. Outcomes were log transformed.

Trips made by urban and suburban older adults were, when compared with rural older adults, shorter in distance (-2.57 miles or -4.14km, p<0.001; -2.25 miles or -3.62 km, p<0.001) and duration (-2.25 min, p<0.001; -1.99 min, p<0.001), Table 3. They also drive more often on high-speed roads (10.39%, p<0.001; 6.51%, p<0.001), at night (2.18%, p<0.001; 1.70%, p<0.001), and within 15 miles of home (10.94%, p<0.001, 9.14%, p<0.001). No significant differences were observed for total number of trips, and percentage of trips in AM or PM peaks. An urban-suburban-rural gradient was observed in all driving exposure and safety behavior outcomes except for trip duration and those outcomes without differences.

Table 3.Model-based Relationship between Urbanicity and Travel Pattern, Adjusted for Covariatesa
Total Miles Total Minutes Total Trips
Coef. p Coef. p Coef. p
Urban -7274 <0.001 -5666 <0.001 -90 0.39
Suburban -5730 <0.001 -4929 0.001 58 0.54
Rural Reference Reference Reference
R2 15.41% 6.54% 4.58%
Miles per Trip Minutes per Trip % on High-Speed Road
Coef. p Coef. p Coef. p
Urban -2.57 <0.001 -1.99 <0.001 10.39 <0.001
Suburban -2.25 <0.001 -2.25 <0.001 6.51 <0.001
Rural Reference Reference Reference
R2 20.75% 8.86% 24.58%
% Trips at Night % Trip in AM Peak % Trip in PM Peak
Coef. p Coef. p Coef. p
Urban 2.18 <0.001 0.32 0.43 -1.44 0.92
Suburban 1.70 <0.001 0.41 0.26 20.7 0.09
Rural Reference Reference Reference
R2 10.45% 5.17% 5.34%
% Trips near home
Coef. p
Urban 10.94 <0.001
Suburban 9.14 <0.001
Rural Reference
R2 15.96%

a. Models adjusted for participant age, gender, race, education, income, work status, marriage status, physical and cognitive health.

Driving Exposure Partially Explains Differences in Driving Safety

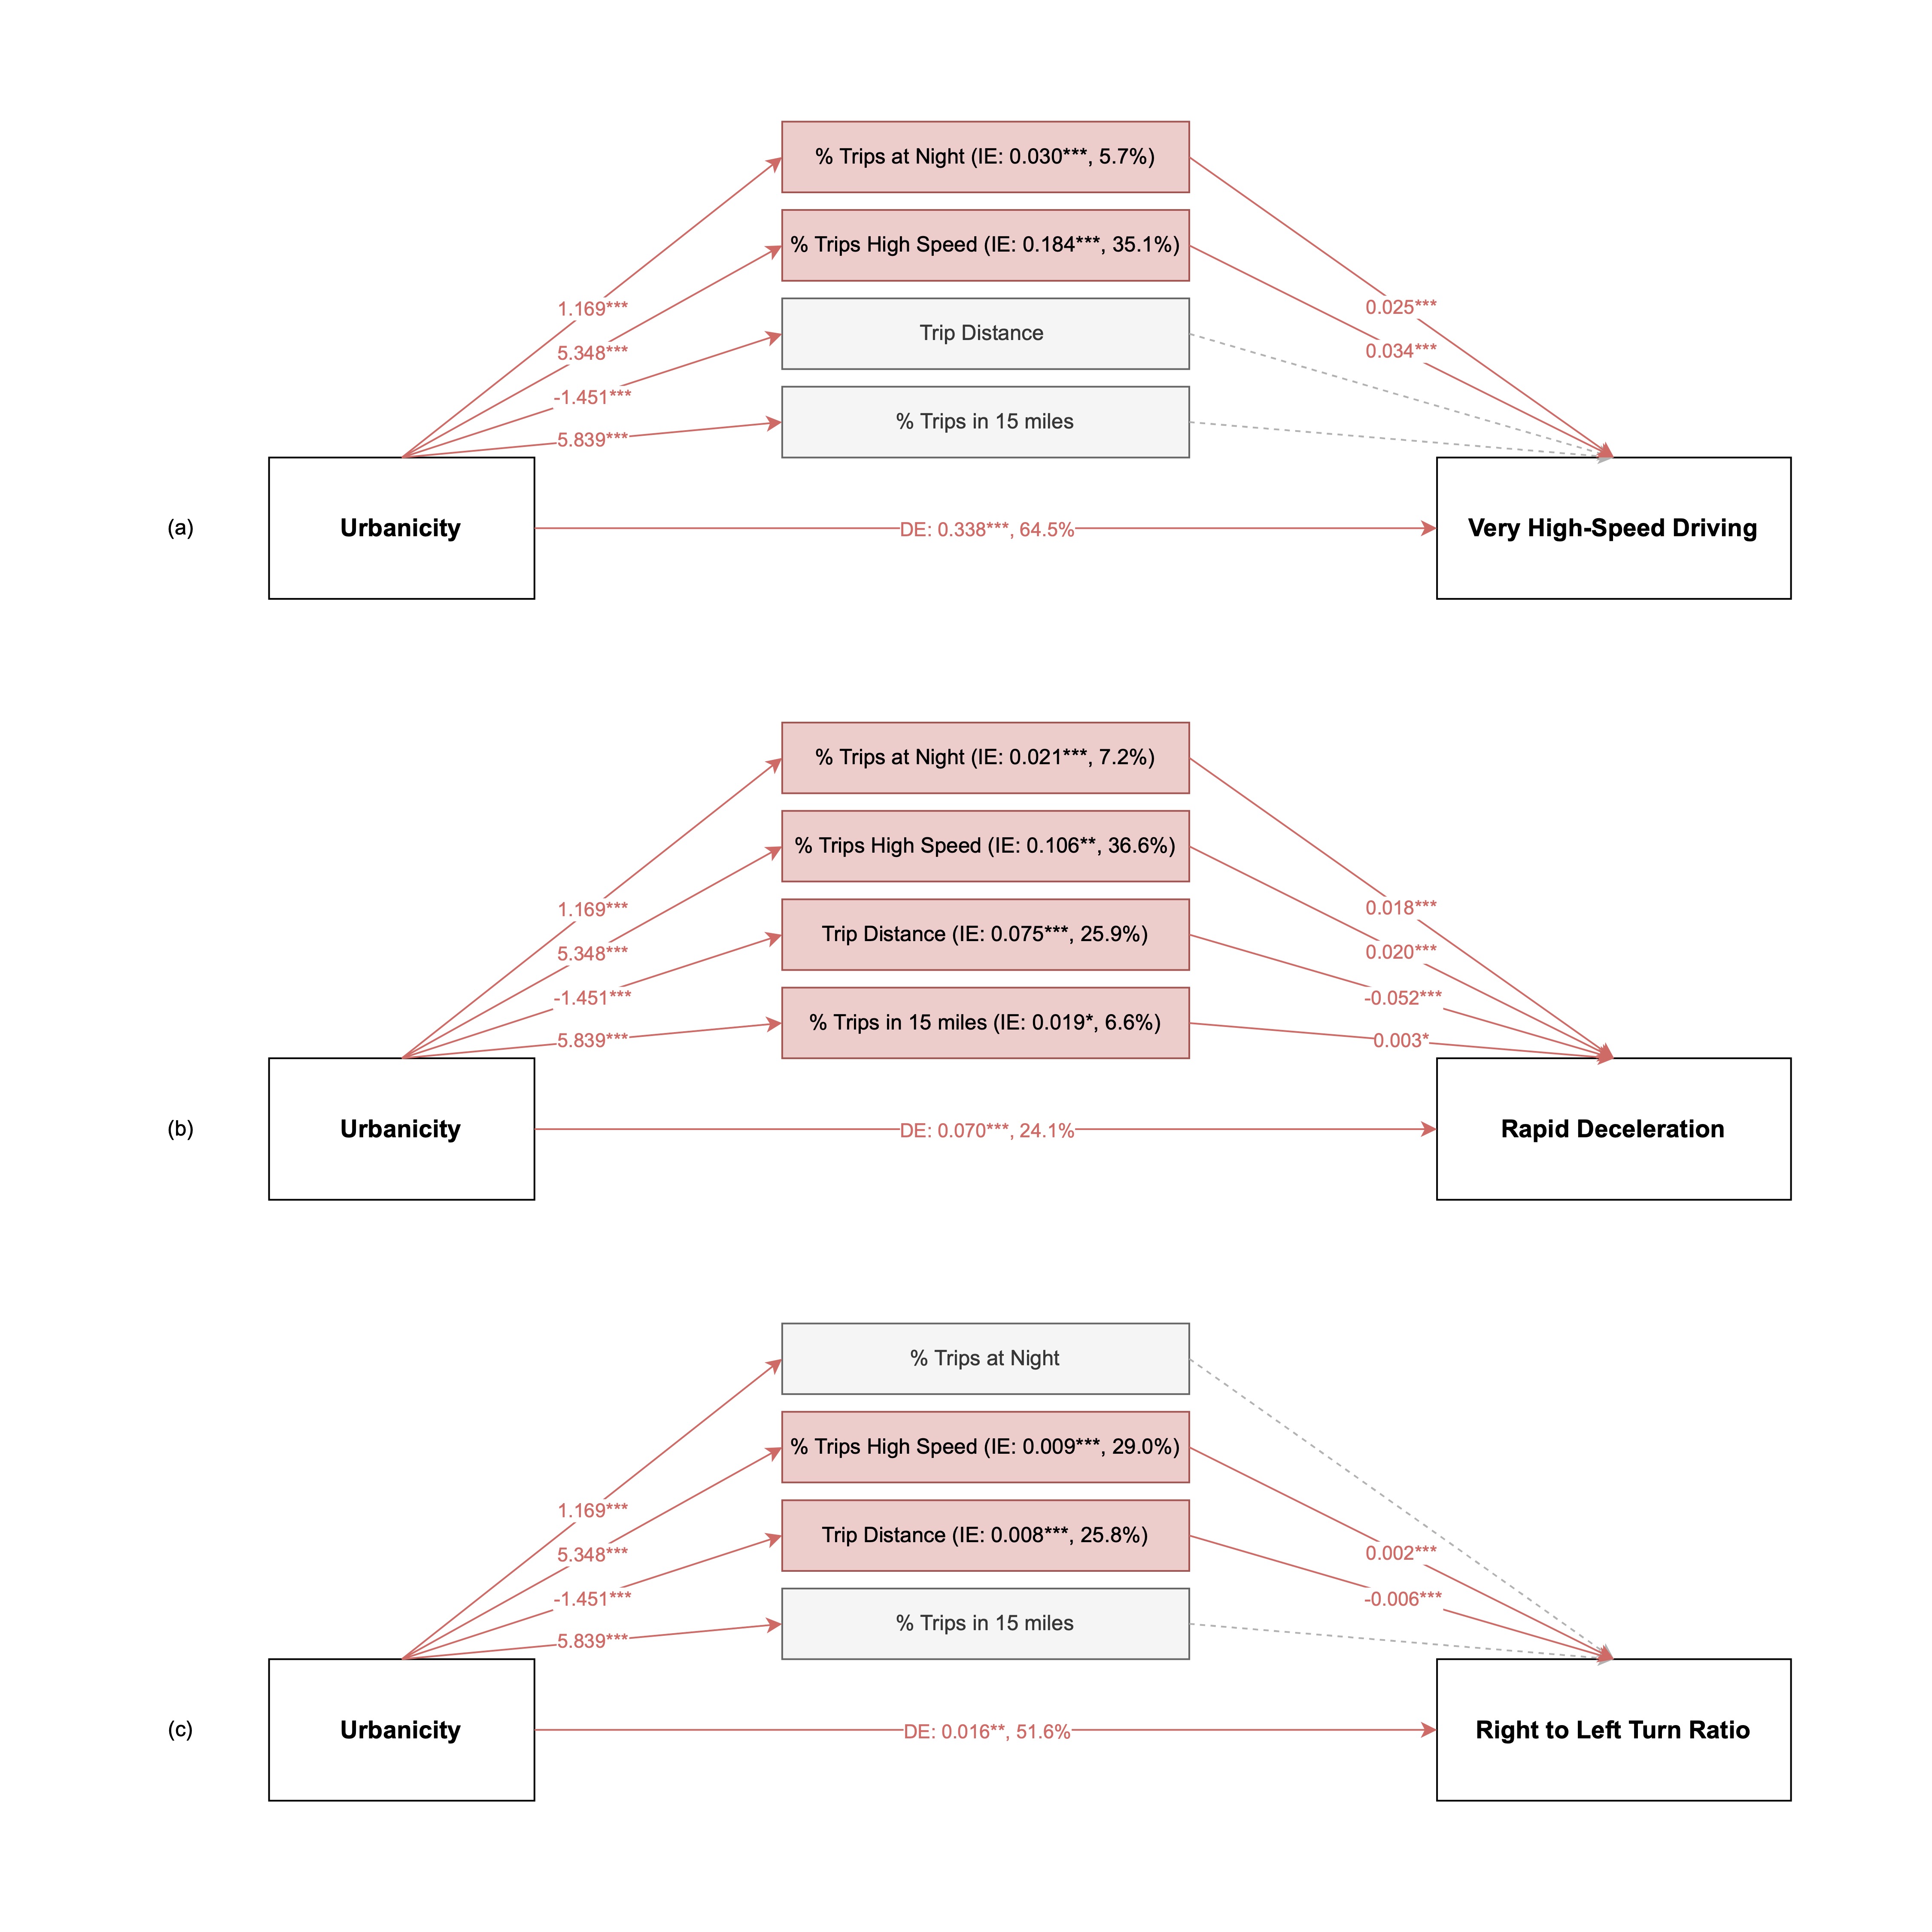
SEM results suggested that a higher frequency of very high-speed driving events observed among urban older adults were partially explained by driving more often on high-speed roads (35.1%) and during nighttime (5.7%), Figure 1 Table S2. More rapid decelerations were partially mediated by driving more on high-speed roads (36.6%), during nighttime (7.2%), shorter distance (25.9%), as well as driving more often within 15 miles of home (6.6%). Results suggest that more frequent unsafe driving behaviors observed among urban older adults compared to those living in suburban and rural areas are partially due to driving more often in conditions that are challenging (i.e., on high-speed roads, at night), as well as in environments that are familiar to them (i.e., near home). Higher frequency of right versus left turns among urban older adults was partially mediated by having more trips on high-speed roads (29.0%), which might be a result of fewer left turns and exits on high-speed roads and self-regulation.

Figure 1
Figure 1.Multiple Mediation Analysis on Urbanicity using SEM for (a) Very High-Speed Driving, (b) Rapid Deceleration, (C) Right-to-Left Turn Ratio.

Associations not significant are greyed out. DE: direct effect; IE: indirect effect.

Built Environment Factors Influence Driving Safety

Auto-oriented road density, an indicator for the prevalence of high-speed roads within home neighborhood was found to associate with very high-speed driving events (0.055, 41.4%), rapid deceleration (0.033, 67.3%), and higher frequency of right versus left turns (0.003, 30.0%), mediated by the percentage of trips on high-speed roads and trip distance.

Density of nighttime destinations near home, approximated using the density of retail and restaurant services where many nighttime events happen (Evans 2020), was positively associated with events of very high-speed driving (0.007, 5.3%), rapid deceleration (0.016, 32.7%), and right-to-left-turn ratios (0.001, 10.0%), mediated by trips at night and trip distance.

Density of daytime destinations was approximated using the density of education, service, and public administration jobs that take place during the daytime. This measure was only associated with higher right-to-left turn ratios (0.002, 20.0%), indicating that those destinations were not related to unsafe driving behaviors yet older drivers showed a reluctance to make left turns against oncoming traffic when driving around or to these destinations. Density of healthcare facilities was only associated with very high-speed driving events (0.029, 21.8%), which might be explained by these facilities being located in areas closer to highway entrances and exits (Tsui et al. 2020).

Figure 2
Figure 2.Multiple Mediation Analysis on Built Environment Features using SEM for (a) Very High-Speed Driving, (b) Rapid Deceleration, (C) Right-to-Left Turn Ratio.

Associations not significant are greyed out. DE: direct effect; IE: indirect effect.

Conclusion and Implications

This study is among the first to quantify the impact of neighborhood environments on driving exposure and safety for older adult drivers using GPS collected driving data. Results show that older adults in urban neighborhoods have more frequent unsafe driving behaviors (i.e., very high-speed driving and rapid deceleration) but also more frequent behaviors indicating insecurity (i.e., right-to-left turn ratio) than their counterparts living in suburban and rural neighborhoods. The observed differences for urban older adults are partially explained by driving more often in challenging conditions (i.e., at night and on high-speed roads) and in familiar environments (i.e., near home). Density of high-speed roads and nighttime destinations near home are found to relate to unsafe behaviors observed for urban drivers while daytime destinations are related to behaviors indicating insecurities. We recommend that senior drivers living in urban neighborhoods consider reducing driving in challenging conditions and be cautious when driving in familiar environments. We also advocate for neighborhood design decisions that promote safe driving (e.g., lower speed limit). Lastly, we want to note that the urban context measured in this study captured a relatively car-dependent environment and we suggest readers interpret with caution.


ACKNOWLEDGEMENTS

The Longitudinal Research on Aging Drivers (LongROAD) Study is sponsored by the AAA Foundation for Traffic Safety. The authors would like to thank Jim Chapman and Eric Fox for their support. The contents of the manuscript are solely the responsibility of the authors and do not necessarily reflect the official views of the funding agencies.


  1. Funded by the Robert Wood Johnson Foundation for the Culture of Health’s Annual Report Card

  2. Funded by the US Environmental Protection Agency as part of the Smart Location Database produced by Urban Design 4 Health, Incx.

Submitted: July 04, 2024 AEST

Accepted: November 29, 2024 AEST

References

Anstey, K. J., J. Wood, S. Lord, and J. G. Walker. 2005. “Cognitive, Sensory and Physical Factors Enabling Driving Safety in Older Adults.” Clinical Psychology Review 25 (1): 45–65. https:/​/​doi.org/​10.1016/​j.cpr.2004.07.008.
Google Scholar
Boot, W. R., C. Stothart, and N. Charness. 2013. “Improving the Safety of Aging Road Users: A Mini-Review.” Gerontology 60 (1): 90–96. https:/​/​doi.org/​10.1159/​000354212.
Google Scholar
Chapman, J., E. H. Fox, W. Bachman, L. D. Frank, J. Thomas, and A. R. Reyes. 2021. “Smart Location Database Technical Documentation and User Guide, Version 3.0.” 2021–06. Environmental Protection Agency EPA.
Cicchino, J. B., and A. T. McCartt. 2014. “Trends in Older Driver Crash Involvement Rates and Survivability in the United States: An Update.” Accident Analysis & Prevention 72:44–54. https:/​/​doi.org/​10.1016/​j.aap.2014.06.011.
Google Scholar
Evans, G. 2020. “Events, Cities and the Night-Time Economy.” In The Routledge Handbook of Events, 554–69. Routledge. https:/​/​doi.org/​10.4324/​9780429280993-36.
Google Scholar
Hill, L. L., H. Andrews, G. Li, C. G. DiGuiseppi, M. E. Betz, D. Strogatz, P. Pepa, et al. 2020. “Medication Use and Driving Patterns in Older Drivers: Preliminary Findings from the LongROAD Study.” Injury Epidemiology 7 (1): 38. https:/​/​doi.org/​10.1186/​s40621-020-00265-y.
Google Scholar
Hirsch, J. A., M. Winters, P. Clarke, and H. McKay. 2014. “Generating GPS Activity Spaces That Shed Light upon the Mobility Habits of Older Adults: A Descriptive Analysis.” International Journal of Health Geographics 13 (1): 1–14. https:/​/​doi.org/​10.1186/​1476-072X-13-51.
Google Scholar
Kline, R. B. 2023. Principles and Practice of Structural Equation Modeling. Guilford publications.
Google Scholar
Langford, J., and S. Koppel. 2006. “Epidemiology of Older Driver Crashes–Identifying Older Driver Risk Factors and Exposure Patterns.” Transportation Research Part F: Traffic Psychology and Behaviour 9 (5): 309–21. https:/​/​doi.org/​10.1016/​j.trf.2006.03.005.
Google Scholar
Lym, Y., S. Kim, and Z. Chen. 2022. “The Influence of Urbanicity and Built Environment on the Frequency of Distracted Driving-Related Crashes: A Multi-State Comparison.” International Journal of Urban Sciences 26 (2): 185–212. https:/​/​doi.org/​10.1080/​12265934.2021.1946418.
Google Scholar
Molnar, L. J., D. W. Eby, J. M. Vivoda, S. E. Bogard, J. S. Zakraksek, R. S. Louis, N. Zanier, L. H. Ryan, D. LeBlanc, and J. Smith. 2018. “The Effects of Demographics, Functioning, and Perceptions on the Relationship between Self-Reported and Objective Measures of Driving Exposure and Patterns among Older Adults.” Transportation Research Part F: Traffic Psychology and Behaviour 54:367–77. https:/​/​doi.org/​10.1016/​j.trf.2018.02.026.
Google Scholar
Musselwhite, C., and H. Hebba. 2010. “Mobility, Accessibility and Quality of Later Life.” Quality in Ageing and Older Adults. https:/​/​doi.org/​10.5042/​qiaoa.2010.0153.
Google Scholar
———. 2018. “Older People’s Travel and Mobility Needs: A Reflection of a Hierarchical Model 10 Years On.” Quality in Ageing and Older Adults. https:/​/​doi.org/​10.1108/​QAOA-12-2017-0054.
Google Scholar
Payyanadan, R. P., J. D. Lee, and L. C. Grepo. 2018. “Challenges for Older Drivers in Urban, Suburban, and Rural Settings.” Geriatrics 3 (2). https:/​/​doi.org/​10.3390/​geriatrics3020014.
Google Scholar
Rubin, G. S., E. S. Ng, K. Bandeen-Roche, P. M. Keyl, E. E. Freeman, S. K. West, and S. P. Team. 2007. “A Prospective, Population-Based Study of the Role of Visual Impairment in Motor Vehicle Crashes among Older Drivers: The SEE Study.” Investigative Ophthalmology & Visual Science 48 (4): 1483–91. https:/​/​doi.org/​10.1167/​iovs.06-0474.
Google Scholar
Shrout, P. E., and N. Bolger. 2002. “Mediation in Experimental and Nonexperimental Studies: New Procedures and Recommendations.” Psychological Methods 7 (4): 422. https:/​/​doi.org/​10.1037/​1082-989X.7.4.422.
Google Scholar
the LongROAD Research Team, G. Li, D. W. Eby, R. Santos, T. J. Mielenz, L. J. Molnar, D. Strogatz, et al. 2017. “Longitudinal Research on Aging Drivers (LongROAD): Study Design and Methods.” Injury Epidemiology 4 (1): 22. https:/​/​doi.org/​10.1186/​s40621-017-0121-z.
Google Scholar
Tsui, J., J. A. Hirsch, F. J. Bayer, J. W. Quinn, J. Cahill, D. Siscovick, and G. S. Lovasi. 2020. “Patterns in Geographic Access to Health Care Facilities Across Neighborhoods in the United States Based on Data From the National Establishment Time-Series Between 2000 and 2014.” JAMA Network Open 3 (5): e205105. https:/​/​doi.org/​10.1001/​jamanetworkopen.2020.5105.
Google Scholar
Wali, B., L. D. Frank, J. E. Chapman, and E. H. Fox. 2021. “Developing Policy Thresholds for Objectively Measured Environmental Features to Support Active Travel.” Transportation Research Part D: Transport and Environment 90:102678. https:/​/​doi.org/​10.1016/​j.trd.2020.102678.
Google Scholar
Yang, Y., Y. Xu, D. A. Rodriguez, Y. Michael, and H. Zhang. 2018. “Active Travel, Public Transportation Use, and Daily Transport among Older Adults: The Association of Built Environment.” Journal of Transport & Health 9:288–98. https:/​/​doi.org/​10.1016/​j.jth.2018.01.012.
Google Scholar

This website uses cookies

We use cookies to enhance your experience and support COUNTER Metrics for transparent reporting of readership statistics. Cookie data is not sold to third parties or used for marketing purposes.

Powered by Scholastica, the modern academic journal management system