Loading [Contrib]/a11y/accessibility-menu.js
Skip to main content
null
Findings
  • Menu
  • Articles
    • Energy Findings
    • Resilience Findings
    • Safety Findings
    • Transport Findings
    • Urban Findings
    • All
  • For Authors
  • Editorial Board
  • About
  • Blog
  • covid-19
  • search

RSS Feed

Enter the URL below into your favorite RSS reader.

http://localhost:25822/feed
Transport Findings
May 06, 2020 AEST

Spatial Distributions of Attitudes and Preferences towards Autonomous Vehicles

Zhiqiu Jiang, Sicheng Wang, Andrew S. Mondschein, Robert B. Noland,
autonomous vehiclesattitudesspatial analysisfactor analysisspatial patterns
Copyright Logoccby-nc-4.0 • https://doi.org/10.32866/001c.12653
Photo by Sincerely Media on Unsplash
Findings
Jiang, Zhiqiu, Sicheng Wang, Andrew S. Mondschein, and Robert B. Noland. 2020. “Spatial Distributions of Attitudes and Preferences towards Autonomous Vehicles.” Findings, May. https:/​/​doi.org/​10.32866/​001c.12653.
Save article as...▾
Download all (3)
  • Figure 1: Spatial hotspot analysis of four attitudinal factors.
    Download
  • Figure 2: Spatial hotspot analysis of attitudinal responses.
    Download
  • Figure 3: Spatial hotspot analysis of waiting time for ridesourcing services.
    Download

Sorry, something went wrong. Please try again.

If this problem reoccurs, please contact Scholastica Support

Error message:

undefined

View more stats

Abstract

Prior research on attitudes towards autonomous vehicles (AVs) shows variation across a set of demographic and socio-economic factors, but few consider spatial patterns. We investigate the spatial distributions of attitudes and preferences towards AVs from a U.S. nationally representative on-line panel. We examine 1) four attitudinal dimensions established by an exploratory factor analysis – technology acceptance, driving enjoyment, risk-taking, and traffic regulation – and their spatial variations; and 2) public viewpoints and preferences in purchasing, sharing, and using privately-owned and shared AVs. Findings suggest that the northeastern US is more receptive to AVs, compared to other parts of the country.

1. RESEARCH QUESTIONS AND HYPOTHESES

A growing body of scholarship examines public perceptions and attitudes towards AVs in order to understand future AV adoption rates and their potential impact. This prior research shows variation across a set of demographics and socio-economic factors, but does not consider spatial patterns (Bansal, Kockelman, and Singh 2016; Menon et al. 2019; Wang et al. 2020). One exception is Nodjomian and Kockelman (2019) who found that access to jobs, the mix of land uses, and home location choice are associated with levels of interest in AVs and anticipated use of AV’s. Our investigation is further motivated by the observation that the heterogeneity in acceptance of AVs exists across regions and countries (Schoettle and Sivak 2014; Haboucha, Ishaq, and Shiftan 2017). Specifically, we hypothesize that attitudes and preferences towards AVs may also be shaped by regional location in the United States. We focus on the following research questions:

  • What are both the expressed and latent attitudes towards AVs, and do they vary geographically?

  • If these vary geographically, do preferences for purchasing, sharing, and using privately-owned and shared AVs co-vary with demographic, travel and accessibility factors?

2. METHODS AND DATA

Using an on-line panel from Qualtrics, a survey was conducted in September 2018 and is demographically representative of the adult US population (see Wang et al. 2020). After removing invalid and incomplete responses for demographic information, we had 782 respondents (from 834 in total). We collected information on attitudes, socio-demographics, location (postal code), and travel behavior (commuting mode, commuting time, daily travel mode, and car ownership). The main limitation of on-line panels is that survey-takers are paid and may be more tech-savvy. We also examined how representative our data is at the regional level. While less so than nationally, we found slightly more survey respondents from the northeast, and fewer from the west, but most demographic variation differed by only a few percent compared to census data for the region. The one exception was more male respondents in the northeast. Our questions and responses on views towards privately-owned and shared AVs are in Table 1.

Table 1:Questions and responses on views of autonomous vehicles in survey
Category Attitudinal questions Response statistics
Privately-owned AVs Q1. Do you have a positive or negative view of self-driving cars? Positive Neutral Negative N
304 (36.7%) 343 (41.5%) 180 (21.8%) 827
Q2. Would you be likely to purchase a fully self-driving car when these are available? Yes Uncertain No N
277 (33.4%) 243 (39.4%) 308 (37.2%) 828
Shared AV services Q3. Would you use a taxi service that was self-driving? Yes Maybe No N
189 (24.2%) 289 (37.1%) 302 (38.7%) 780
Q4. Would you use a self-driving taxi that is shared with someone you do not know? Yes Maybe No N
163 (21.1%) 217 (28.1%) 392 (50.8%) 772
Q5. How many minutes would you be willing to wait to/from work when using ridesourcing services? Min Median Mean Max SD N
0/0 10/10 11.8/11.9 60/60 10.0/10.3 638
Q6. How many minutes would you be willing to wait to/from a grocery store when using ridesourcing services? Min Median Mean Max SD N
0/0 10/10 12.4/11.8 90/80 10.3/10 637
Q7. How many minutes would you be willing to wait to/from a restaurant when using ridesourcing services? Min Median Mean Max SD N
0/0 10/10 13.5/12.7 120/60 11.6/10 638

About 37% of our sample has a positive view of AVs, with one-third likely to purchase their own. Only 24% of our sample would use a self-driving taxi and only 21% would share a self-driving taxi with a stranger. Respondents report marginally more willingness to wait when using ridesourcing services for travel to/from destinations such as restaurants compared to work or shopping.

Additionally, we surveyed attitudes towards new technologies using a 5-point Likert scale from “strongly disagree” to “strongly agree.” These questions are shown in Table 2 including the results of a factor analysis that decomposed these into four factors defined as “pro-technology”, “driving enjoyment”, “risk avoiders”, and “regulating traffic”. The shaded areas in Table 2 show the largest loadings for each variable.

We used Getis-Ord Gi* (Anselin and Getis 1992), a distance-based statistical method to identify statistically significant clusters of values across a spatial distribution. The method assesses each value within the context of its neighboring values. Using region-scaled (250 to 325 miles) distance bands, we examined spatial distributions of: (1) the four attitudinal factors; (2) preferences for AVs; and, (3) willingness to wait when using ridesourcing services.

Table 2:Factor loadings for attitudinal variables.
Factor 1 Factor 2 Factor 3 Factor 4
Pro-Technology Driving enjoyment Risk Avoiders Regulating traffic
How often do you use Uber, Lyft, or another ridesharing service? 0.89 0.15 0.14 0.12
When did you first use a smartphone app-based ridesharing service? 0.89 0.15 0.10 0.08
I believe that the government should develop regulations for self-driving cars. 0.11 0.15 0.41 0.08
I believe that the technology companies developing self-driving cars should have the freedom to test their vehicles on city streets. 0.45 0.14 0.06 0.22
When I am driven by someone I do not know (such as a cab driver, limo driver, or Uber or Lyft driver) I am not concerned about my safety. 0.45 0.10 0.08 0.26
I think speed limits are too high 0.27 0.08 0.16 0.81
Fines for speeding should be higher. 0.21 0.11 0.33 0.51
I prefer to avoid risky activities. -0.01 -0.01 0.72 0.18
I really dislike not knowing what is going to happen. 0.11 0.15 0.45 0.06
I chose my vehicle because it fits my personality and represents who I am as a person. 0.29 0.37 0.18 0.17
I prefer to drive when I am in a motor vehicle. 0.12 0.68 0.18 0.07
I love to drive and driving seems fun. 0.15 0.80 0.09 0.05

Note: The number of valid responses in our factor analysis is 715 (less than the 782 responses with valid demographic information).

3. FINDINGS

The results of our Getis-Ord Gi* analysis for these four factors is shown in Figure 1. Pro-Technology shows significant clustering of high values in the Mid-Atlantic and Northeast regions, and clustering of low values ranging from parts of Ohio to Mid-South and Central Florida regions. The other three factors show less significant clustering patterns compared to Pro-Technology with a notable positive value of clusters for all the other factors in the upper Midwest.

Figure 1
Figure 1:Spatial hotspot analysis of four attitudinal factors.

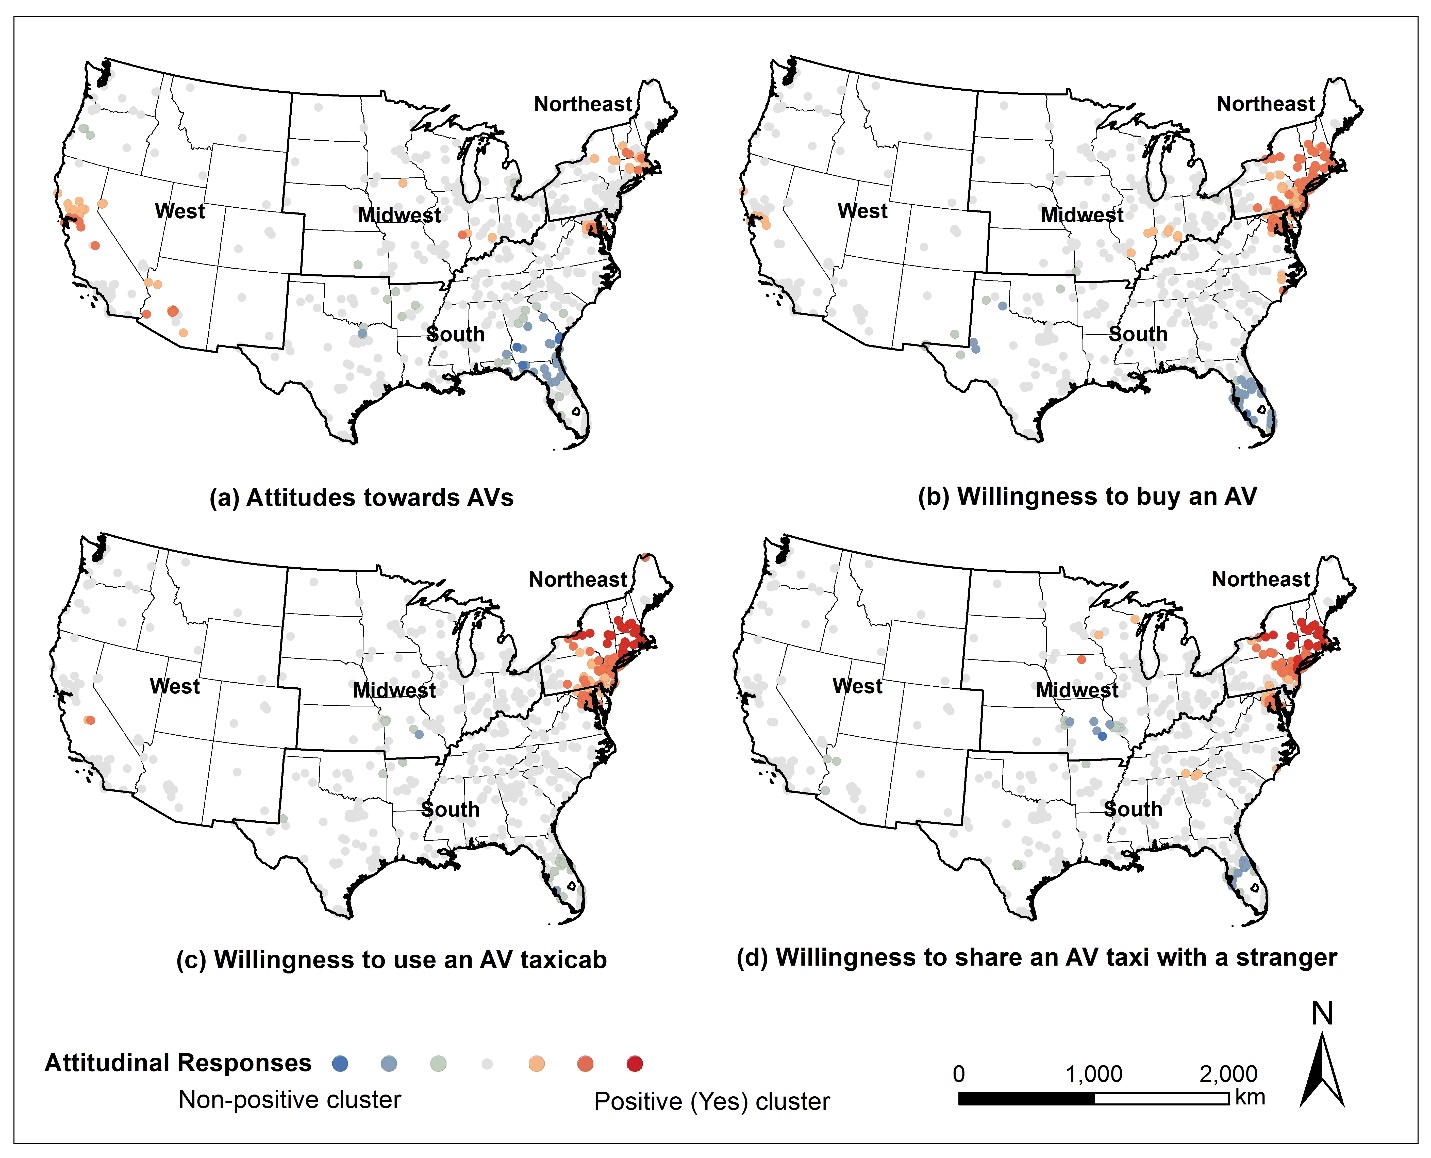
A hotspot analysis for preferences towards AVs is shown in Figure 2. In general, “Positive” (or “Yes”) responses are spatially clustered around large, dense urban regions such as New York City or the Bay Area in California (home of Silicon Valley), while “Non-positive” (or “Uncertain” / “No”) responses are significantly clustered in the South. For the attitudes towards AVs, as shown in Figure 2 (a), positive attitudes are significantly more likely in the Bay Area, Arizona, New England, and the Washington DC metro. Figure 2 (b) to (d) represent the positive responses of the willingness to buy an AV, the willingness to use an AV taxicab and the willingness to share an AV taxi with a stranger; positive responses are significantly clustered in the Mid-Atlantic and New England regions.

Figure 2
Figure 2:Spatial hotspot analysis of attitudinal responses.

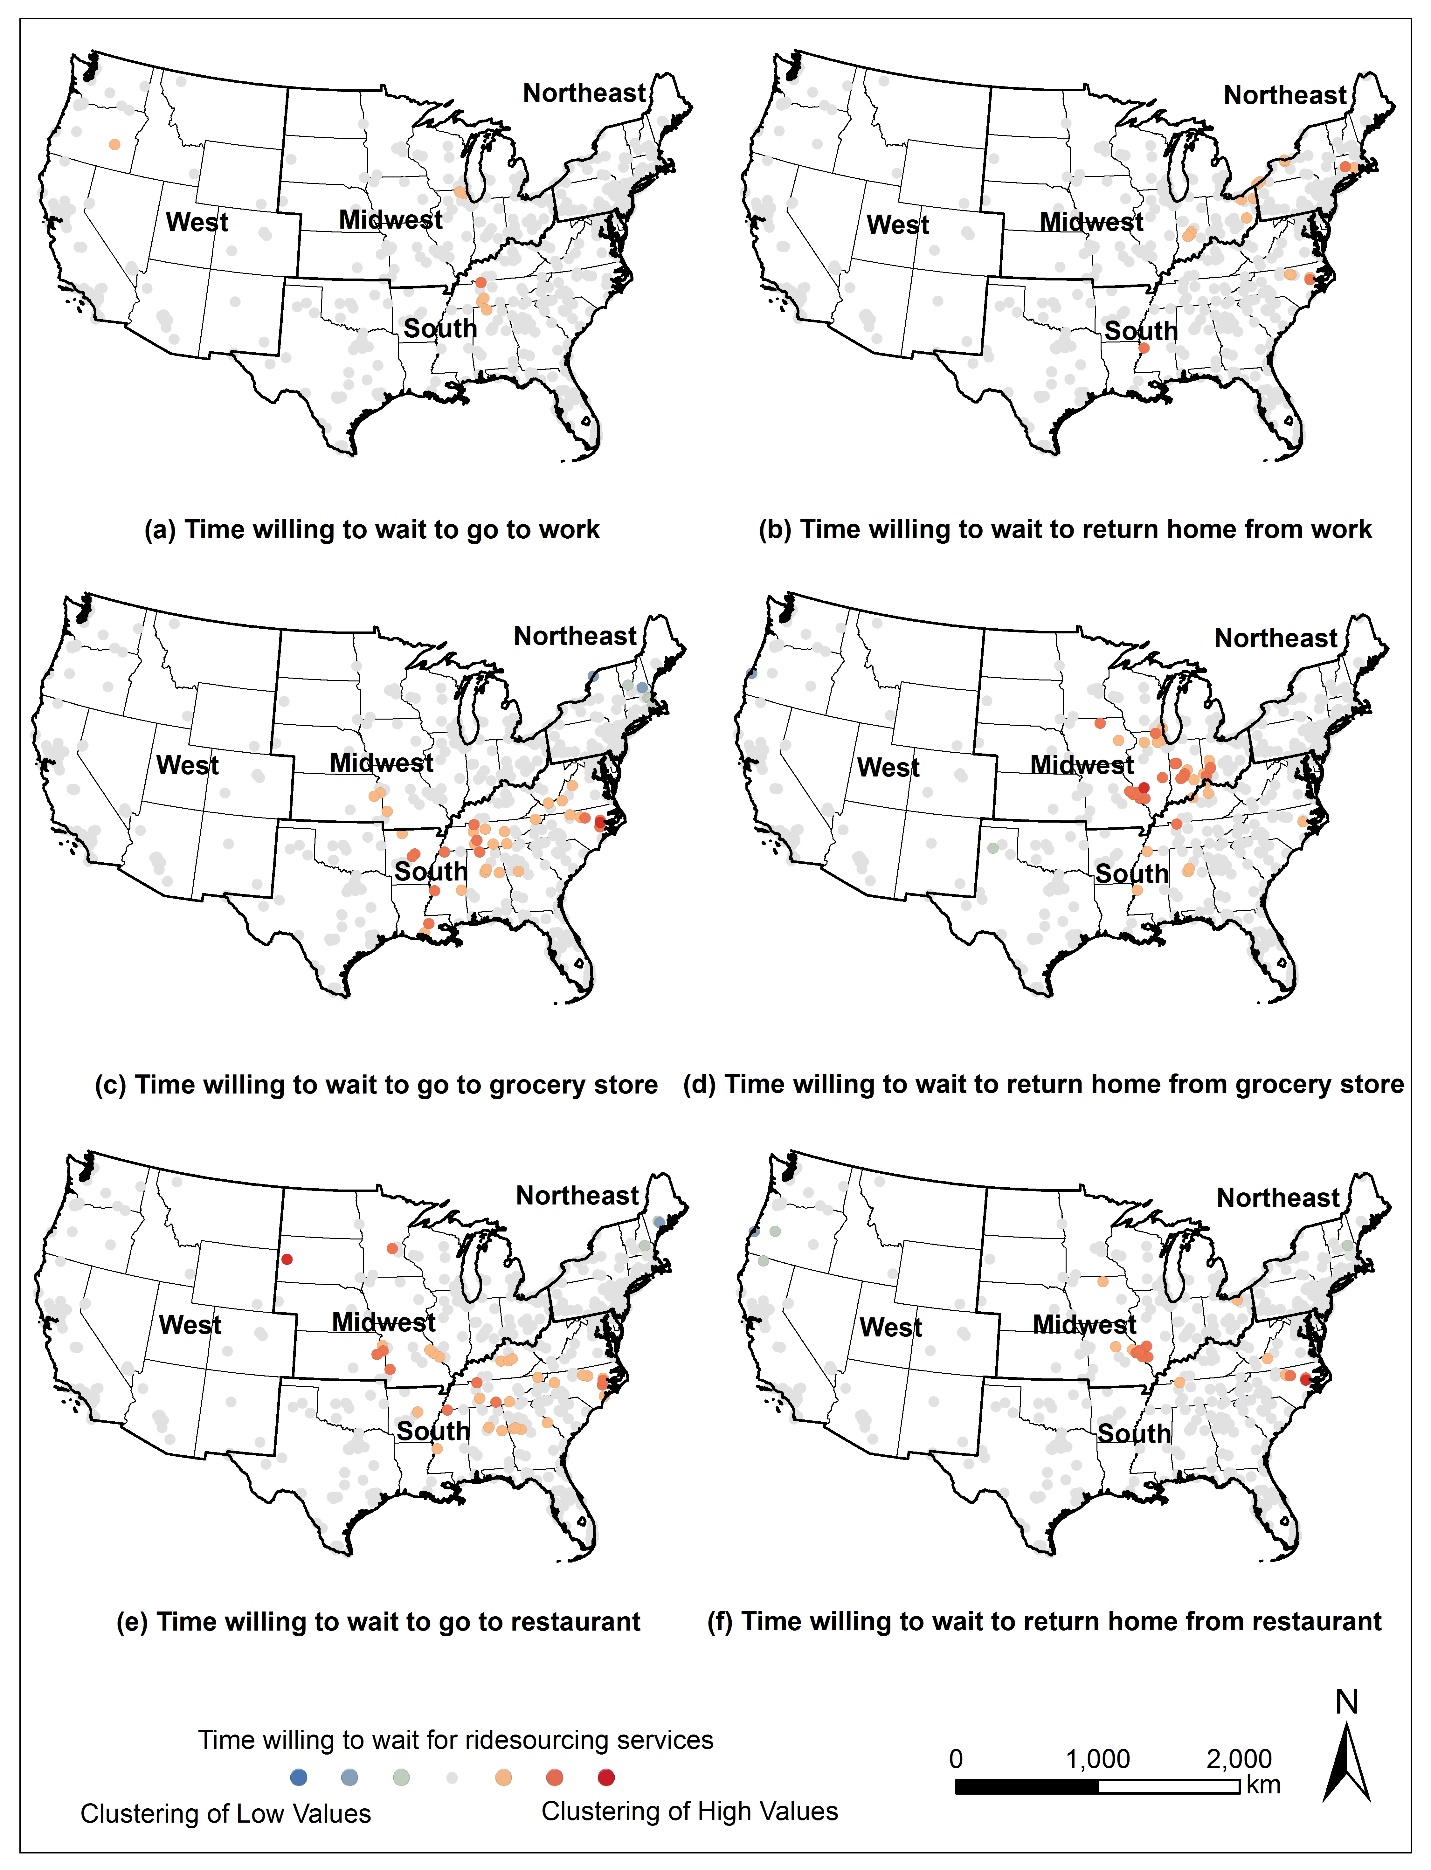
Spatial variation in willingness to wait is shown in Figure 3. The results show that the duration respondents are willing to wait for trips to/from grocery stores and restaurants is significantly higher in parts of the South and Midwest. Despite no significant reported interest in sharing AV taxis, respondents in these areas may be more amenable to sharing because of their increased willingness to wait.

Figure 3
Figure 3:Spatial hotspot analysis of waiting time for ridesourcing services.

While we observe significant regional clustering, demographic factors may co-vary across regions in a way that explains the spatial variability. We therefore summarize a range of variables by US census-designated region including an ANOVA or Chi-Square test in Table 3 using weighted data to represent the regional population. Weights were calculated for gender, age, income, and region based on a statistical raking algorithm using the “survey” package in R (Lumley 2020). As displayed in Table 3, respondents from the Northeast region do have substantially more positive attitudes toward AVs overall and they are more “pro-technology”, but the demographics of the Northeast also deviate from other regions. The Northeast has higher average and median automobile accessibility than other regions. When we look at the automobility accessibility of each city, we find that New York City and other large, older cities of the Northeast have greater access to jobs within 45 minutes. Moreover, the Northeast and West regions have, on average, higher traffic congestion levels and road density levels than the South and Midwest regions. Demographically, respondents from the Northeast live in more urbanized locations, are wealthier, and more familiar with AVs overall.

Our investigation shows that attitudes toward technology and AV preferences are spatially clustered, however the reasons remain undetermined.

Table 3:Weighted summary statistics by Census region
Midwest Northeast South West F-value / x2
Number of participants 167 169 315 131 -
Mean automobile accessibility1 index 0.06 0.23 0.05 0.12 26.5***
Median automobile accessibility1 index 0.03 0.07 0.03 0.07
Mean workers per job index2 0.38 0.47 0.41 0.44 10.5***
Mean TTI index3 (averaged across respondents) 0.41 0.57 0.45 0.64 23.1***
Mean age 47.68 47.73 46.35 44.18 1.4
Mean commuting time (min) 18.67 19.67 17.39 19.57 0.8
Mean number of children in a household 0.93 0.66 0.62 0.64 3.1*
Income4 >= $200,000 % 5% 10% 3% 8% 3.1*
Income $150,000 - $200,000 % 6% 8% 4% 5% 1.0
Income $100,000 - $150,000 % 14% 16% 11% 12% 0.8
Income $50,000 - $100,000 % 31% 28% 30% 38% 1.4
Income $25,000 - $50,000 % 23% 19% 30% 18% 3.5*
Income Under $25,000 % 20% 19% 22% 20% 0.2
Urban5 % 72% 92% 80% 80% 5.5**
Female % 51% 51% 51% 51% 0.02
Own/be interested in smart devices % 71% 74% 77% 75% 2.23
Be familiar with AVs % 49% 56% 50% 48% 2.22
Positive attitude towards AVs% 37% 40% 32% 38% 3.18
Willing to purchase AVs% 34% 38% 29% 32% 3.61
Willing to use AV taxicab service% 25% 31% 19% 26% 8.22*
Willing to share AV taxi with a stranger% 20% 26% 20% 17% 3.60
Mean of Factor 1: Pro-Technology -0.07 0.13 -0.06 -0.03 1.32*
Mean of Factor 2: Driving enjoyment 0.01 0.05 -0.01 0.03 0.16
Mean of Factor 3: Risk Avoiders -0.01 0.02 0.00 0.04 0.15
Mean of Factor 4: Regulating traffic 0.01 0.12 -0.09 0.04 1.89
Mean of time willing to wait to work 12.8 11.0 11.5 10.8 1.19
Mean of time willing to wait from work 12.2 12.7 12.0 9.5 3.5*
Mean of time willing to wait to a grocery store 13.0 12.1 12.7 11.5 0.71
Mean of time willing to wait from a grocery store 12.7 11.8 12.0 10.3 1.81
Mean of time willing to wait to a restaurant 14.5 12.7 13.7 12.0 1.56
Mean of time willing to wait from a restaurant 13.0 12.8 13.3 10.8 2.50

Significance codes: p<0.000 ‘***’, p<0.001 ‘**’ p<0.01 ‘*’.

1Automobile accessibility is a normalized value showing the number of jobs within 45 minutes auto travel time at zip code level. Data source: United States Environmental Protection Agency. (2014). Smart Location Database.

2Workers per job index is the household workers per job equilibrium index from the 2014 US EPA Smart Location Database. As the index approaches one, the more balanced are resident workers and jobs in a zip code.

3TTI index is the urban mobility scorecard travel time index (TTI) index at zip code level. Data source: Texas Transportation Institute (2015).

4Income is a categorical variable that reflects the respondent’s total household income in 2017.

5Urban indicates whether the respondent lives in an urban area or not. Our questionnaire queried respondents for their home Zip code. Based on the Zip code, we classified respondents living in urban areas using the National Center for Education Statistics (NCES) location code.

References

Anselin, Luc, and Arthur Getis. 1992. “Spatial Statistical Analysis and Geographic Information Systems.” The Annals of Regional Science 26 (1): 19–33. https:/​/​doi.org/​10.1007/​bf01581478.
Google Scholar
Bansal, Prateek, Kara M. Kockelman, and Amit Singh. 2016. “Assessing Public Opinions of and Interest in New Vehicle Technologies: An Austin Perspective.” Transportation Research Part C: Emerging Technologies 67 (June):1–14. https:/​/​doi.org/​10.1016/​j.trc.2016.01.019.
Google Scholar
Costello, Anna B. , and Jason Osborne. n.d. “Best Practices in Exploratory Factor Analysis: Four Recommendations for Getting the Most from Your Analysis.” https:/​/​doi.org/​10.7275/​JYJ1-4868.
Google Scholar
Haboucha, Chana J., Robert Ishaq, and Yoram Shiftan. 2017. “User Preferences Regarding Autonomous Vehicles.” Transportation Research Part C: Emerging Technologies 78 (May):37–49. https:/​/​doi.org/​10.1016/​j.trc.2017.01.010.
Google Scholar
Lumley, T. 2020. “Survey: Analysis of Complex Survey Samples.” R Package Version 4.0.
Google Scholar
Menon, Nikhil, Natalia Barbour, Yu Zhang, Abdul Rawoof Pinjari, and Fred Mannering. 2019. “Shared Autonomous Vehicles and Their Potential Impacts on Household Vehicle Ownership: An Exploratory Empirical Assessment.” International Journal of Sustainable Transportation 13 (2): 111–22. https:/​/​doi.org/​10.1080/​15568318.2018.1443178.
Google Scholar
Nodjomian, Adam T., and Kara Kockelman. 2019. “How Does the Built Environment Affect Interest in the Ownership and Use of Self-Driving Vehicles?” Journal of Transport Geography 78 (June):115–34. https:/​/​doi.org/​10.1016/​j.jtrangeo.2019.05.016.
Google Scholar
Schoettle, Brandon, and Michael Sivak. 2014. “A Survey of Public Opinion about Connected Vehicles in the U.S., the U.K., and Australia.” In 2014 International Conference on Connected Vehicles and Expo (ICCVE). Vienna: IEEE. https:/​/​doi.org/​10.1109/​iccve.2014.7297637.
Google Scholar
Wang, S., Z. Jiang, R.B. Noland, and A. Mondschein. 2020. “Attitudes toward Privately-Owned and Shared Autonomous Vehicles.” Presented in the Transportation Research Board (TRB) 99th Annual Meeting.
Google Scholar

This website uses cookies

We use cookies to enhance your experience and support COUNTER Metrics for transparent reporting of readership statistics. Cookie data is not sold to third parties or used for marketing purposes.

Powered by Scholastica, the modern academic journal management system