1. Questions
Public transport (PT) is viewed as an important component of the urban mobility mix, necessary to achieve both environmental and social sustainability in the passenger transport sector (Banister 2008; Geurs and van Wee 2004). The Fornebu line (‘Fornebubanen’) is a new metro line under development in Oslo, Norway. The line is planned from Majorstuen metro station at the western end of Oslo inner city, to Fornebu, a former airport area now subject to major residential and commercial development, located in the neighbouring municipality Bærum. The 7.7 km long metro line will go entirely underground and include six new metro stations. When finalized, the metro will run eight times per hour in each direction, with a travel time of 12 minutes between Majorstuen and Fornebu (the final stop). The line is planned to open in 2029, with an estimated cost of approximately NOK 23 billion[1].
At the planning stage, little investigation has been done to uncover how the line will influence PT accessibility for the population in Oslo and Bærum. Moreover, the line’s distributional effects have received limited attention in the plans as well as in the public debate. This study investigates the equity and distributional impacts of the Fornebu line by asking the following research questions:
-
How will the Fornebu line affect access to workplaces in census tracts in Oslo and Bærum?
-
Will the Fornebu line affect access to workplaces differently for households with different income level?"
2. Methods
We employ detailed calculations of PT accessibility to workplaces – with and without the Fornebu line – to answer the research questions. Accessibility calculations are made with publicly available PT timetable data (in GTFS format, gathered from Entur[2]) and road network data (from OpenStreetMap), and with network analyses conducted in R statistical software using the R5R-package (R Core Team 2021; Pereira, Saraiva, Herszenhut, et al. 2021). To calculate accessibility after the opening of the Fornebu line, we manipulate the current PT timetables and road map data to include the new metro line as well as footpaths that will be built to enable access the new metro stations. Information about the new metro service was gathered from the project’s website (see footnote 1), as well as from e-mail correspondence with the municipal enterprise responsible for planning and development of the project.
Accessibility is measured at the census tract level. These tracts are the smallest geographical unit where sociodemographic and employment statistics are available in Norway. The tracts are developed by Statistics Norway[3], and are designed to constitute functional neighbourhoods, consisting of geographically coherent areas which are as uniform as possible when it comes to nature, economic activities, population composition and building structure. As the geographic size of the tracts vary, we determine the midpoint of each tract, based on all postal addresses, and use this as the point of interest in our analyses. We calculate the travel time between all census tracts and count the number of workplaces that can be reached within 30 minutes travel time from each tract. Data on the number of workplaces in each census tract is provided by Statistics Norway. While we recognize that a hard travel time threshold is sensitive to the modifiable temporal unit problem (MTUP) (Pereira 2019), we decided to use this approach for two reasons. First, because the results are easier to interpret than more advanced accessibility metrics (El-Geneidy and Levinson 2022), and second, because previous research has shown that such simple metrics tend to be highly correlated with more advanced alternatives (Higgins 2019). We chose a 30-minute travel time threshold as it best reflects actual commute trips in the study area. Using data from the National Travel Survey in Norway (Grue, Landa-Mata, and Langset Flotve 2021), we found that the median and mean travel times were slightly below 30 minutes for both PT, car, walking and bicycle trips. As an additional test, we also include analyses with a 60 minute travel time threshold (reported in the Supplemental Information file).
We estimated travel times during the morning rush hour, to get travel times that are representative for most commute trips. The choice of departure time for PT trips is, however, subject to biases, depending on departure frequencies. With a 15-minute frequency, for example, an estimated travel time may include up to 14 minutes waiting at the station, depending on the departure time. To overcome this bias, we estimated minutely travel times within a one-hour time window (between 7:30 and 8:30 AM on a Tuesday) and used the median of those 60 travel times. The median value is chosen as it provides representative waiting times. The estimated travel times include time spent walking from the origin to the first PT stop, waiting time, onboard time, time spent during any transfers between PT modes, and walking time from the final PT stop to the destination.
Household income level is gathered from administrative registry data, delivered by Statistics Norway. The data set covers the entire population in the study area. Household income is weighted by the number of household members using OECD’s square root scale: total disposable income divided by the square root of household size. The income data are from 2018, as this was the most recent data available. Figure 1 shows the income levels of census tracts in the study area.
3. Findings
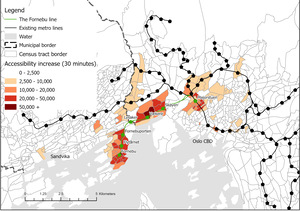
We first investigate which census tracts in Oslo and Bærum experience an increase in workplace accessibility after the opening of the Fornebu line (the first research question). Figure 2 shows this effect, as well as the existing and new metro lines and stations.
Figure 2 shows how the immediate surroundings of the Fornebu line enjoy substantial accessibility increases after opening. Especially on the Fornebu peninsula, where the three final stops are located, as well as by Vækerø station. We also see accessibility increases around Majorstuen station, where the Fornebu line is planned to merge with the existing metro system. Moreover, we see slight increases around the existing metro lines, as well as in the area to the north of Lysaker. These areas benefit from the new line because they are served by metro and bus lines that feed into the Fornebu line.
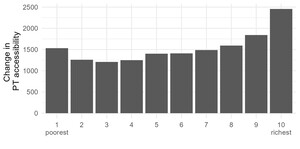
Next, in figure 3, we investigate whether PT accessibility increases differently for different income groups (the second research question).
We see that there are some variations depending on income level. The poorest income decile experiences a higher increase after the Fornebu line than the next six deciles (2-7). At the same time, the highest accessibility gains are found among the highest three income deciles, especially among the richest ten percent who enjoy an increase in accessibility nearly twice as high as decile 2-4.
For a further exploration of the distributional effects, we also estimate the concentration index (CI) of PT accessibility before and after the opening of the Fornebu line. The CI estimates the distribution of a good ordered by a socioeconomic variable (Karner, Pereira, and Farber 2024). In our case, we estimate the CI of PT accessibility ordered by income level. We find that the CI increases slightly, from -0.0165 to -0.0155, when the Fornebu line is included. This shows, first, that PT accessibility in general is higher among low-income households (concentration is higher among those less well off), and second, that the new metro contributes to shifting the concentration of PT access towards high-income households.We can thus conclude that the extension of Oslo’s metro system to Fornebu comes with an increase in PT accessibility in the region, although with largest effects in the immediate surroundings of the new metro line. Socioeconomically, the line has a slight redistributive effect towards the richest households, as they experience larger accessibility gains. However, in total, the increase in accessibility is relatively modest – on average – for all income groups.
We have also estimated accessibility effects using a 60-minute travel time threshold. The geographic and socioeconomic results are shown in the Supplemental Information. In short, we find rather similar results with a larger travel time threshold: the immediate surroundings and the highest income groups are most strikingly experiencing an increase in PT accessibility with the new line. At the same time, there are some interesting variations. First, the effects on accessibility are smaller, resulting from the fact that the overall accessibility levels are higher with a higher travel time threshold. Second, the effect on census tracts and income groups are more evenly distributed with this measure.
This study has shown that PT investments in the affluent western part of Oslo improves PT accessibility more for high-income households. Based on this, we can also assume that PT investments in other parts of region could benefit low-income households more. Previously, metro extensions have been proposed from Ellingsrudåsen (Asplan Viak 2022) and Mortensrud (Ruter 2010) in the eastern and southern parts of Oslo (shown in Figure 1). Based on the income distribution in Figure 1, it is likely that these projects would have a different distributional profile than the Fornebu line, with larger accessibility gains for low-income groups.
This analysis is of course not without limitations. First, we measured PT access with a strict travel time threshold (30 and 60 minutes). More sophisticated operationalizations of accessibility, for example using a gravity-based or competitive measures, could take better account of all relevant destinations and opportunities (Levinson and King 2020). Second, we have measured access to all workplaces within 30 minutes travel time. We acknowledge that not all workplaces are equally relevant for all employees, and more sophisticated measures could have uncovered more detailed accessibility effects in this regard. Third, our socioeconomic data is from 2018, while the Fornebu line is planned to open in 2029. We can thus expect that both the residential and commercial patterns of the region can change substantially in the coming years, which in turn will influence the real effects the Fornebu line on workplace accessibility, as well as which groups of the population are mostly affected. Future research could shed light on this topic, for example by applying a forecast model on future development.
Acknowledgements
This project has been funded by the Nordic Road Association (NVF), the Norwegian Public Roads Administration (SVV), Viken county municipality and the Research Council of Norway (grant no. 302059).
https://www.oslo.kommune.no/slik-bygger-vi-oslo/fornebubanen/#gref
Entur is a Norwegian state-owned company working to gather and make available Norwegian PT data (www.entur.no)

._with_existing_an.jpg)


._with_existing_an.jpg)

