Research Question and Hypothesis
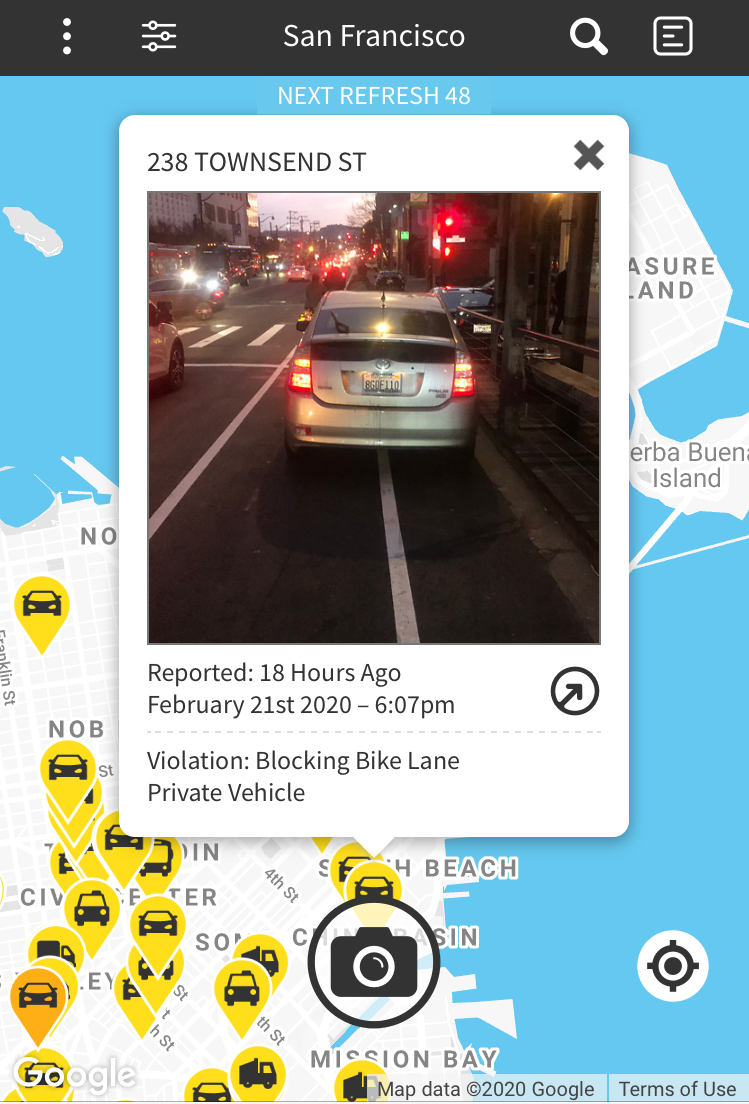
Frustrated with San Francisco bike lanes being frequently blocked by cars, resident Stephen Braitsch developed “Safe Lanes” (www.safelanes.org), a website for individuals to photograph and report blocked bike lanes to the city (Braitsch 2019a; Holder 2019). The platform’s crowdsourced dataset quantifies and qualifies blocked bike lanes (in scope, location, frequency, perpetrators), which builds on existing evidence of urban bike-lane conflicts (Conway et al. 2013), and could lead to improved enforcement efforts and infrastructure investments. The hypothesis prior to exploring Safe Lanes data is that bike-lane blockages occur across the city (not only in its densest areas), and that they are not matched geographically by citations. Second, reports are likely dominated by ridehailing and goods delivery, two vehicle categories that are both growing in terms of their share of overall traffic. Such findings – if confirmed – could identify enforcement gaps, pinpoint blockage ‘hotspots’ that necessitate separated bike lanes, and elevate the importance of converting existing curbs from primarily long-term parking to loading zones.

Methods and Data
Safe Lanes launched in 2019, following the tragic death of a bicyclist who was killed while riding in an unprotected bike lane in San Francisco (Braitsch 2019b; Swan 2019). It consists of a mobile website that allows users to photograph blocked bike lanes, and record vehicle license plates, categories, (e.g. private car, moving truck, Uber, etc.), and the date, time, and location of violations. Those reports are automatically submitted to the city’s customer-service center. When the San Francisco Municipal Transportation Agency (SFMTA) cites a vehicle for blocking a bike lane, the details of each citation are made available on the city’s open-data portal. These two datasets have been combined to analyze both reports and citations in terms of amount, frequency, timing, location, and vehicle category.
Findings
Between May 1, 2019 and January 31, 2020, 9,477 blocked bike-lane reports were submitted via Safe Lanes, averaging 34 per day, compared to 9,817 SFMTA citations (36 per day). Weekdays averaged higher numbers of reports (39 vs. 22) and citations (44 vs. 15) compared to weekends. Safe Lanes reports were submitted at the highest rates between 10 AM and 4 PM, followed by the evening commute (4-7 PM). This pattern held for SFMTA citations.
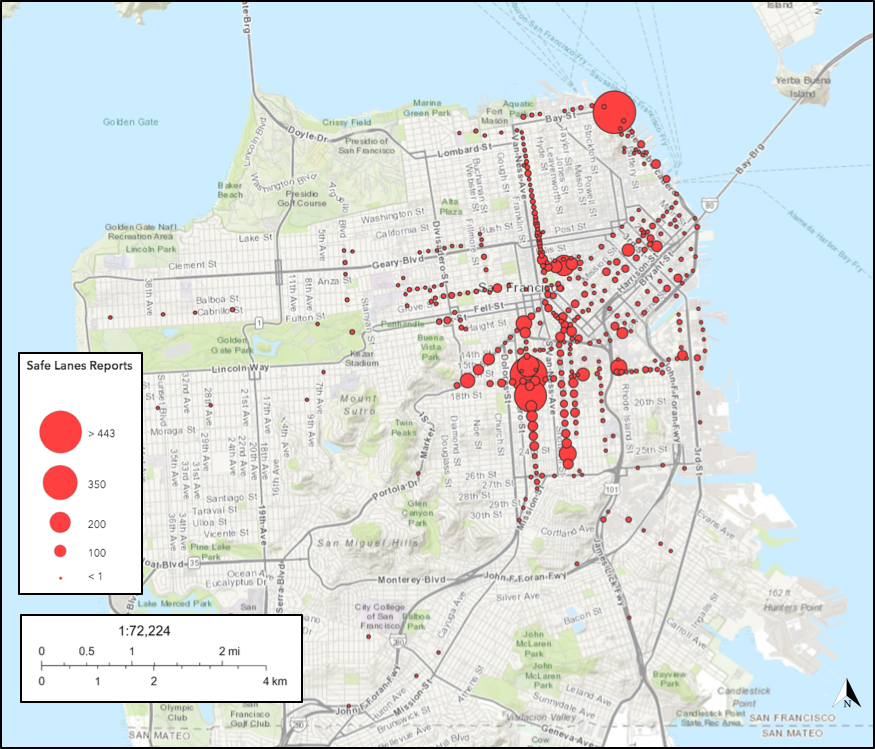
Geographically, Safe Lanes reports were highest in the South of Market neighborhood (SoMa), the Mission District, and along the waterfront known as the Embarcadero, all areas which lie within the city’s dense northeast quadrant, have high rates of bike ridership, and contain a large share of San Francisco’s restaurants and offices. Such blocked bike-lane “hotspots” signal locations where existing bike infrastructure does little to prevent automobiles from rendering it useless (See Figure 2). In addition, there are a number of other streets throughout the city with Safe Lanes reports present in smaller numbers, including in San Francisco’s western half. Reports were submitted in both high- and low-income neighborhoods, as well as well as along both commercial corridors and residential streets. Of course, reports can only occur where bike lanes already exist, so their spatial distribution is in part a product of San Francisco’s broader bike planning, which some have criticized for being disproportionately focused within gentrifying areas (Stehlin 2019).
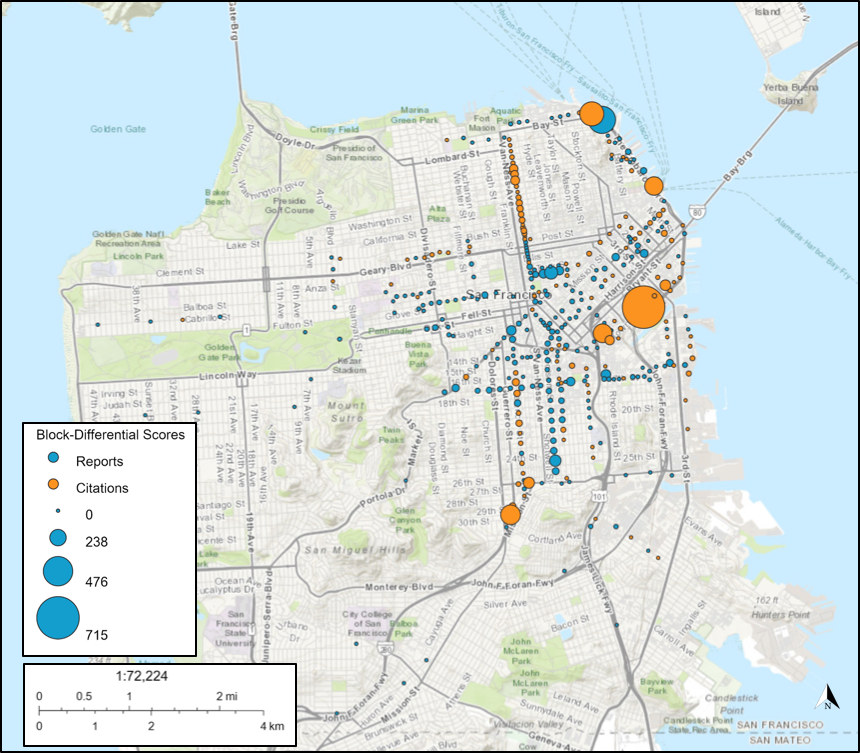
Comparing the spatial distribution of Safe Lanes reports with SFMTA citations allows for the calculation of block-differential scores (see Figure 3). Such scores represent the difference between Safe Lanes reports and SFMTA citations for a single block, with those colored turquoise indicating where citations run below reports (and those which are orange indicating more citations than reports). These illustrate that enforcement falls short of reported blockages throughout the Mission District and much of SoMa, Civic Center, certain central and western neighborhoods, and along the city’s waterfront. However, many other areas show a fairly tight relationship between reports and citations, indicating enforcement that is attuned to the distribution of blockages, though still with room for improvement.


Among reports classified by vehicle category (5,769), private vehicles were the most-common, followed by delivery vehicles, ridehail/taxis, commercial trucks, and less than 10% comprised by public vehicles, private buses or shuttles, and physical obstructions.
As to policy recommendations, data from Safe Lanes demonstrate geographically-distributed instances of bike lane blockages, including certain hotspots that alone have been reported hundreds of time over a nine-month period. Such locations should be prioritized for the installation of separated bike lanes, or at least widened lanes, given that narrower lanes have been associated with higher traffic conflicts (Chen et al. 2018), and wider lanes can provide cyclists with room to avoid blockages (Schimek 2018). SFMTA’s enforcement of bike lanes does not match violations geographically, particularly along certain streets revealed via block-differential scores. These point to where enforcement should increase. Two potential limitations of this study are that people who use Safe Lanes may not be representative of the overall cycling population (biasing where reports are logged), and possible operational constraints on traffic enforcement (budget, location of refueling stations, etc.). Finally, passenger and goods delivery comprise roughly half of categorized reports, suggesting the need to increase the number of loading zones along certain corridors, which generally are dominated by hourly parking. Overall, Safe Lanes turns blocked bike lanes into actionable crowdsourced data, which provide numerous insights for cities to inform their operations and infrastructure plans.
Acknowledgements
The author acknowledges Stephen Braitsch (Safe Lanes’ founder) for his significant help with this project.