

1. Questions
Are residents of multifamily housing (MFH) as likely to own an electric vehicle (EV) as residents of single-family housing (SFH)? Surveys and data show that multifamily dwellers have significantly less access to EV charging infrastructure than those in single-family homes (Ge et al. 2021; Min and Lee 2020). This analysis examines adoption of battery-electric and plug-in hybrid electric vehicles (hereafter referred to as EVs) by multifamily residents using an underutilized proprietary dataset of vehicle owners’ demographic characteristics, provided by Experian Information Solutions Inc. Using this dataset, we test our hypothesis that multifamily dwellers are less likely to own EVs compared to single-family residents.
2. Methods
Unlike studies that compare vehicle registration data with separate demographic sources, such as department of motor vehicles data and American Community Survey data (Liu, Roberts, and Sioshansi 2017; Araújo, Boucher, and Aphale 2019; Chen, Wang, and Kockelman 2015; Morton et al. 2018), we use derived counts from Experian’s proprietary “vehicles in operation” registration demographic dataset (Experian Information Solutions Inc. 2022), available for purchase. Experian’s model combines multiple sources, including transactional purchase and US Postal Service address data, to predict dwelling type for each vehicle registrant (cars and light trucks). In this study, we use 2022 ZIP code data from 620 residential ZIP codes in Colorado, aggregated by Experian.
The dataset includes three dwelling types: multifamily/condo, single-family, and other. In Colorado, multifamily residents accounted for 11.9% of vehicle registrations, and single-family residents 59.5%. The ‘other’ category (28.6%) includes marginal multifamily, PO box, and unknown. Since Experian considers this category questionable, we excluded it and used only multifamily and single-family.
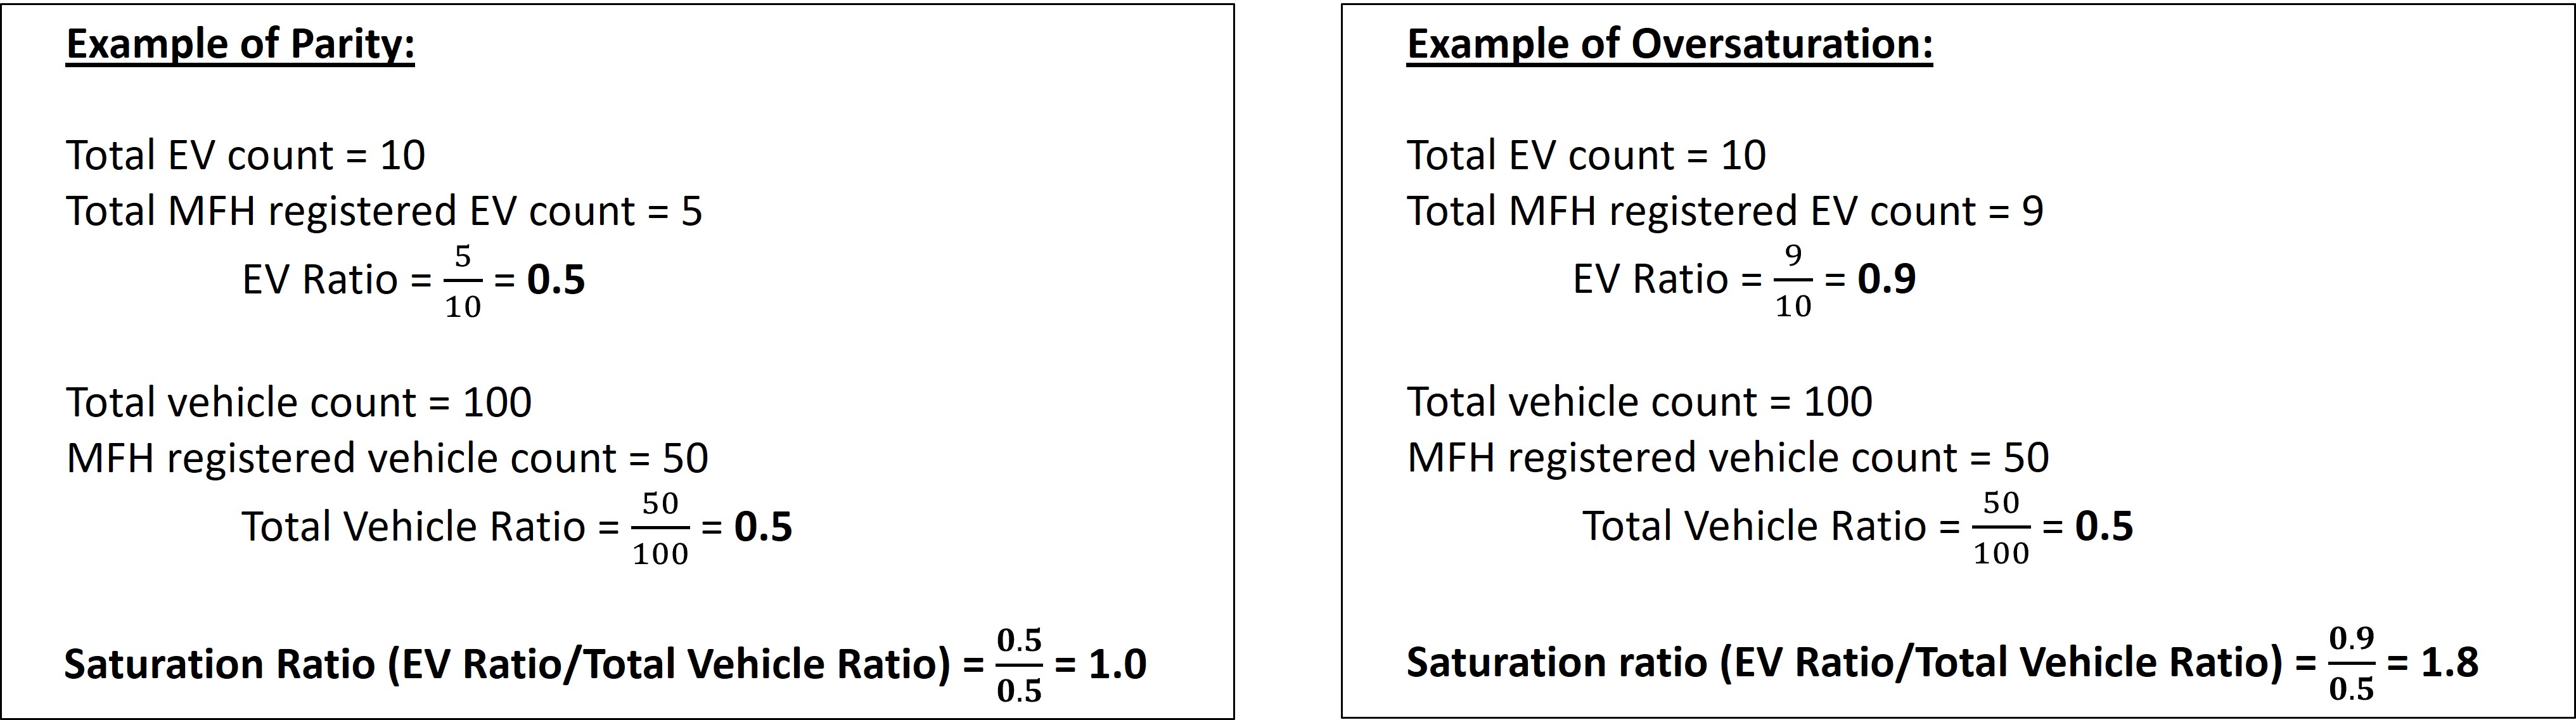
Our analysis calculates saturation ratios that compare total vehicle registration with EV registration by housing type. It does not take into consideration the total mix of housing in each ZIP code, only the housing units associated with individual vehicle registrations. For each ZIP code, we calculated the fraction of all EVs that are registered to MFHs, and the fraction of all vehicles of any type that are registered to MFHs. We refer to the ratio of the former to the latter as the MFH EV saturation ratio, and it can be understood as measuring whether MFH residents are as likely as SFH residents to own EVs. We repeat these calculations for SFHs to calculate the SFH EV saturation ratio for each ZIP code. (see Figure 1). Therefore, each ZIP code is represented by two saturation ratios, one each for single-family and multifamily. A saturation ratio of 1 indicates parity (i.e., EV registrations within the dwelling type are proportional to the overall EV adoption rate and the vehicle registration rate among that dwelling type). Less than 1 means EVs are undersaturated and greater than 1 means EVs are oversaturated within the dwelling-type.
_and_oversaturation_(right).jpg)
To determine statistical significance of these relationships, we used the hypergeometric distribution model of the SciPy–Stats package in Python. Using vehicle counts as an example, it uses total count of all vehicles and total EV count. Then when choosing randomly from a subgroup such as multifamily vehicles, the model calculates the probability of finding a given number of EVs within the multifamily subgroup if choosing randomly from the finite number of total vehicles. We used the cumulative distribution function to generate p-values for significance of undersaturation by dwelling type in each ZIP code because it measures probability of observing lower counts than expected; we used the survival function generated p-values for significance of oversaturation because it measure probability of observing higher counts than expected.
3. Findings
In 2022, EV adoption by multifamily residents was limited. Out of 620 ZIP codes, 418 had no EVs registered at multifamily residences (67.4% of ZIP codes), and another 65 had fewer than five EVs registered (10.5%) (Table 1). Small sample sizes meant that there was not much evidence of significant oversaturation of EVs in multifamily. The two ZIP codes that had p-values of less than 0.05 for oversaturation (ratio > 1.0) both had less than five EVs. Multifamily residences were more likely to be undersaturated, with 142 ZIP codes (22.9%) being statistically significant.
For single-family residences, 103 ZIP codes had fewer than five EVs registered (16.5%), and 255 ZIP codes had no EVs registered (41.1%). While there were only 34 ZIP codes where single-family EV adoption was significantly undersaturated (5.5%), 87 ZIP codes were significantly oversaturated (14%).
For multifamily, undersaturation ratios ranged from 0.09 to 0.92, with a median of 0.44 and for single-family, undersaturation ratios ranged from 0.22 to 0.95 with a median of 0.76 (Figure 2). Almost all locations with undersaturation of single-family had high EV counts in the “other” category that was not included here. Single-family oversaturation ratios ranged from 1.05 to 2.84 with a median of 1.20 and multifamily oversaturation ratios are influenced by small sample sizes (Figure 3).


The spatial distribution of both oversaturated single family and undersaturated multifamily follow a similar pattern, concentrated in Colorado’s Front Range population centers (Denver, Boulder, Fort Collins, Colorado Springs, and Pueblo) where EV counts are highest. In addition, communities along I-70 from Denver to Grand Junction, and the Durango area are also hot spots for EV adoption by single-family residences.
Note that each ZIP code has four saturation ratios shown on the two maps: undersaturation for both MFH and single family, and oversaturation for both MFH and single family. Data inputs for this analysis and all generated saturation ratios are all provided as Supplemental Information.
As communities and states continue to invest in electric transportation infrastructure, the fate of vehicle owners in multifamily residences looms large. This analysis of vehicle registration data by housing type can inform strategically planned investments, including electric vehicle access and associated charging infrastructure, so that multifamily residents do not become undersaturated as EV owners. Future analysis will explore the potential causes of the areas of statistically significant over and undersaturation found in this study.
Acknowledgements
This work was authored by the National Renewable Energy Laboratory, operated by Alliance for Sustainable Energy, LLC, for the U.S. Department of Energy (DOE) under Contract No. DE-AC36-08GO28308. Funding provided by the U.S. Department of Energy Office of Energy Efficiency and Renewable Energy Vehicle Technologies Office. The views expressed in the article do not necessarily represent the views of the DOE or the U.S. Government. The U.S. Government retains and the publisher, by accepting the article for publication, acknowledges that the U.S. Government retains a nonexclusive, paid-up, irrevocable, worldwide license to publish or reproduce the published form of this work, or allow others to do so, for U.S. Government purposes.
The authors would also like to thank Ambarish Nag (NREL) and Bonnie Trowbridge and Sonja Meintsma at Drive Clean Colorado for advice on the direction of data analysis, and Michael Deneen (NREL) for thoughtful feedback on earlier drafts. Any remaining errors or omissions are our own.