

1. Questions
While public electric vehicle (EV) charging stations complement residential and workplace charging options (Zhang et al. 2023), their expansive deployment remains a crucial strategy to curb range anxiety and provide EV owners with the assurance and convenience of reliable charging options. As of April 2024, there were over 62,000 public charging stations deployed in the United States, offering approximately 167,000 individual charging outlets (U.S. Department of Energy, n.d.). Over time, charger installation has steadily grown, reflecting the increasing interest in such infrastructure investment from both public and private entities (Chu et al. 2023).
The time needed for EV travelers to charge at public charging stations can vary due to power levels, their EV’s battery capacity, the starting state of charge, and the desired level of charge at the end of the session. Estimated charging times for a fully depleted EV battery range from 4 to 10 hours for Level 2 charging stations and 20 minutes to 1 hour for DC fast charging (DCFC) stations; in contrast, filling up a gas tank typically takes only a few minutes (U.S. Department of Transportation 2024). Due to longer charging times, EV drivers often plan their charging sessions to coincide with other activities, like shopping, dining, or running errands, to make efficient use of their time while replenishing their vehicles charge. This raises an important research and practice question that this paper aims to address:
- What types of businesses are close to public charging stations and which productive activities can EV drivers partake in during their charging process?
Charging station selection and use may be influenced by the affordability of restaurants, stores, and establishments surrounding charging infrastructure in urban areas. If chargers predominantly cluster next to high-end and luxury retail shops and businesses, public charging might not be an option for all income groups. Hence, this study also aims to address the question:
- What is the distribution of pricing levels of local businesses that are located next to public charging stations?
We answer these questions examining pertinent data in Chicago, Illinois.
2. Method
We use Alternative Fuels Data Center (AFDC) data to pinpoint charging infrastructure locations in Chicago (U.S. Department of Energy, n.d.), Illinois, while information related to Chicago businesses is acquired from the U.S. business database ReferenceUSA (Data Axle 2024), including company name, executive title, establishment year, address, opening hours, etc. These businesses are categorized into six groups: food (e.g., restaurant, bar, fast food), shop (e.g., alcohol, beauty, grocery store), public (e.g., school, place of worship, cinema), historical (e.g., monument, castle, memorial ground), leisure (e.g., fitness center, picnic table, dance hall), and tourism (e.g., hotel, museum, gallery).
The price range associated with visiting each business is retrieved using Google Maps API (Google 2023). The price range has six tiers (from least to most expensive), indicated by the number of dollar signs assigned by Google Maps reviewers. To infer affordability, we focus solely on dining and shopping premises.
Through the selection of businesses located within 0.5 miles (~0.8km) walkable distance from public charging stations, we identify activities that can be pursued while charging in Chicago, IL and the price range associated with shopping and dining experiences close to charging infrastructure. We also conducted a sensitivity analysis with shorter distances, specifically 0.25 miles (~0.4 km) and 0.1 miles (~0.16 km).
We use data analytics to identify businesses located within specific walking distances from public charging stations in Chicago. By categorizing these businesses and assessing the price range of nearby dining and shopping establishments, we examine the accessibility and affordability of activities available to EV users.
3. Findings
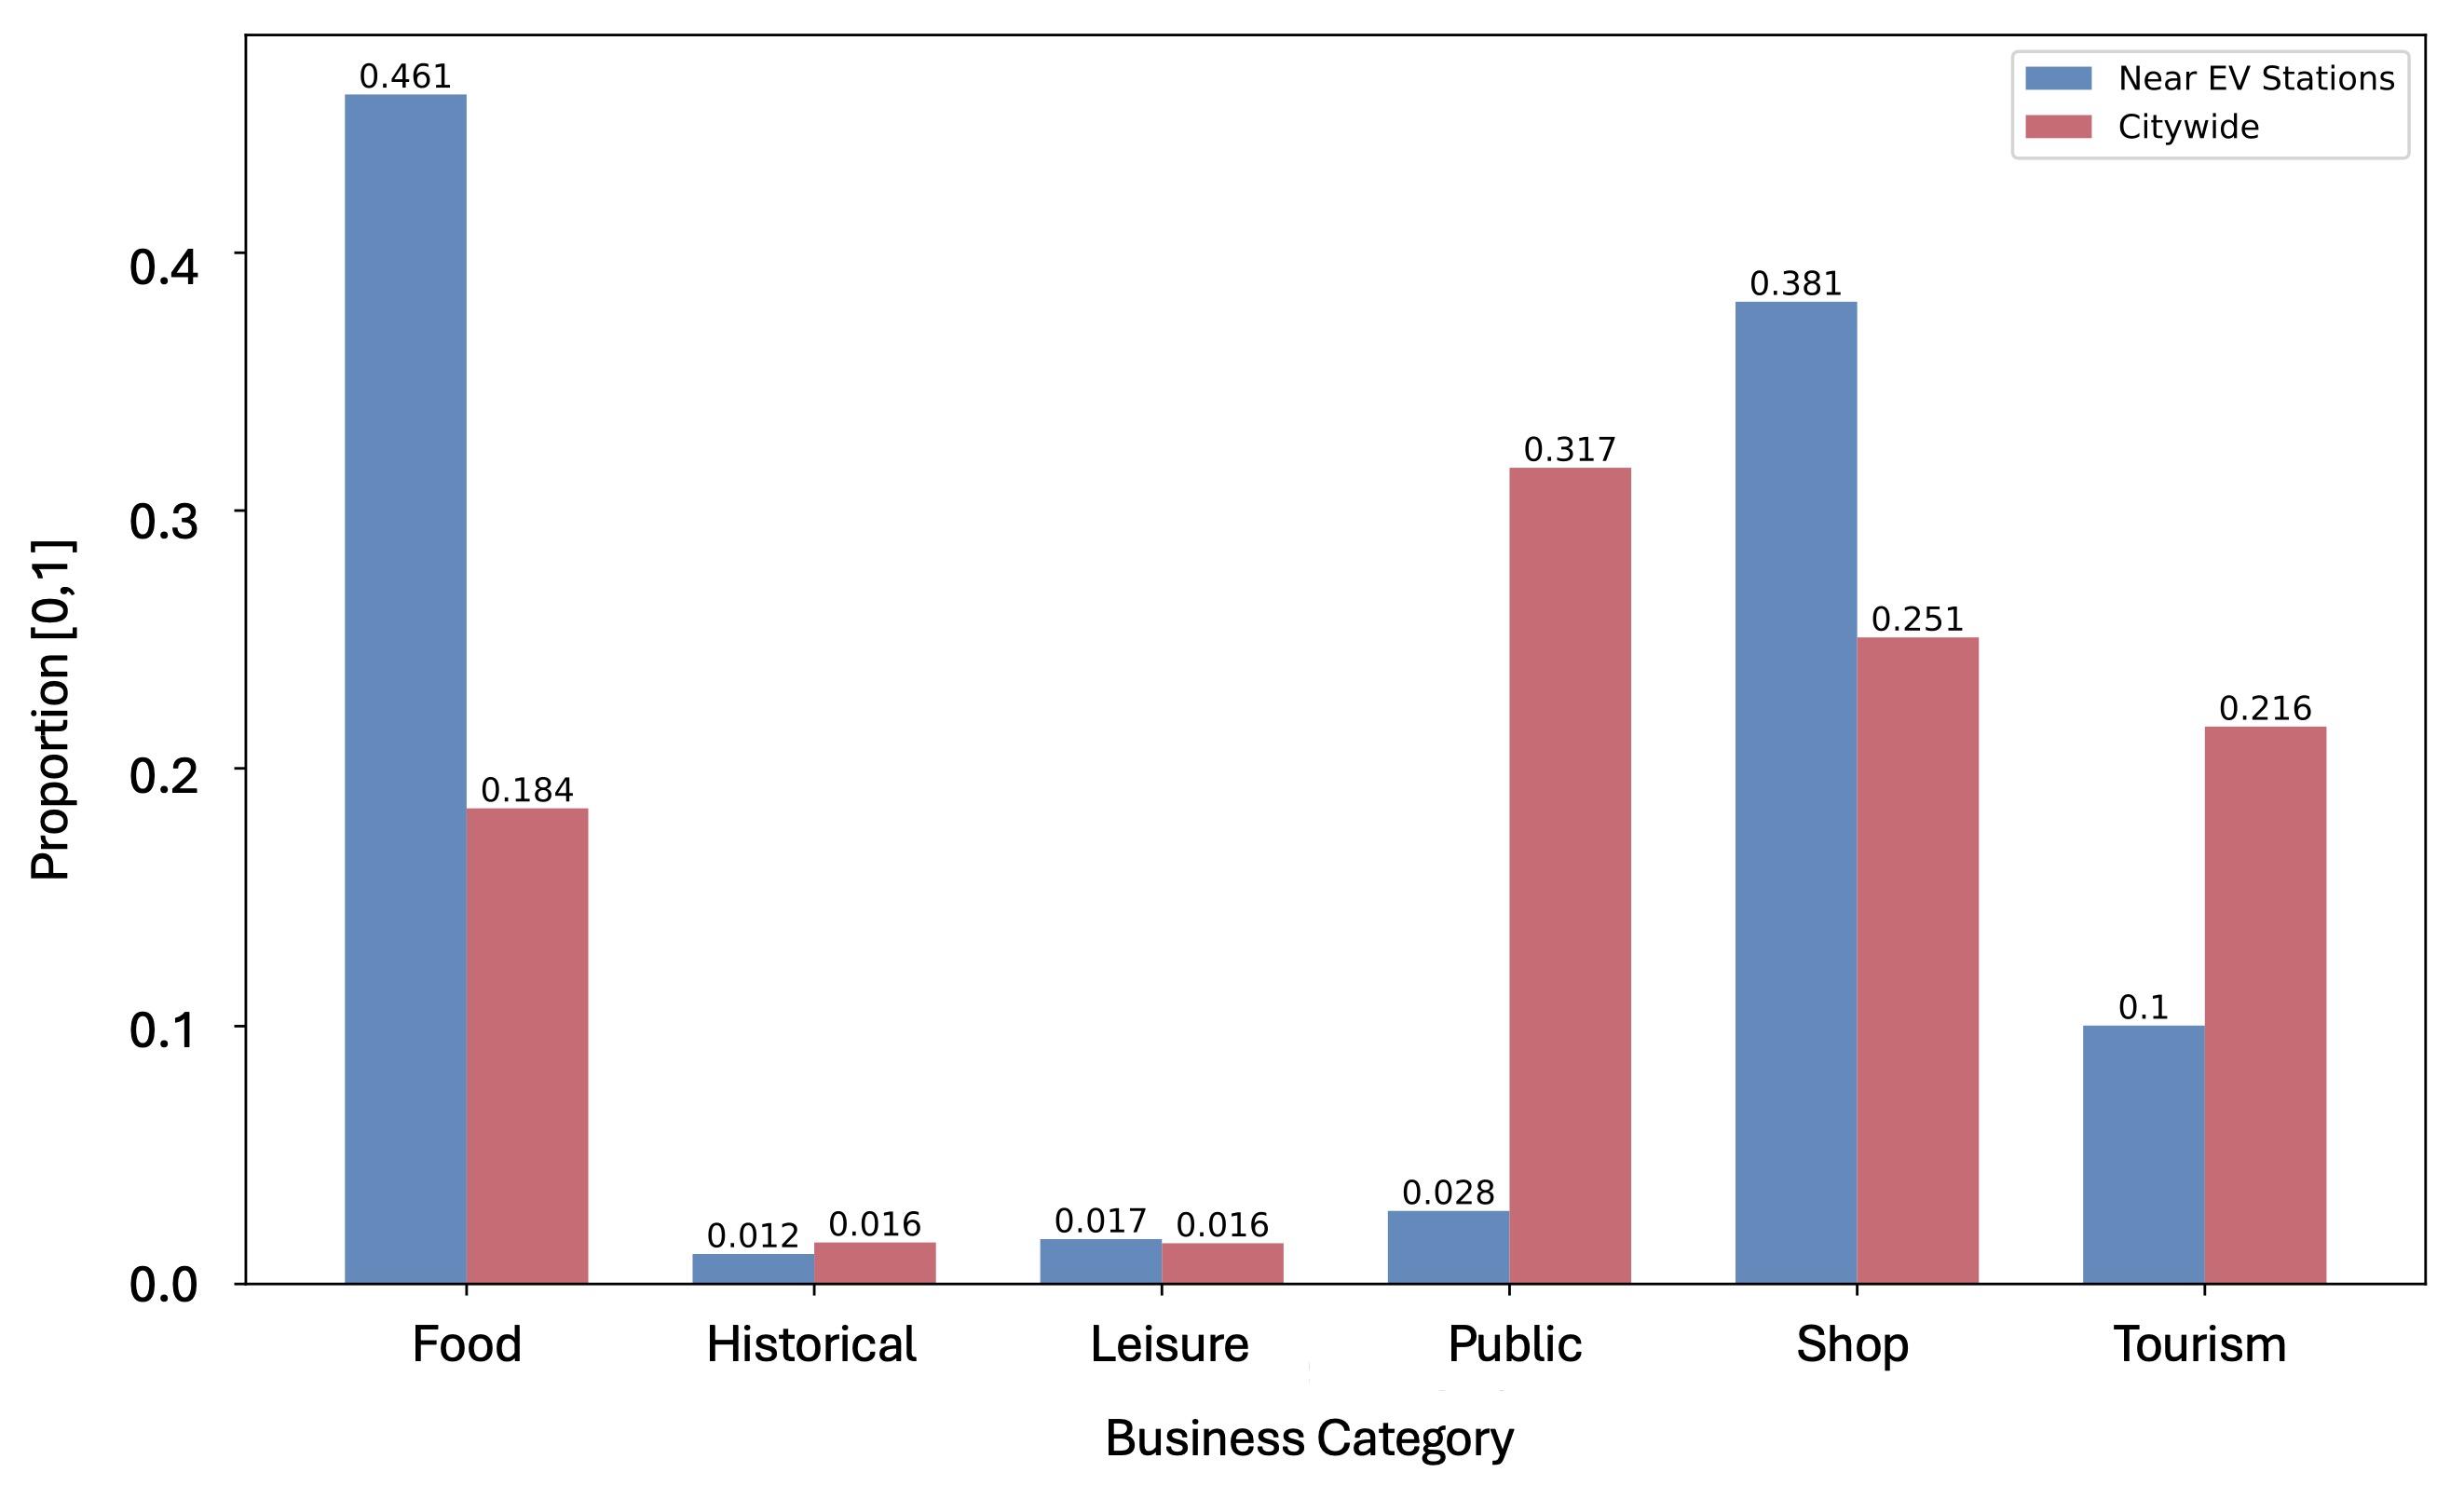
Figure 1 presents the distribution of businesses in the vicinity of Chicago’s public charging stations, compared to the citywide distribution. Food and shop categories dominate the business environment near charging stations, with proportions of 46.1% and 38.1%, respectively. In contrast, the citywide proportions for these categories are lower, at 18.4% for food and 25.1% for shops. In Chicago, charging stations are typically located in commercial areas where dining and shopping options are offered. In contrast, public premises are significantly less found near charging stations, decreasing from 31.7% citywide to just 2.8% near chargers.

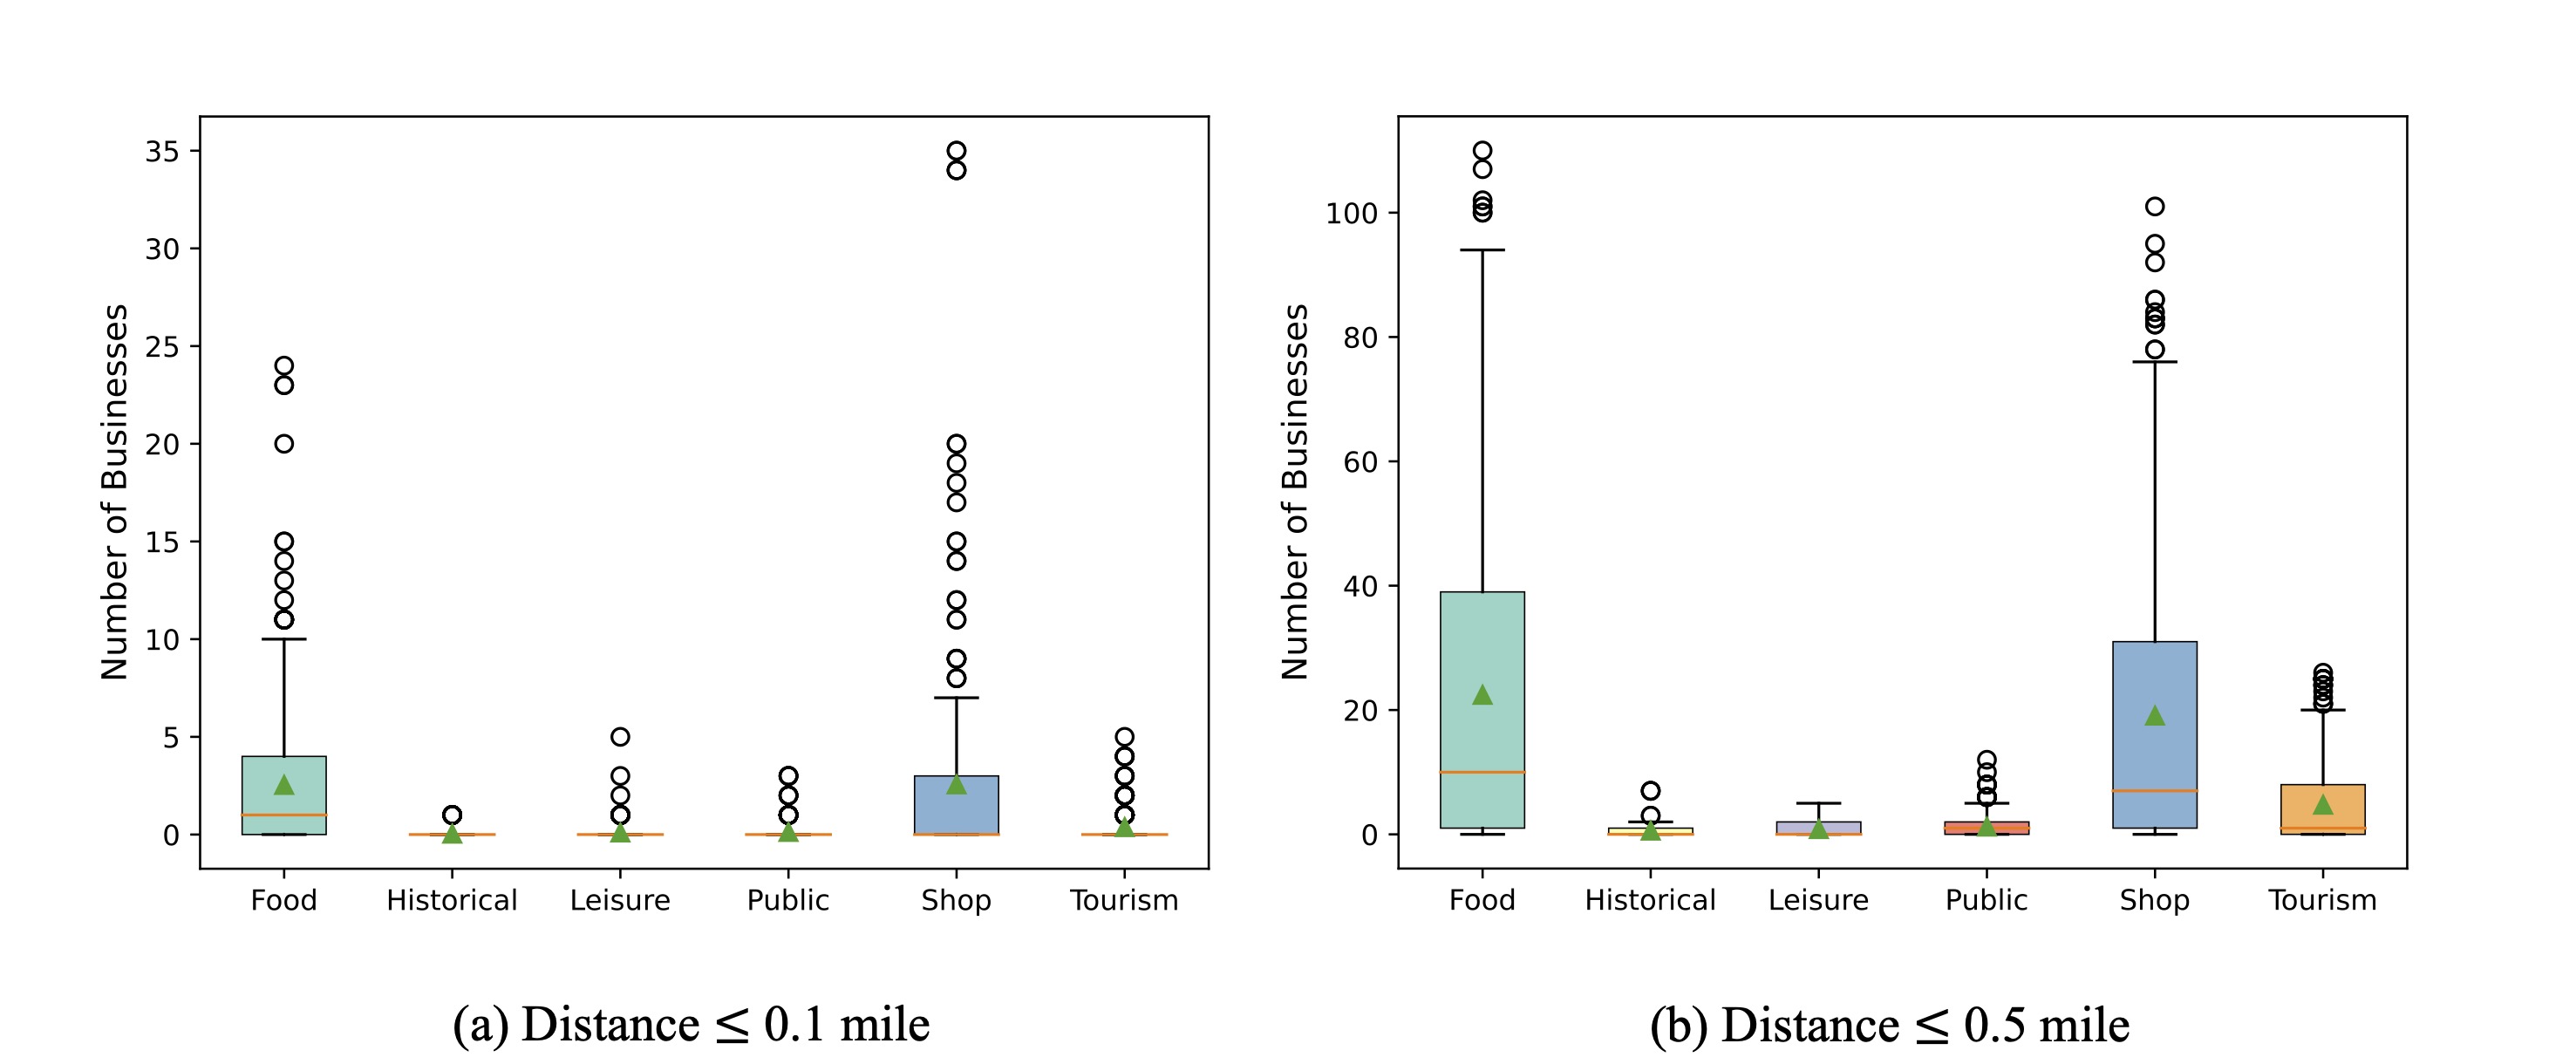
Figure 2 presents the distribution of businesses in the vicinity of Chicago’s public charging stations, with additional analysis provided through sensitivity testing across different distance thresholds (0.1 and 0.5 miles). Charging stations are still predominantly surrounded by food and dining options. For a 0.5-mile threshold, the median number of food establishments near a charging station is 10, with a mean of 22.42. Even at a smaller 0.1-mile distance, there is a median of 1 food business nearby. Shops exhibit a similar pattern, with a median of 7 businesses within 0.5 miles and 0 within 0.1 miles, and a mean of 19.08 businesses at the 0.5-mile range. On the contrary, historical and leisure-related businesses are relatively scarce. Notably, tourism businesses have a median value of 0 at both distances, but their presence increases slightly at longer distances, with a mean of 4.75 at 0.5 miles compared to just 0.37 at 0.1 miles. While EV charging stations provide access to a diverse range of activities, the opportunities are overwhelmingly tied to dining and shopping.

Figure 3 presents the distribution of dining and shopping opportunities near EV charging stations across different pricing levels, compared to the citywide distribution. Most food and dining options near charging stations are in the lower pricing tiers ($ and $$). While the citywide distribution features a higher proportion of dining options in the lowest tier ($), the tiers ($ and $$) are still very common near EV stations, indicating a variety of affordable dining options. The number of high-end dining establishments ($$$ and above) is relatively low near EV charging stations, although a few outliers suggest that premium dining experiences are available, albeit infrequently. Similarly, most shops near EV charging stations fall into the lower and mid-tier pricing categories ($ and $$), with a higher concentration in the $$ category compared to food establishments and their citywide distribution. The distribution of shops in higher pricing categories ($$$ and above) shows fewer options near charging stations, indicating that high-end shopping experiences are less common around EV infrastructure.
In Chicago, Illinois, charging could allow EV drivers to engage in affordable ancillary activities, such as dining and shopping, while their vehicles charge. The higher proportion of affordable options near charging stations can also support longer charging times.

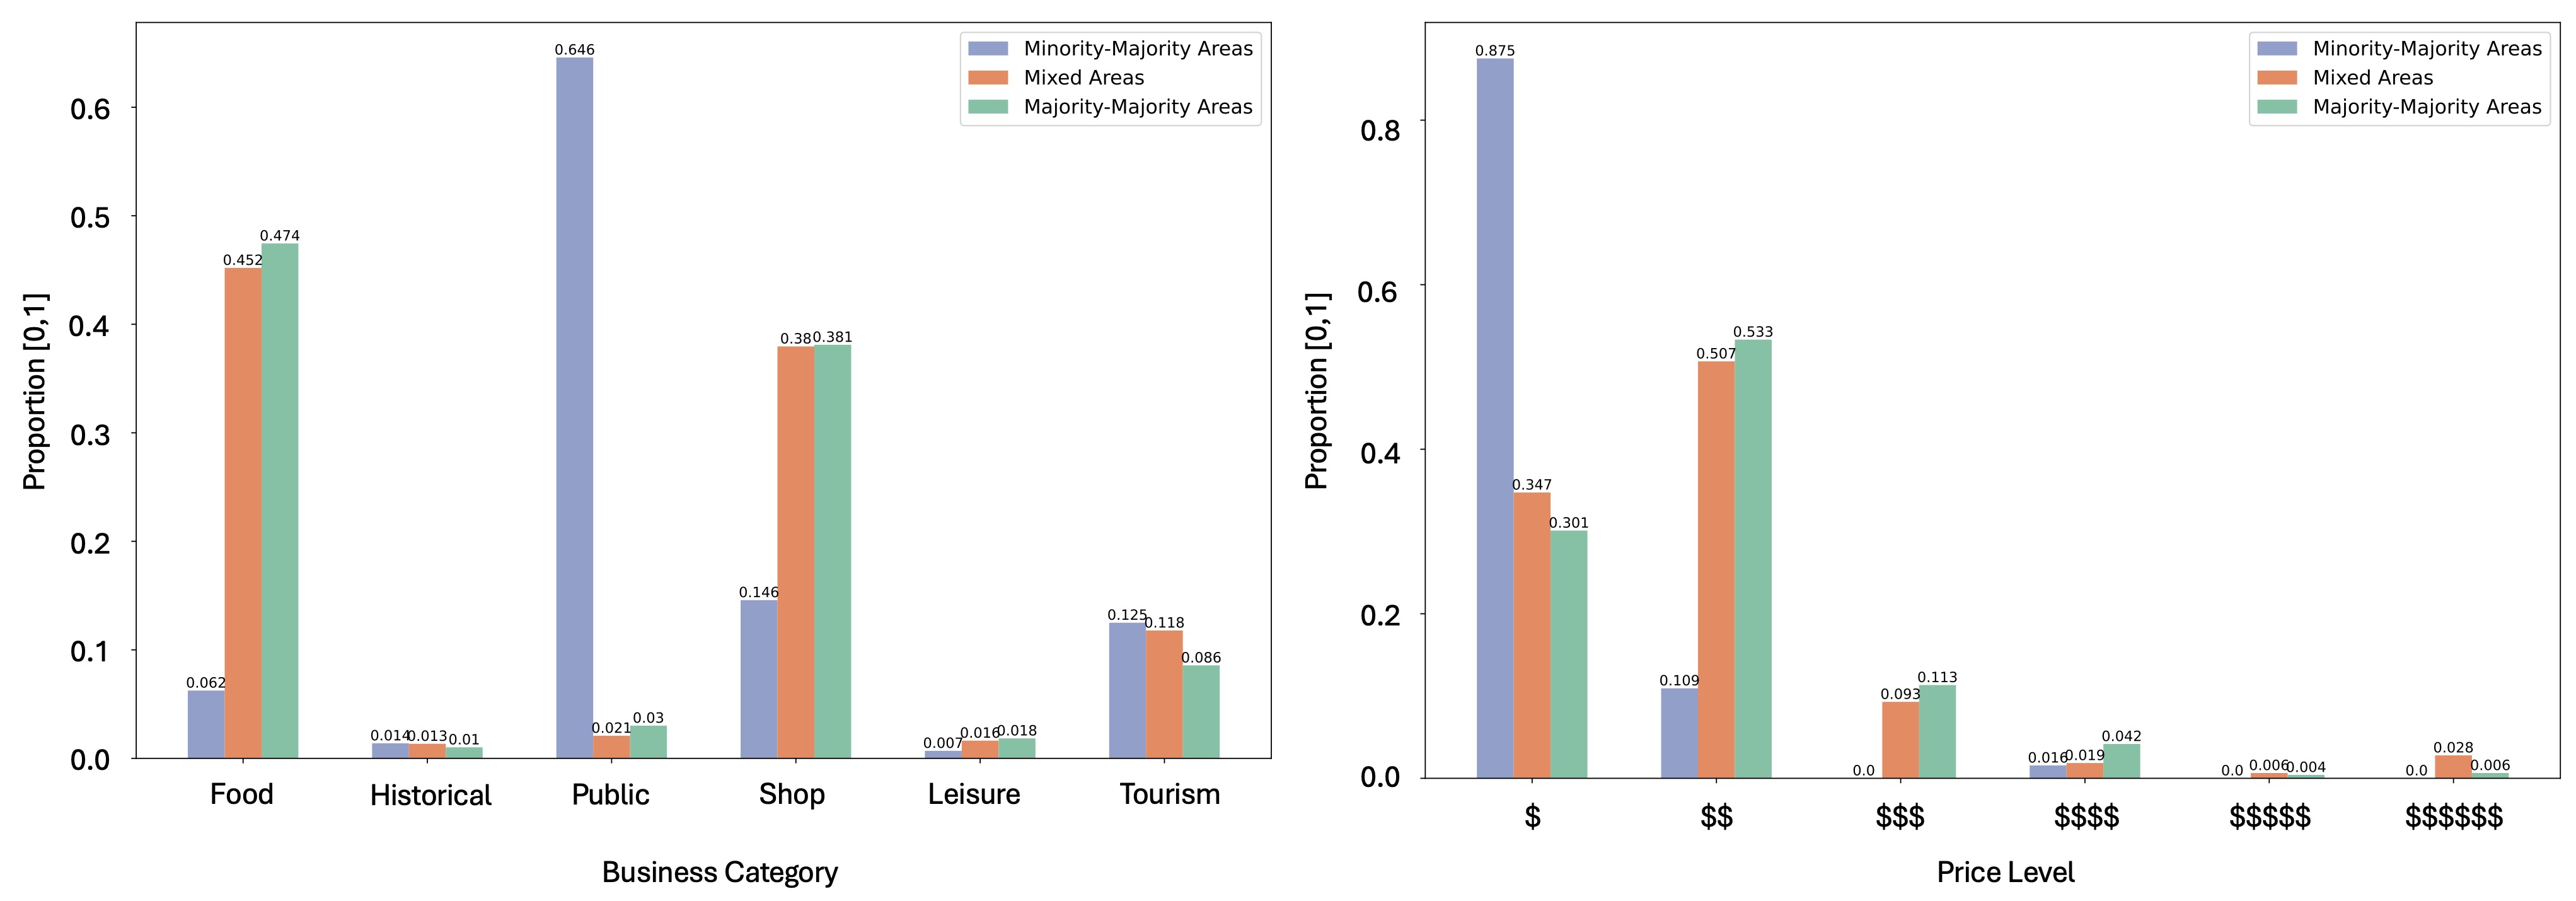
Chicago is one of the most segregated US cities; urban segregation is often correlated with income, wealth, and access to services (Talen 2006). In this context, we explore the relationship between the location of public EV charging stations, surrounding business, and racial segregation. Figure 4 shows the distribution of EV charging stations superimposed on a map of racial segregation. Minority-majority areas (where the white population is less than 25%) have fewer public charging stations compared to majority-majority areas (where the white population exceeds 63%). The public charging station shares for minority-majority areas, mixed areas, and majority-majority areas are 8.64%, 34.88%, and 43.52%, respectively. Although minority-majority areas have fewer food and shop establishments near charging stations, the affordability of available businesses remains high, with most businesses in the lowest price tiers ($), shown in Figure 5.


4. Discussion
While prior research (Hsu and Fingerman 2021; Carlton and Sultana 2023) has focused on the physical accessibility of public EV charging stations across different income levels, racial demographics, and housing types, our study examines the affordability of amenities nearby chargers. On average early EV adopters may be wealthier (Plötz et al. 2014), but this does not necessarily imply that those using public charging stations are similarly affluent. In fact, residents of single-family homes, who tend to have higher income, are more likely to use home charging. In contrast, residents of multi-unit dwellings, who are more likely to rely on public charging, include a larger proportion of lower-income individuals (Zhang et al. 2023). As the EV market continues to grow and evolve, it is anticipated that more people across income levels will adopt EVs, as policies and incentives make EVs more accessible to the main market. This prospect highlights the importance of studying the affordability of nearby amenities, as public charging stations may often serve diverse groups of EV drivers.
This study contributes to a broader understanding of equitable access to EV charging infrastructure. Focusing on major cities, specifically Chicago, our analysis reveals that most establishments near public charging stations, such as dining and shopping venues, are reasonably priced and serve a diverse range of income groups. This finding challenges the common perception that charging stations are predominantly located in areas with high demand and costly surrounding services, but, at the same time, shows that chargers are situated in whiter neighborhoods. However, while our study examines proximity and affordability, it does not assess the ease with which these businesses can be accessed on foot. Future research should incorporate walkability scores or pedestrian network analysis to provide a more comprehensive understanding of accessibility from charging stations.