
1. Questions
Music is not simply a form of entertainment, as recent studies have demonstrated the potential positive impacts of attending live music performances on people’s mental health (Fancourt and Williamon 2016; Trost and Trevor 2024). Having adequate access to live music performance opportunities would be valuable in promoting one’s quality of life. Despite these potential benefits, access to live music is not evenly distributed geographically. There have been limited research efforts to quantify transportation accessibility to live musical performances and discuss how to alleviate socio-spatial disparities in such accessibility with a few exceptions (e.g., Li 2023). We aim to investigate the following three research questions to fill this significant knowledge gap in transport and cultural geography: What spatial patterns and disparities exist in accessibility to live Western classical music performances? How does access to live Western classical music vary between region and season? Which sociodemographic characteristics are associated with access to live Western classical music performances? We aim to analyze spatial accessibility to 100 of the most well-known pieces of classical music from the Western world. However, the dataset used in this paper should be considered as just a small portion of what we understand to be classical music and does not represent all the diverse types of classical music worldwide. We do not intend to position a specific genre of music at the pinnacle of performing arts and cultural excellence; instead, it is to serve as a stepping-stone to other such opportunities.
2. Methods
The most popular Western classical symphonies and concertos were selected from the “Top 100 Classical Music Works” page on the website Classical Music Only, which operates a YouTube channel with more than 220,000 subscribers and 160 million views (Classical Music Only 2024). This selection of pieces was chosen to provide a manageable way to study commonly performed pieces, as well as the notability or recognizability of these compositions in the United States. The dates and locations of the performances of the 100 pieces were collected from Bachtrack, a website that maintains the most exhaustive list of classical music events worldwide (Bachtrack 2024), We compiled and geocoded 212 instances of performances occurring between January 2024 and December 2024. To evaluate car-based accessibility to each musical performance at a county level, a 1-hour driving time isochrone was calculated using the MapBox isochrone API. Given the limited empirical data on average driving times to performing arts venues, a one-hour driving time threshold was seen to be reasonable for a recreational day trip based on the fact that the total daily driving time for American adults is around 60 minutes (VNTSC, 2017; AAA FTS, 2023). For each county, we computed the Western classical music accessibility score, which is a cumulative-opportunity type accessibility score obtained by summing the number of distinct performances that can be reached within one hour of driving.
3. Findings
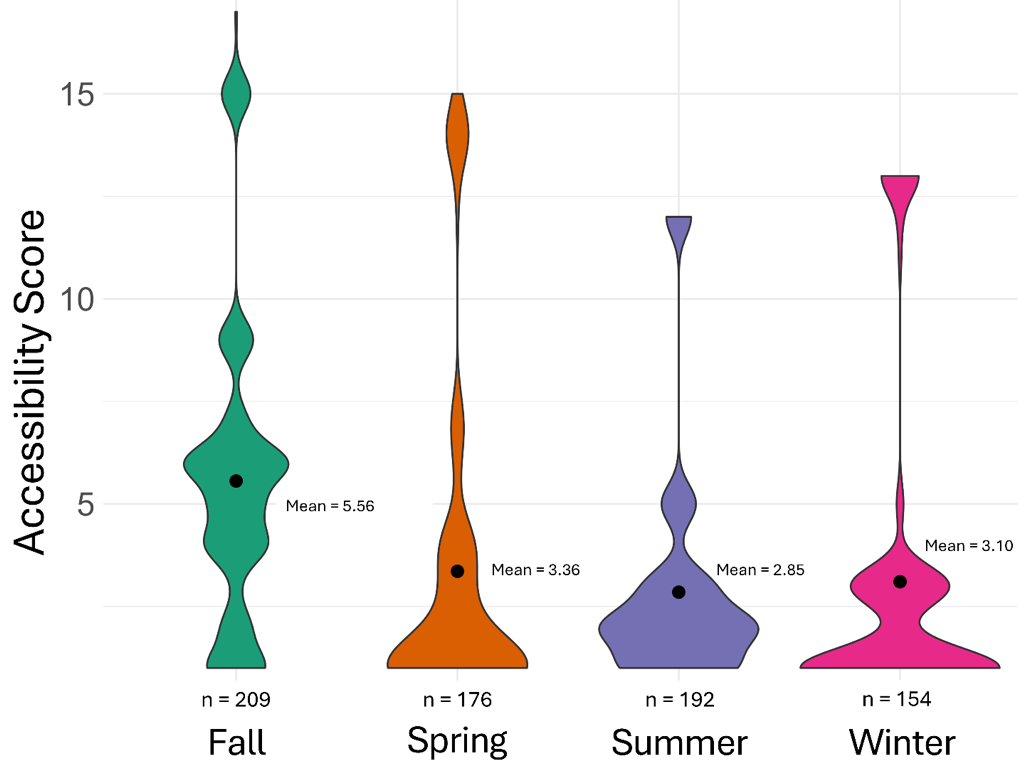
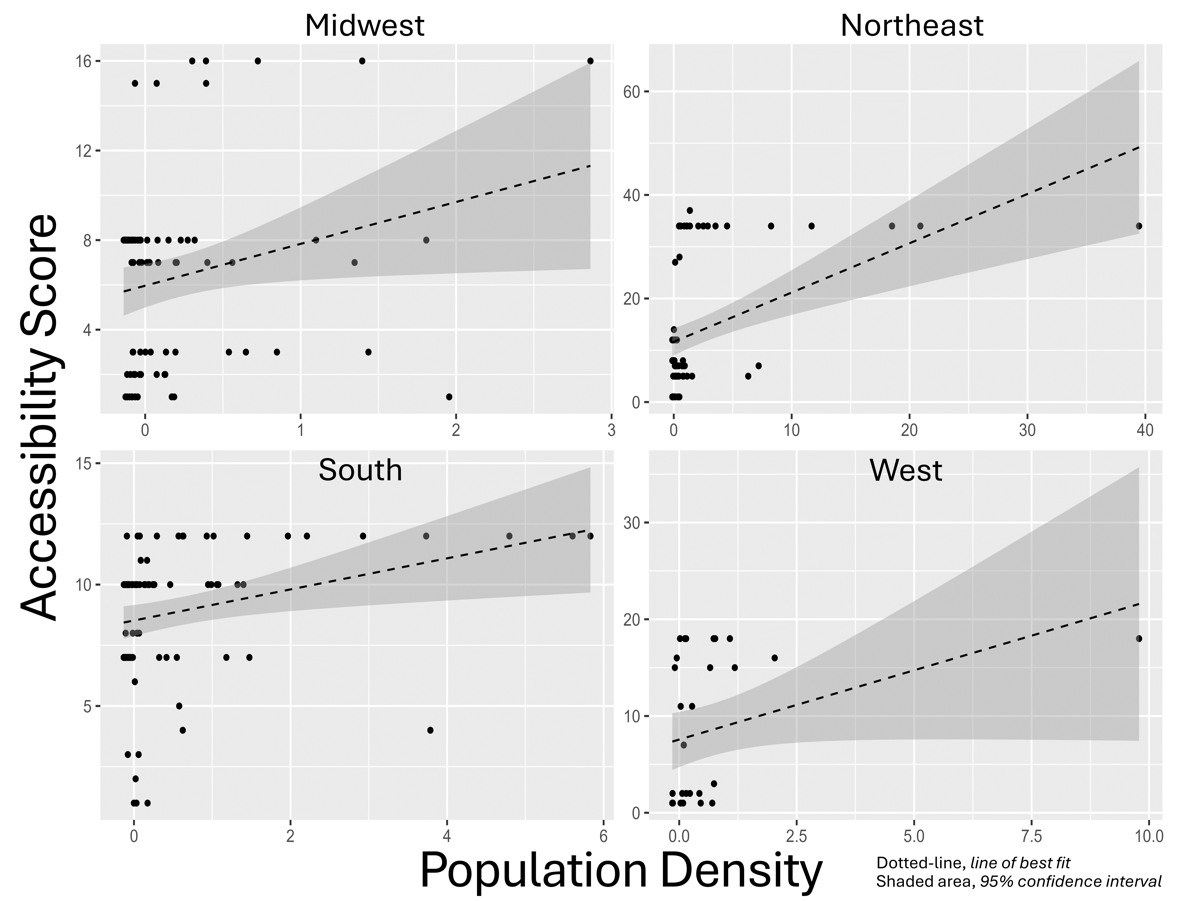
The accessibility results reveal that the individual music piece found to be the most frequently performed is Tchaikovsky’s Symphony No. 6 in B minor, or Pathetique Symphony (10 times performed), followed by Beethoven’s Symphony No. 7 in A Major, Op.92 (9 times performed). Figure 1 visualizes county-level accessibility scores as higher in metropolitan areas than in rural or less densely populated regions. Table 1 demonstrates that coastal regions, specifically the Northeast and West coasts, exhibit higher accessibility scores. In contrast, the Midwest/Great Plains and Mountain West regions lack access, except for the Detroit, Chicago, Salt Lake City, and Dallas Metro areas. However, many other metro areas, such as Nashville, Denver, and Miami, have limited or no access to these live performance opportunities. Figure 2 illustrates that Fall exhibits the highest nationwide accessibility and the lowest average score during Summer. Table 2 illustrates the results of the hurdle model. Higher-density counties with larger percentages of non-white populations and higher income levels are significantly associated with higher access to live Western classical music performances. Figure 3, a scatter plot of county-level accessibility scores plotted against population density for each geographic region, also corroborates findings from the hurdle model. We also developed an interactive online visualization embedded with recorded performances, which provides a synesthetic and immersive experience to explore transportation accessibility to music, which can be accessed via https://arcg.is/iOOmW (Supplemental Information).


A limitation of this study is the exclusion of transit-based accessibility analysis because of the lack of consistent transit data across the U.S. Because of the overall poor status of public transit systems in the United States, we speculate that transit-based accessibility to live performances of Western classical music would be lower than our driving-based results. Additional limitations include the potential incompleteness of the concert list maintained by Bachtrack and the exclusion of other types of classical music beyond Western classical music.
Despite these limitations, our study makes significant contributions to transport and cultural geography literature through visualization and statistical analysis. Enhancing people’s access to these 100 Western classical music pieces (that have been deemed “most popular” by users of Classical Music Only) may be especially important, as it would introduce diverse audiences to the much broader world of what we may call classical music as argued by Church (2015). Further, familiarity with these works will enable the public to engage in a deeper appreciation for the arts in general. Our findings, however, suggest disparities in these cultural opportunities are associated with socio-spatial variables. Given the most apparent divide was a rural-urban gap, one potential solution can be found in college towns in rural areas. College towns are often isolated pockets of relatively high infrastructure, population density, education, and wealth that have the potential to serve as a cultural “oasis” for the surrounding areas in the rural region, in addition to college students (Gumprecht 2007). Because of this, universities are well-positioned to serve as a gateway to cultural opportunities. By increasing access to these activities in underserved regions, the general public’s interest in classical music can be grown, and participation in cultural opportunities can be broadened nationwide.
Acknowledgement
Junghwan Kim was supported by the Institute for Society, Culture and Environment (ISCE) at Virginia Tech.