Loading [Contrib]/a11y/accessibility-menu.js
Skip to main content
null
Findings
  • Menu
  • Articles
    • Energy Findings
    • Resilience Findings
    • Safety Findings
    • Transport Findings
    • Urban Findings
    • All
  • For Authors
  • Editorial Board
  • About
  • Blog
  • covid-19
  • search

RSS Feed

Enter the URL below into your favorite RSS reader.

http://localhost:24995/feed
Energy Findings
October 29, 2024 AEST

Modeling the Feasibility of Fueling CNG Heavy-Duty Trucks in Toronto, Canada

Amal Ghamrawi, Hanna Maoh,
CNGDieselTrucksGTHALocation-allocation
Copyright Logoccby-sa-4.0 • https://doi.org/10.32866/001c.125061
Findings
Ghamrawi, Amal, and Hanna Maoh. 2024. “Modeling the Feasibility of Fueling CNG Heavy-Duty Trucks in Toronto, Canada.” Findings, October. https:/​/​doi.org/​10.32866/​001c.125061.
Save article as...▾
Download all (3)
  • Figure 1. Modeling framework for identifying the number and location of CNG fueling hubs
    Download
  • Figure 2. Zonal distribution of potential CNG trucks in the study area
    Download
  • Figure 3. Potential CNG Hubs and Coverage
    Download

Sorry, something went wrong. Please try again.

If this problem reoccurs, please contact Scholastica Support

Error message:

undefined

View more stats

Abstract

Compressed Natural Gas (CNG) is cleaner than diesel for powering heavy duty trucks. A framework for establishing mobile on-site CNG refueling at truck yards is proposed and evaluated for the Greater Toronto and Hamilton Area (GTHA), Canada. The locations for potential CNG hubs where mobile trailers obtain CNG to fuel parked trucks at yards were determined. Also, the demand representing parked CNG trucks was estimated across the GTHA. With 15 potential CNG hubs, location-allocation modeling suggests that one CNG hub located in the Peel region can cover 88% of the demand within a 30-minute driving window across the study area.

1. QUESTIONS

Most heavy-duty trucks in Canada are diesel-powered. Diesel exacerbates air pollution in urban areas especially when trucks idle during traffic congestion. Compressed Natural Gas (CNG) is a cleaner and cheaper fuel alternative to diesel. However, one of the major drawbacks in transitioning fleets towards CNG is the lack of available fast-fill refueling stations. One can argue that the establishment of a spatially comprehensive network of such fueling stations can be economically prohibitive (US Department of Energy 2014). Mobile on-site refueling at truck yards has not been considered in the past but has the potential to resolve the problem. Under this proposed fueling model, special trailers capable of carrying natural gas will originate from hub sites with access to natural gas to bring CNG to trucks parked at yards and fuel them overnight. The framework can be thought of as a virtual hub-and-spoke fueling model.

Given the spatial distribution of truck yards in an urban area, the paper will model the feasibility of a virtual hub-and-spoke CNG fueling network by addressing the following research questions: (a) how many CNG hub facilities will be needed to service truck yards (i.e., spoke locations) in a place like the Greater Toronto and Hamilton Area (GTHA)? Also, (b) where such hubs should be established? To our knowledge, these research questions have not been tackled in past studies.

2. METHODS & DATA

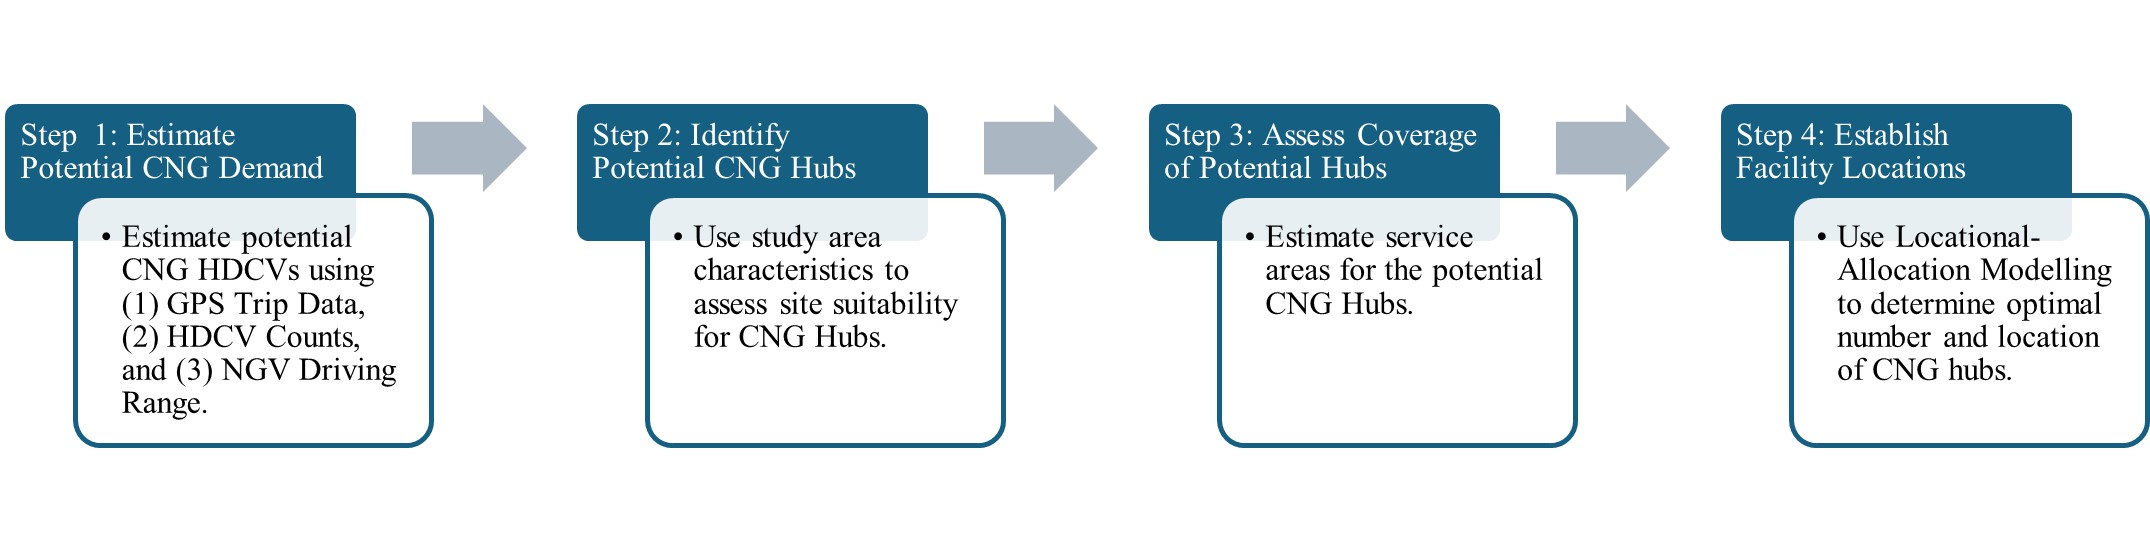
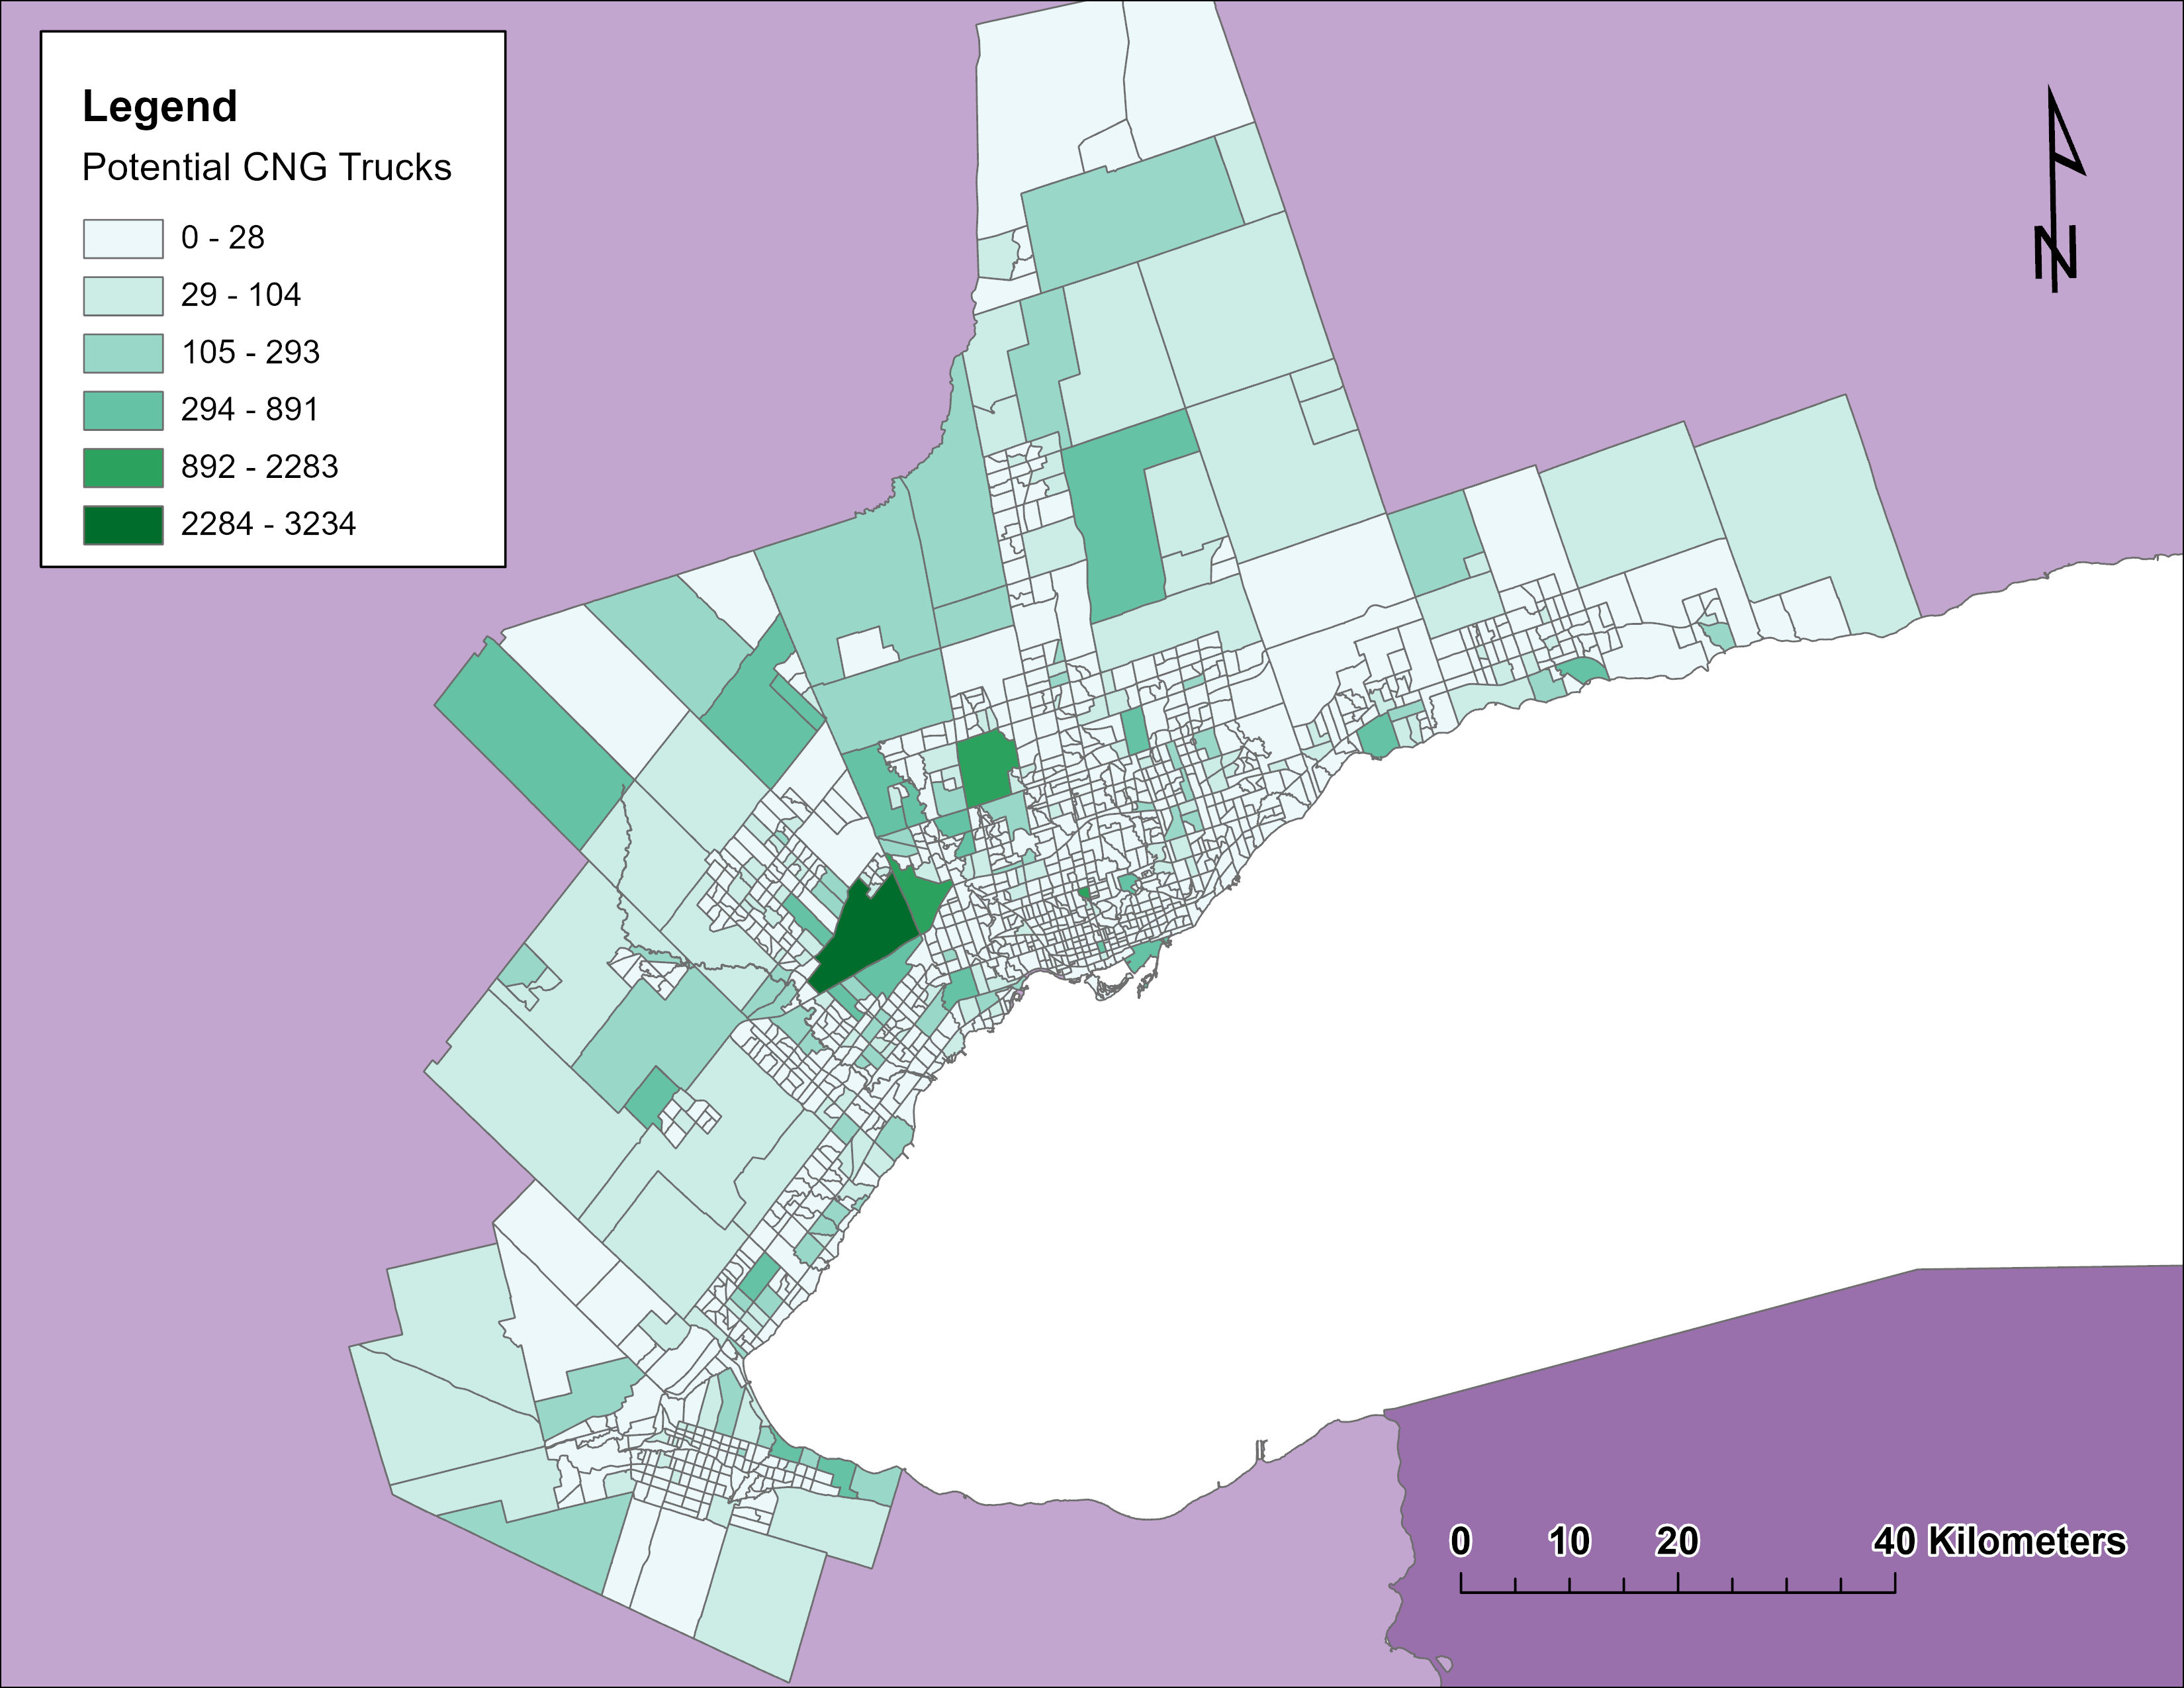
Figure 1 presents our approach, which starts by estimating potential CNG demand. The demand is based on determining the number of trucks traveling no more than 500 km from their base zone since CNG heavy-duty trucks have an estimated driving range of approximately 1000 km[1]. The study area consisted of 1,326 zones that were based on census tract boundaries. GPS truck trip data (Gingerich, Maoh, and Anderson 2016) was used to calculate the average trip length for each zone. The ratio of trips that were less than or equal to 500 km was calculated and applied to zonal counts of heavy-duty trucks (i.e., GVW Class 7 and 8). The count of trucks per zone for 2012 was obtained from the R.L. Polk & Company[2].

Figure 1
Figure 1.Modeling framework for identifying the number and location of CNG fueling hubs

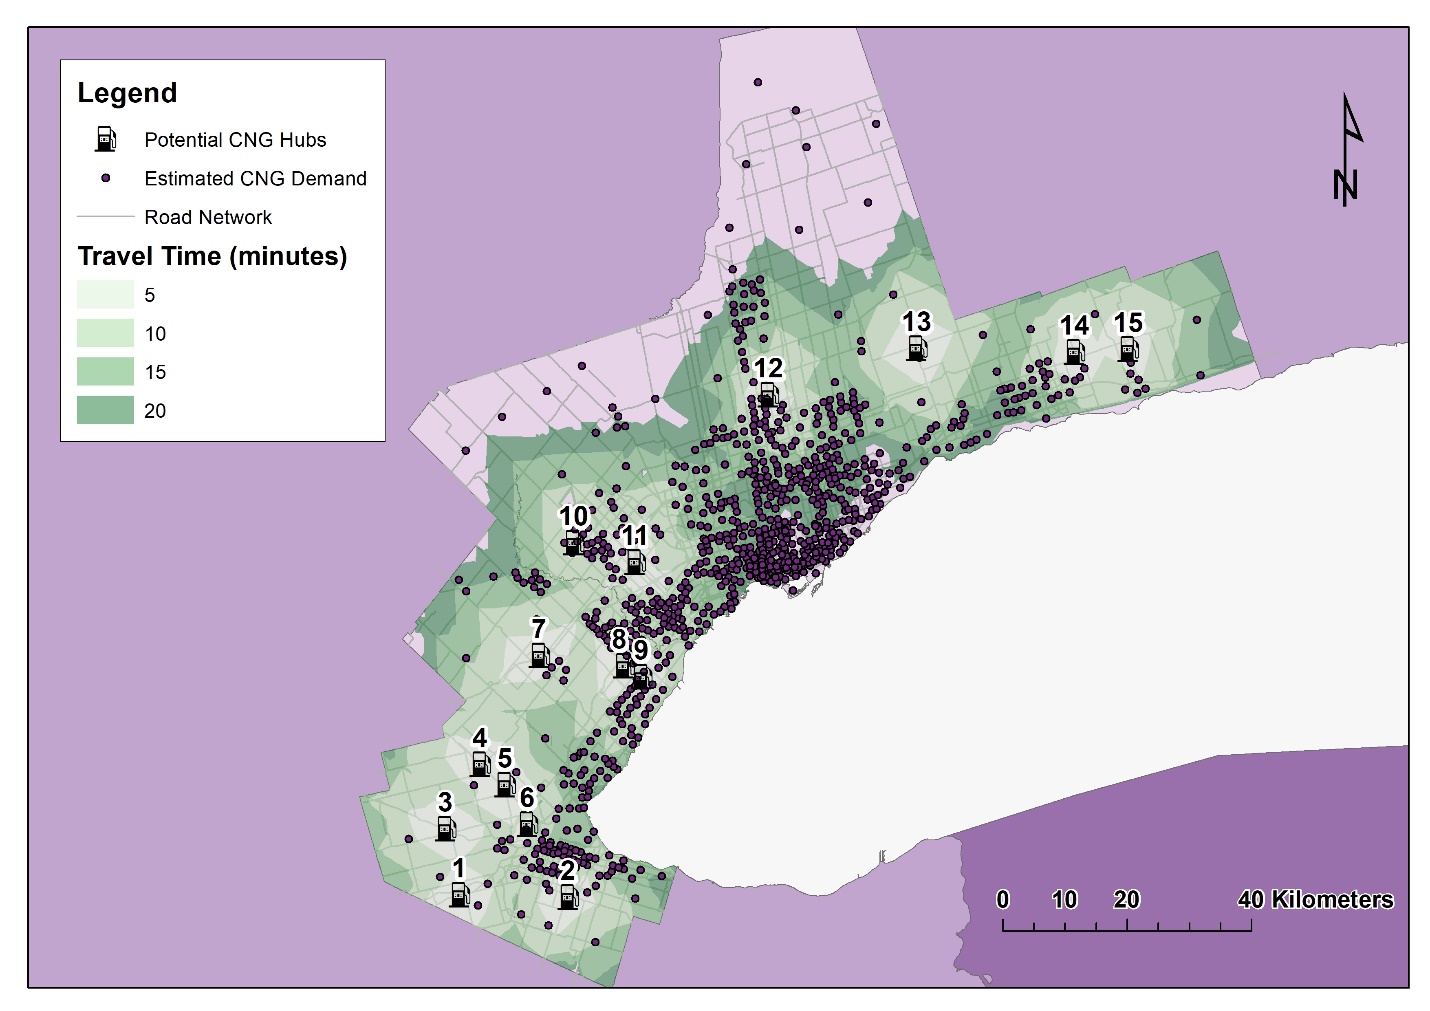
Next, multi-criteria decision analysis (MCDA) in ArcGIS software was applied to identify potential CNG hubs. Scores ranging from 1 (least suitable) to 9 (most suitable) were assigned to each of the utilized criteria. Data on land uses, major roads and natural gas pipelines were extracted from the DMTI Geospatial Database[3]. Table 1 lists the used criteria, their justification and assigned weights. Service areas ranging from five to twenty minutes of driving time were produced for the potential hubs to visually present the regions that can be reached within the pre-specified driving time windows. They also capture the level of CNG demand that could be covered by their service boundaries. Finally, locational-allocation modelling was used to select the optimal CNG Hubs from the list of potential hubs that were created in Step 3. The p-median model was utilized. Demand in the model is represented by the approximate capacity of every estimated CNG truck in each zone, which was assumed to be 90 diesel gallon equivalent. The supply (i.e., capacity of refueling tractor-trailers) was not readily available. The ratio between the capacity of an LNG refueling trailer (12,000 gallons) and an LNG truck tank (200 gallons) was used to determine an approximate value for CNG capacity. Five scenarios were examined in which each potential CNG Hub had 5, 10, 15, 20, 25 or 30 trucks with CNG trailers to supply trucks at spoke locations. Each scenario was assessed by varying the maximum number of Hub facilities to establish from 1 to 15. In total, 90 scenarios (i.e., model runs) were tested.

Table 1.Criterion and Weights for Site Suitability
Criteria
(Weight, wi)
Justification Scoring Approach
Zonal Population, P
(0.30)
The criterion ensures the selection of CNG hubs at locations with less inhabitants to mitigate hazards. The criterion is the most important and as such is assigned a weight of 0.30 0≤ P ≤2000: suitability score of 1
2000< P ≤3000: suitability score of 2
3000< P ≤4000: suitability score of 3
4000< P ≤5000: suitability score of 4
5000< P ≤6000: suitability score of 5
6000< P ≤7000: suitability score of 6
7000< P ≤8000: suitability score of 7
8000< P ≤9000: suitability score of 8
9000< P ≤10000: suitability score of 9
P > 10,000: Not suitable
Open Area Land Use
(0.30)
The criterion ensures the availability of space to establish CNG hubs away from built up areas. The criterion is equally important to zonal population and is assigned a weight of 0.30 Open area land use: suitability score of 5;
All other sites were given a not suitable classification.
Natural Gas* Pipelines (0.20) The criterion ensures the availability of existing CNG pipeline infrastructure to facilitate the establishment of hubs. The criterion ranks 3rd as the availability of CNG infrastructure will reduce the cost of building CNG hubs. A weight of 0.20 is assigned to this criterion. 0 - 2.80 km: suitability score of 9
2.81 - 6.30 km: suitability score of 8
6.31 - 10.40 km: suitability score of 7
10.41 - 15.40 km: suitability score of 6
15.41 – 21.0 km: suitability score of 5
21.1 - 26.80 km: suitability score of 4
26.81 - 33.10 km: suitability score of 3
33.2 – 40.0 km: suitability score of 2
40.1 - 46.80 km: suitability score of 1
46.81 - 55.20 km: Not suitable
Major Road Line Segments*
(0.15)
The criterion ensures accessibility to transportation infrastructure to move CNG trailers between hubs and truck yards. Ease of movement of CNG trailers is important but not as critical as above factors and as such a weight of 0.15 is assigned to this criterion 1 - 1.30 km: suitability score of 9
1.31 - 2.40 km: suitability score of 8
2.41 - 3.90 km: suitability score of 7
3.91 - 5.90 km: suitability score of 6
5.91 - 7.90 km: suitability score of 5
7.91 - 9.60 km: suitability score of 4
9.61 - 11.20 km: suitability score of 3
11.21 - 12.50 km: suitability score of 2
12.51 - 14.30 km: suitability score of 1
Waterbodies (0.05) The criterion ensures CNG hub locations are far from waterbodies to mitigate hazard. A weight of 0.05 is assigned to this criterion as it is perceived the least important among the utilized criteria in the model Sites with waterbodies were given a not suitable classification, other sites were given a suitability of 5.

* Note: A raster grid was created with each cell representing Euclidean distance from a line feature. Closer distances were assigned higher suitability score. Distance values were classified into several classes based on their natural breaks. The first class was assigned a score of 9, second a score of 8 and so on until last class which was assigned a score of 1.

3. FINDINGS

Estimates from Step 1 of the analysis, which are shown in Figure 2, suggests that 67% of the heavy-duty truck population in the GTHA has the potential to convert to CNG. That is, the travel time of these trucks did not exceed 500 km from their base zones to their destinations. Fifteen potential CNG hubs were identified in Step 2, many of which were in the southwestern region of the study area. These hubs are situated on open space and are assumed to have multiple CNG dispensers that would fuel the trailers serving trucks at the spoke locations. The estimated coverage produced by these hubs is shown in Figure 3. The service areas for the fifteen potential sites in Step 3 of the analysis cover approximately 83% of the estimated demand and cover the zone with the highest demand within a 20-minute driving range.

Figure 2
Figure 2.Zonal distribution of potential CNG trucks in the study area
Figure 3
Figure 3.Potential CNG Hubs and Coverage

The results from Step 4 are presented in Tables 2 and 3. Table 2 provides the number of times each potential CNG hub was selected in all the scenarios examined by the p-median model. The top 4 facilities are CNG Hubs 11, 12, 2 and 9. To ensure that these hubs can effectively serve the CNG trucks, their coverage was assessed. More specifically, Hub 11 was assessed individually and then with either Hub 12, 2 or 9. As shown in Table 3, Hub 11 can cover 88% of the demand points in the GTHA within a 30-minute drive. An additional hub will increase the coverage by as much as 7%. Therefore, one CNG hub (i.e., Hub 11) accounts for the majority of the CNG fueling demand in the GTHA. The conducted analysis suggests that the establishment of a virtual hub-and-spoke CNG fueling model in a large metropolitan area is feasible. Such option will only require opening two major hubs to cover 95% of the demand. As a cost-effective approach, the proposed fueling model can speed up the transition towards adopting CNG powered trucks that rely on home-base overnight fueling. The analysis can also be easily duplicated for other large metropolitan areas.

Table 2.Summary of selected facility frequency
Facilities Frequency
1 30
2 78
3 35
4 6
5 31
6 12
7 54
8 24
9 66
10 42
11 90
12 84
13 60
14 72
15 36
Table 3.Coverage of optimal CNG hubs
1 CNG Hub 2 CNG Hubs including Hub 11
Time (mins) Hub 11 Hub 12 Hub 2 Hub 9 Best Option
5 19% 20%
(1)
19%
(0)
23%
(4)
9
10 43% 45%
(2)
47%
(4)
51%
(8)
9
15 55% 65%
(10)
61%
(6)
64%
(9)
12
20 71% 82%
(11)
80%
(9)
76%
(5)
12
25 80% 88%
(8)
89%
(9)
86%
(6)
2
30 88% 91%
(3)
95%
(7)
94%
(6)
2

Note: Values in brackets represent percentage increase in coverage when adding a 2nd CNG Hub to CNG Hub 11


  1. See: https://cngvp.org/natural-gas-vehicles/

  2. R.L. Polk & Company was a provider of business and marketing information, including counts of vehicles by GVW, make and model, to insurance companies and the automotive sector. The company was acquired by IHS Markit in 2013 (FenderBender 2019).

  3. See: https://www.dmtispatial.com/

Submitted: June 01, 2024 AEST

Accepted: October 24, 2024 AEST

References

FenderBender. 2019. “IHS Completes Acquisition of R.L. Polk & Company.” https:/​/​www.fenderbender.com/​news/​article/​55045205/​ihs-completes-acquisition-of-rl-polk-company.
Gingerich, K., H. Maoh, and W. Anderson. 2016. “Characterization of International Origin–Destination Truck Movements across Two Major U.S.–Canadian Border Crossings.” Transportation Research Record 2547 (1): 1–10. https:/​/​doi.org/​10.3141/​2547-01.
Google Scholar
US Department of Energy. 2014. “Costs Associated with Compressed Natural Gas Vehicle Fueling Infrastructure: Factors to Consider in the Implementation of Fueling Stations and Equipment.” https:/​/​afdc.energy.gov/​files/​u/​publication/​cng_infrastructure_costs.pdf.

This website uses cookies

We use cookies to enhance your experience and support COUNTER Metrics for transparent reporting of readership statistics. Cookie data is not sold to third parties or used for marketing purposes.

Powered by Scholastica, the modern academic journal management system