
1. Questions
Neighborhood walkability plays a crucial role in shaping the mobility and overall well-being of older adults (Carson et al. 2023; Kim, Yu, and Woo 2023; Woo, Yu, and Lee 2019). While prior research has explored the impact of walkability on general physical activity (Juul and Nordbø 2023; Keats et al. 2020), the specific relationship between walkability and walking behavior to third places among older adults remains understudied. A third place is a social environment outside of the home and workplace, such as parks, cafes, libraries, or community centers, where individuals gather to interact and build social connections (Lee and Tan 2023). This study assumes that improved neighborhood walkability promotes walking to third places and third-place visitation, enhancing physical health, mental health, and social connections among older adults, with direct effects on behavior and indirect effects on health outcomes.Additionally, there is a gap in understanding how frequent use of these third places, combined with walking behavior, affects the physical, mental, and social health of this population.
This study addresses two key research questions:
-
How does neighborhood walkability influence older adults’ walking behavior and frequency of visits to third places?
-
How does frequent use of third places and walking behavior influence older adults’ physical and mental health, as well as their social connections?
By answering these questions, this study aims to provide insights into the role of walkable environments in enhancing the overall well-being of older adults through access to third places.
2. Methods
Data were collected via an online survey of 638 older adults aged 65 and above in Orlando, Florida. Participants were recruited from July to September 2024 through community centers, senior organizations, social media ads, and community boards. Table 1 provides an overview of the variables, measurements, and descriptive statistics. This study employed Structural Equation Modeling (SEM) via M-Plus 8.5 to simultaneously assess direct and indirect relationships, making it ideal for evaluating how neighborhood walkability affects walking behavior, third-place visits, and their impact on health outcomes. The SEM model used Weighted Least Squares (WLS) estimation for its robustness with binary outcome variables. WLS is particularly advantageous in this context because it minimizes the sum of weighted squared residuals, allowing for variance adjustments that accommodate the non-normality often present with binary outcomes, making it a more reliable choice for achieving unbiased parameter estimates and accurate standard errors (Brown 2006).
3. Findings
The model demonstrated a strong fit, with a root mean square error of approximation (RMSEA) of 0.025 (where <0.05 indicates a good fit), a comparative fit index (CFI) of 0.94 (>0.90 signifies a good fit), and a Tucker-Lewis index (TLI) of 0.93 (>0.90 also indicates a good fit). These results suggest that the constructed SEM model aligns well with the data (Figure 1).
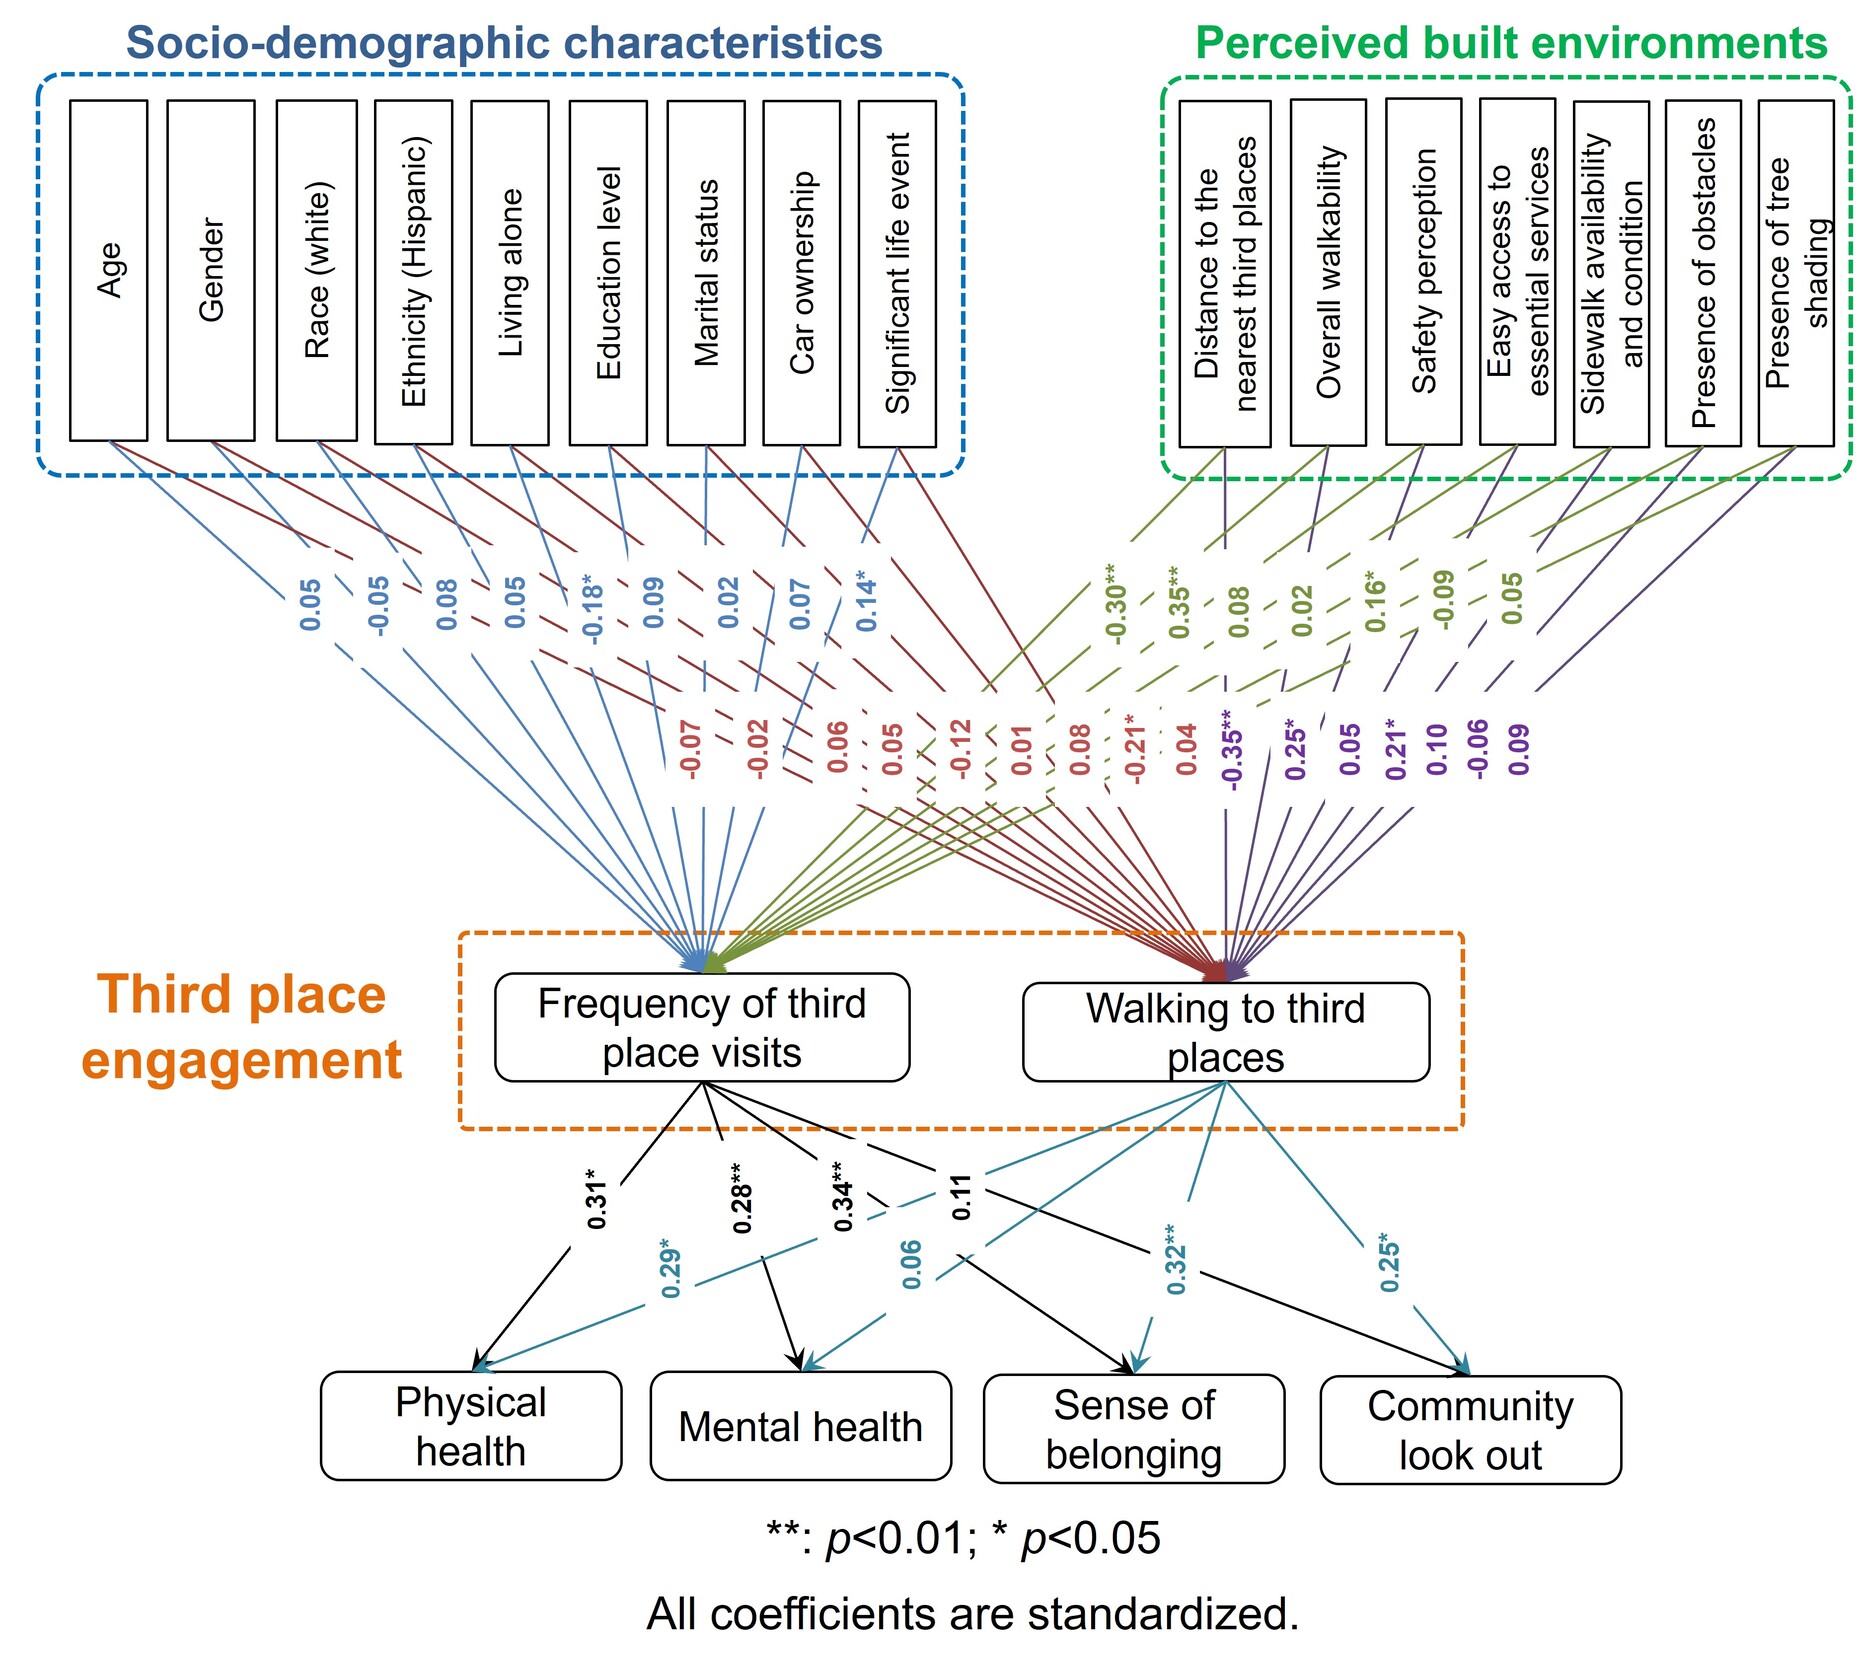
The analysis revealed several significant relationships between socio-demographic factors, perceived built environments, and both the frequency of third place visits and walking to third places. Living alone was negatively associated with the frequency of third place visits (β=−0.18, p<0.05), indicating that individuals living alone are less likely to visit third places. In contrast, experiencing significant life events in the past year had a positive relationship with third place visits (β=0.14, p<0.01), meaning individuals who experienced a significant life event were more likely to frequent third places. These environments may provide social support and a sense of connection during transitional periods, fulfilling the need for interaction, comfort, or routine in times of change. This finding suggests that third places offer valuable emotional and social resources, making them appealing to individuals navigating significant life events.
The distance to the nearest third places was negatively associated with both the frequency of third place visits (β=−0.30, p<0.01) and walking to third places (β=−0.35, p<0.01), indicating that individuals living farther away from third places are less likely to visit or walk to them. In contrast, perceived overall walkability showed a positive association with both the frequency of third place visits (β=0.35, p<0.01) and walking to third places (β=0.25, p<0.01), suggesting that better perceived walkability promotes more frequent visits and walking. The perceived availability and condition of sidewalks were positively associated with the frequency of third place visits (β=0.16, p<0.05), showing that well-maintained sidewalks enable more visits. Easy access to essential services was positively related to walking to third places (β=0.21, p<0.05), indicating that individuals who find essential services easily accessible are more likely to walk to third places.
Both frequency of third place visits and walking to third places were positively associated with key health and social outcomes. Frequency of third place visits was positively related to physical health (β=0.31, p<0.05), suggesting that individuals who visit third places more frequently tend to report better physical health. A similar positive relationship was found between frequency of visits and mental health (β=0.28, p<0.01), indicating that more frequent visits are linked to better mental well-being. Additionally, a positive association was revealed between frequency of visits and sense of belonging (β=0.34, p<0.01), showing that regular third place visitors feel a stronger sense of belonging within their community.
Similarly, walking to third places was positively associated with physical health (β=0.29, p<0.05), suggesting that those who walk to third places tend to report better physical health. The analysis also demonstrated a significant positive relationship between walking to third places and sense of belonging (β=0.32, p<0.01), indicating a stronger connection and community belonging for those who walk. Lastly, community look out was positively related to walking to third places (β=0.25, p<0.05), suggesting that individuals who walk to third places perceive a greater sense of mutual care and support within their community.
One limitation of this study is the treatment of certain variables as continuous measures. Although this approach is standard in structural equation modeling, it assumes equal spacing between response categories, which may not fully reflect the ordinal nature of Likert data and could potentially introduce bias. A further limitation of this study is the absence of data on disability or limited mobility, which would have been useful in assessing the impact of mobility challenges on walkability and third place visits. Future research should consider including this variable to gain a more comprehensive understanding of community engagement. Moreover, a limitation of this study is the lack of data on participants’ residential addresses and the specific locations of the third places they visited, which prevented us from examining how spatial distribution affects visit frequency. Additionally, without data on neighborhood locations, we were unable to obtain accurate walk scores, limiting our ability to assess neighborhood walkability quantitatively.